Broadcasting And Mobile Towers - Analysys Mason
Broadcasting And Mobile Towers - Analysys Mason
Broadcasting And Mobile Towers - Analysys Mason

Create successful ePaper yourself
Turn your PDF publications into a flip-book with our unique Google optimized e-Paper software.
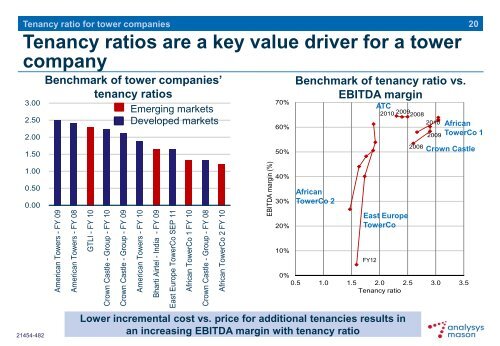
American <strong>Towers</strong> - FY 09American <strong>Towers</strong> - FY 08GTLI - FY 10Crown Castle - Group - FY 10Crown Castle - Group - FY 09American <strong>Towers</strong> - FY 10Bharti Airtel - India - FY 09East Europe TowerCo SEP 11African TowerCo 1 FY 10Crown Castle - Group - FY 08African TowerCo 2 FY 10EBITDA margin (%)Tenancy ratio for tower companiesTenancy ratios are a key value driver for a towercompany3.002.502.001.50Benchmark of tower companies’tenancy ratiosEmerging marketsDeveloped markets70%60%50%Benchmark of tenancy ratio vs.EBITDA marginATC2010 2009 200820102008200920AfricanTowerCo 1Crown Castle1.0040%0.500.0030%20%AfricanTowerCo 2East EuropeTowerCo10%FY120%0.5 1.0 1.5 2.0 2.5 3.0 3.5Tenancy ratio21454-482Lower incremental cost vs. price for additional tenancies results inan increasing EBITDA margin with tenancy ratio