High Efficiency Potential of Cz Silicon Solar Cells ... - ISC Konstanz
High Efficiency Potential of Cz Silicon Solar Cells ... - ISC Konstanz
High Efficiency Potential of Cz Silicon Solar Cells ... - ISC Konstanz

Create successful ePaper yourself
Turn your PDF publications into a flip-book with our unique Google optimized e-Paper software.
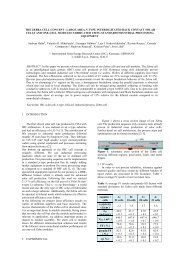
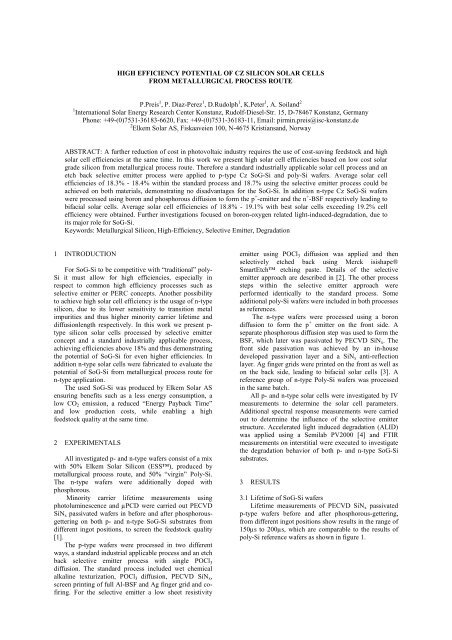
HIGH EFFICIENCY POTENTIAL OF CZ SILICON SOLAR CELLSFROM METALLURGICAL PROCESS ROUTEP.Preis 1 , P. Diaz-Perez 1 , D.Rudolph 1 , K.Peter 1 , A. Soiland 21 International <strong>Solar</strong> Energy Research Center <strong>Konstanz</strong>, Rudolf-Diesel-Str. 15, D-78467 <strong>Konstanz</strong>, GermanyPhone: +49-(0)7531-36183-6620, Fax: +49-(0)7531-36183-11, Email: pirmin.preis@isc-konstanz.de2 Elkem <strong>Solar</strong> AS, Fiskaaveien 100, N-4675 Kristiansand, NorwayABSTRACT: A further reduction <strong>of</strong> cost in photovoltaic industry requires the use <strong>of</strong> cost-saving feedstock and highsolar cell efficiencies at the same time. In this work we present high solar cell efficiencies based on low cost solargrade silicon from metallurgical process route. Therefore a standard industrially applicable solar cell process and anetch back selective emitter process were applied to p-type <strong>Cz</strong> SoG-Si and poly-Si wafers. Average solar cellefficiencies <strong>of</strong> 18.3% - 18.4% within the standard process and 18.7% using the selective emitter process could beachieved on both materials, demonstrating no disadvantages for the SoG-Si. In addition n-type <strong>Cz</strong> SoG-Si waferswere processed using boron and phosphorous diffusion to form the p + -emitter and the n + -BSF respectively leading tobifacial solar cells. Average solar cell efficiencies <strong>of</strong> 18.8% - 19.1% with best solar cells exceeding 19.2% cellefficiency were obtained. Further investigations focused on boron-oxygen related light-induced-degradation, due toits major role for SoG-Si.Keywords: Metallurgical <strong>Silicon</strong>, <strong>High</strong>-<strong>Efficiency</strong>, Selective Emitter, Degradation1 INTRODUCTIONFor SoG-Si to be competitive with “traditional” poly-Si it must allow for high efficiencies, especially inrespect to common high efficiency processes such asselective emitter or PERC concepts. Another possibilityto achieve high solar cell efficiency is the usage <strong>of</strong> n-typesilicon, due to its lower sensitivity to transition metalimpurities and thus higher minority carrier lifetime anddiffusionlength respectively. In this work we present p-type silicon solar cells processed by selective emitterconcept and a standard industrially applicable process,achieving efficiencies above 18% and thus demonstratingthe potential <strong>of</strong> SoG-Si for even higher efficiencies. Inaddition n-type solar cells were fabricated to evaluate thepotential <strong>of</strong> SoG-Si from metallurgical process route forn-type application.The used SoG-Si was produced by Elkem <strong>Solar</strong> ASensuring benefits such as a less energy consumption, alow CO 2 emission, a reduced “Energy Payback Time”and low production costs, while enabling a highfeedstock quality at the same time.2 EXPERIMENTALSAll investigated p- and n-type wafers consist <strong>of</strong> a mixwith 50% Elkem <strong>Solar</strong> <strong>Silicon</strong> (ESS), produced bymetallurgical process route, and 50% “virgin” Poly-Si.The n-type wafers were additionally doped withphosphorous.Minority carrier lifetime measurements usingphotoluminescence and µPCD were carried out PECVDSiN x passivated wafers in before and after phosphorousgetteringon both p- and n-type SoG-Si substrates fromdifferent ingot positions, to screen the feedstock quality[1].The p-type wafers were processed in two differentways, a standard industrial applicable process and an etchback selective emitter process with single POCl 3diffusion. The standard process included wet chemicalalkaline texturization, POCl 3 diffusion, PECVD SiN x ,screen printing <strong>of</strong> full Al-BSF and Ag finger grid and c<strong>of</strong>iring.For the selective emitter a low sheet resistivityemitter using POCl 3 diffusion was applied and thenselectively etched back using Merck isishape®SmartEtch etching paste. Details <strong>of</strong> the selectiveemitter approach are described in [2]. The other processsteps within the selective emitter approach wereperformed identically to the standard process. Someadditional poly-Si wafers were included in both processesas references.The n-type wafers were processed using a borondiffusion to form the p + emitter on the front side. Aseparate phosphorous diffusion step was used to form theBSF, which later was passivated by PECVD SiN x . Thefront side passivation was achieved by an in-housedeveloped passivation layer and a SiN x anti-reflectionlayer. Ag finger grids were printed on the front as well ason the back side, leading to bifacial solar cells [3]. Areference group <strong>of</strong> n-type Poly-Si wafers was processedin the same batch.All p- and n-type solar cells were investigated by IVmeasurements to determine the solar cell parameters.Additional spectral response measurements were carriedout to determine the influence <strong>of</strong> the selective emitterstructure. Accelerated light induced degradation (ALID)was applied using a Semilab PV2000 [4] and FTIRmeasurements on interstitial were executed to investigatethe degradation behavior <strong>of</strong> both p- and n-type SoG-Sisubstrates.3 RESULTS3.1 Lifetime <strong>of</strong> SoG-Si wafersLifetime measurements <strong>of</strong> PECVD SiN x passivatedp-type wafers before and after phosphorous-gettering,from different ingot positions show results in the range <strong>of</strong>150µs to 200µs, which are comparable to the results <strong>of</strong>poly-Si reference wafers as shown in figure 1.
Lifetime [s]Lifetime [s]500450400Reference50% ESSTable I: Average solar cell parameters <strong>of</strong> the p-type solarcells processed using a standard industrially applicableprocess (Standard) and a selective emitter (SE).3503002502001501005000 20 40 60 80 100Figure 1: Average lifetimes <strong>of</strong> p-type wafers fromdifferent ingot positions measured usingphotoluminescence for non diffused (open symbols) andphosphorous gettered wafers (closed symbols).After phosphorous diffusion gettering the lifetimeincreases, especially wafers from near the ingot tail showvalues up to 425µs and thus higher lifetimes than thereference wafers demonstrating the high quality <strong>of</strong> ESSfeedstock, which should allow for high efficiencies.Lifetime <strong>of</strong> the SoG-Si wafers increases towards higherfraction solidified according to the higher compensation[5].Lifetime results <strong>of</strong> the n-type wafers show theopposite trend observed on p-type wafers. The lifetime isdecreasing with higher fraction solidified as it can beseen in figure 2.The results show a strong dependency onthe measurements method. Lifetimes between 250µs and450µs were measured on as-cut wafers using µW-PCD,lifetimes between 175µs and 350µs on the same waferswere measured using photoluminescence.450400350N-type AsCutFraction solidified [%]PLuPCDVoc[mV]Jsc[mA/cm²]FF[%]η[%]50% ESSStandard 630.0 37.4 77.8 18.3SE 635.6 37.3 78.9 18.7100% Poly-SiStandard 628.9 36.8 79.0 18.3SE 635.9 37.1 79.4 18.7The open-circuit voltage <strong>of</strong> the selective emitter solarcells is about 5 to 7 mV higher than observed on thestandard processed solar cells, caused by less Augerrecombination in the emitter region. Due to a differentscreen printing layout on the front side with narrowdistance between the printed Ag fingers for the selectiveemitter cells the short circuit current is comparable forboth processes, whereas the FF is higher for the selectiveemitter solar cells. FF’s <strong>of</strong> 78.9% and even higher couldbe achieved demonstrating a good contact formationbetween the Ag paste and the emitter, leading to lowcontact resistance. The average efficiency <strong>of</strong> the selectiveemitter solar cells is 0.4% absolute higher. The results <strong>of</strong>table I show that the SoG-Si material can keep up withthe 100% Poly-Si material for both the standard processand the selective emitter process.Some standard processed solar cells from both the50% ESS and the 100% Poly-Si feedstock, representingdifferent ingot positions, from seed to tail, were selectedfor determination <strong>of</strong> LID. Therefore IV measurementswere performed before and after an accelerated lightinduced degradation step carried out using a SemilabPV2000 tool [4]. The relative loss in solar cell efficiencywas calculated out <strong>of</strong> both measurements results and canbe seen in Figure 3.-1,0-1,23002502001500,0 0,2 0,4 0,6 0,8Fraction solidified, f sFigure 2: Lifetime measured on as-cut SoG-Si n-typewafers from different ingot positions using µPCD (black)and photoluminescence (red).After an additional gettering step lifetimes between300µs at the tail position and up to 950µs close the seedposition could be observed.3.2 <strong>Solar</strong> cell results and LID results <strong>of</strong> p-type solar cellsIV parameters <strong>of</strong> the p-type solar cells from bothSoG-Si and Poly-Si processed by the standard processand the selective emitter process have been measured andare summarized in table I. The shown values are averagevalues over at least 20 solar cells.[ rel]-1,4-1,6-1,8-2,0-2,2-2,4-2,650% ESSReferenceSeed Middle Middle TailWafer positionFigure 3: Relative losses in solar cell efficiency <strong>of</strong>standard processed solar cells from both SoG-Si (50%ESS) and Poly-Si (Reference), due to LIDAt the seed position both materials show identicalLID with 2.5% relative loss in cell efficiency. For waferpositions at the ingot middle and the tail LID is around2.0% for the ESS based solar cells, whereas thereference cells show a lower LID between 1.1% and1.4%. The trend <strong>of</strong> decreasing LID towards the ingot tailcorrelates with FTIR measurements <strong>of</strong> interstitial oxygen.The higher LID on the SoG-Si based solar cells is
expected to be caused by the higher boron doping, whatcan be seen at the lower resistivity (2-3Ω*cm for ESSwafers and 3-4 Ω*cm for poly-Si wafers), and higherinterstitial oxygen, which is not feedstock related butdepending on the crystallization process.3.3 <strong>Solar</strong> cell results and LID results <strong>of</strong> n-type solar cells<strong>Solar</strong> cell parameters <strong>of</strong> the SoG-Si and the poly-Si n-type wafers are summarized in Table II. For the SoG-Simaterial several ingot positions have been investigated.The position 4 is closest to the seed and shows a resistivity<strong>of</strong> 5.5 Ω*cm, while position 13 is close to the ingot tail andshows a resistivity <strong>of</strong> 0.7Ω*cm.Table II: Average solar cell results over app. 10 n-typesolar cells <strong>of</strong> each group from 50% ESS feedstock and100% poly-Si feedstockVoc[mV]Jsc[mA/cm²]FF[%]η[%]50% ESSPos.4 593.1 37.5 75.6 16.8Pos.6 633.0 38.6 78.0 19.1Pos.8 634.7 38.6 78.1 19.1Pos.11 635.4 38.5 78.1 19.1Pos.13 635.1 37.8 78.3 18.8100%Poly-Si 636.4 38.9 78.2 19.4<strong>Solar</strong> cells from position 4 <strong>of</strong> the ESS based solar cellsshow a very low voltage below 600 mV and also lower Jscand FF compared to the other solar cells from the sameingot. This low performance can be explained by patterns<strong>of</strong> concentric rings <strong>of</strong> reduced lifetime, observed usingphotoluminescence measurements. Possible reasons couldbe in grown intrinsic defects and defect clusters as alreadyreported [6].<strong>Solar</strong> cells from the position 6 to position 11 showaverage cell efficiencies <strong>of</strong> 19.1%, whereas solar cells fromposition 13 show lower average efficiency <strong>of</strong> 18.8%, dueto a significant lower Jsc, which is caused by low lifetimesclose the ingot tail.The 100% Poly-Si material leads to average solar cellefficiencies <strong>of</strong> 19.4%, due to higher Voc and Jsc comparedto the SoG-Si, what can be explained by the higher carrierlifetime, due to less dopant and impurity concentrations.Due to the significant amount <strong>of</strong> boron in the SoG-SiLID measurements were carried out the same way as forthe p-type solar cells. The n-type reference cells from100% Poly-Si were investigated the same way, but asexpected no degradation was observed. The results <strong>of</strong> theLID measurements are shown in figure 4.[ rel]-0,4-0,6-0,8-1,0-1,250% ESSFigure 4: Results <strong>of</strong> LID measurements on n-type solarcells from SoG-Si feedstock. Position 4 is close to the ingotseed, position 13 is close to the ingot tailLID was determined to be around 1.2% relative loss incell efficiency at the positions close to the seed, decreasingto 0.4% relative loss in cell efficiency close the ingot tail.Due to a stable boron concentration along the ingotpositions the LID has to be related to the interstitial oxygenconcentration, which was confirmed by FTIRmeasurements <strong>of</strong> interstitial oxygen. Those measurementsshow O i concentrations around 16.5 ppma at the ingot seedand 10 ppma at the ingot tail.4 CONCLUSIONSIt was shown, that p-type <strong>Cz</strong> solar cells based onESS feedstock, which is purified by metallurgicalprocess route, can keep up with solar cell efficiencies <strong>of</strong>100% poly-Si solar cells, even in consideration <strong>of</strong>possible high efficiency processes such as a selectiveemitter. LID is higher for the ESS based solar cells,due to the higher boron doping and higher interstitialoxygen, which is not feedstock related but depending onthe crystallization process. But LID appears to be in atolerable range between 2.0% – 2.5% relative loss in cellefficiency, depending on the ingot position.We could also show that n-type SoG-Si frommetallurgical process route can lead to cell efficienciesexceeding 19% and thus has the potential to play animportant role in future photovoltaic industry.5 ACKNOWLEDGEMENTSThe authors acknowledge Merck KGaA Darmstadt(Arjan Meijer) for carrying out the selective emitteretchback and IFE (Dr. Rune Søndenå) for carrying outminority carrier lifetime measurements.6 REFERENCES[1] R. Søndena et al., Electrical properties <strong>of</strong>compensated n- and p-type monocrystalline silicon,26 th EUPVSEC, Hamburg, Germany, (2011).[2] D. Rudolph et al., Selective emitter process formulticrystalline silicon solar cells by screen printingwith only one POCl 3 diffusion, 27 th EUPVSEC,Frankfurt, Germany, 2012[3] V. Mihailetchi et al., Screen printed n-type siliconsolar cells for industrial application, 25 th EUPVSEC,Valencia, Spain, 2010[4] M. Wilson et al., Accelerated light-induceddegradation (ALID) for monitoring <strong>of</strong> defects in PVsilicon wafers and solar cells, Journal <strong>of</strong> electronicsmat., Vol 39, No.6, (2010).[5] S. Dubois et al., Effects <strong>of</strong> the compensation level oncarrier lifetime <strong>of</strong> crystalline silicon, Applied physicsletters, Vol 93, Issue 3, 2008.[6] A. Edler et al.,, <strong>High</strong> lifetime on n-type silicon wafersobtained after boron diffusion, 25 th EUPVSEC,Valencia, Spain, 20104 6 8 10 12 14Wafer position