Silicon diffusion in aluminum for rear passivated ... - ISC Konstanz
Silicon diffusion in aluminum for rear passivated ... - ISC Konstanz
Silicon diffusion in aluminum for rear passivated ... - ISC Konstanz

Create successful ePaper yourself
Turn your PDF publications into a flip-book with our unique Google optimized e-Paper software.
APPLIED PHYSICS LETTERS 98, 153508 2011<br />
<strong>Silicon</strong> <strong>diffusion</strong> <strong>in</strong> alum<strong>in</strong>um <strong>for</strong> <strong>rear</strong> <strong>passivated</strong> solar cells<br />
Elias Urrejola, 1,a Kristian Peter, 2 Heiko Plagwitz, 2 and Gunnar Schubert 2<br />
1 International Solar Energy Research Center (<strong>ISC</strong>)–<strong>Konstanz</strong>, Rudolf-Diesel-Str. 15,<br />
D-78467 <strong>Konstanz</strong>, Germany<br />
2 Sunways AG, Macairestrasse 3-5, D-78467 <strong>Konstanz</strong>, Germany<br />
Received 7 March 2011; accepted 28 March 2011; published onl<strong>in</strong>e 12 April 2011<br />
We show that the lateral spread of silicon <strong>in</strong> a screen-pr<strong>in</strong>ted alum<strong>in</strong>um layer <strong>in</strong>creases by<br />
1.500.06 m/ °C, when <strong>in</strong>creas<strong>in</strong>g the peak fir<strong>in</strong>g temperature with<strong>in</strong> an <strong>in</strong>dustrially applicable<br />
range. In this way, the maximum spread limit of diffused silicon <strong>in</strong> alum<strong>in</strong>um is predictable and does<br />
not depend on the contact area size but on the fir<strong>in</strong>g temperature. There<strong>for</strong>e, the geometry of the <strong>rear</strong><br />
side pattern can <strong>in</strong>fluence not only series resistance losses with<strong>in</strong> the solar cell but the process of<br />
contact <strong>for</strong>mation itself. In addition, too fast cool<strong>in</strong>g lead to Kirkendall void <strong>for</strong>mations <strong>in</strong>stead of<br />
an eutectic layer. © 2011 American Institute of Physics. doi:10.1063/1.3579541<br />
The improvement of solar cell efficiency <strong>in</strong> <strong>in</strong>dustrial<br />
production has motivated important contributions to <strong>rear</strong> surface<br />
passivation techniques. 1–3 However, the optimization of<br />
the local contacts between screen-pr<strong>in</strong>ted alum<strong>in</strong>um pastes<br />
and silicon is not trivial and requires deeper understand<strong>in</strong>g of<br />
the metal–semiconductor <strong>in</strong>teraction. Indeed, a compromise<br />
between the contact area and f<strong>in</strong>ger spac<strong>in</strong>g is an essential<br />
issue when reduc<strong>in</strong>g series resistance. 4–6 On the other hand,<br />
the local <strong>for</strong>mation of a high-quality p + -doped layer backsurface-field<br />
BSF to improve the cell per<strong>for</strong>mance, 7–9 is<br />
still a challenge. Recently, it has been shown that the high<br />
overlapp<strong>in</strong>g of alum<strong>in</strong>um on each side of the local contact<br />
open<strong>in</strong>g is essential <strong>for</strong> a well-<strong>for</strong>med local BSF and the<br />
m<strong>in</strong>imization of the contact resistivity. 10 Thereby, the design<br />
of the <strong>rear</strong> side pattern can <strong>in</strong>fluence the series resistance<br />
losses and the process of contact <strong>for</strong>mation. In this letter, we<br />
search <strong>for</strong> the m<strong>in</strong>imum contact spac<strong>in</strong>g allowed <strong>for</strong> an optimal<br />
<strong>rear</strong> side pattern based on the <strong>in</strong>ter<strong>diffusion</strong> between<br />
liquid alum<strong>in</strong>um and silicon. These results may have applications<br />
on screen-pr<strong>in</strong>ted back-contacted and <strong>rear</strong> <strong>passivated</strong><br />
silicon solar cells.<br />
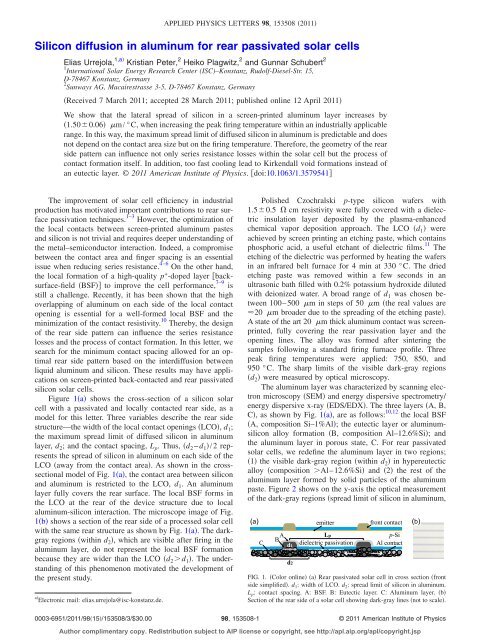
Figure 1a shows the cross-section of a silicon solar<br />
cell with a <strong>passivated</strong> and locally contacted <strong>rear</strong> side, as a<br />
model <strong>for</strong> this letter. Three variables describe the <strong>rear</strong> side<br />
structure—the width of the local contact open<strong>in</strong>gs LCO, d 1 ;<br />
the maximum spread limit of diffused silicon <strong>in</strong> alum<strong>in</strong>um<br />
layer, d 2 ; and the contact spac<strong>in</strong>g, L p . Thus, d 2 −d 1 /2 represents<br />
the spread of silicon <strong>in</strong> alum<strong>in</strong>um on each side of the<br />
LCO away from the contact area. As shown <strong>in</strong> the crosssectional<br />
model of Fig. 1a, the contact area between silicon<br />
and alum<strong>in</strong>um is restricted to the LCO, d 1 . An alum<strong>in</strong>um<br />
layer fully covers the <strong>rear</strong> surface. The local BSF <strong>for</strong>ms <strong>in</strong><br />
the LCO at the <strong>rear</strong> of the device structure due to local<br />
alum<strong>in</strong>um-silicon <strong>in</strong>teraction. The microscope image of Fig.<br />
1b shows a section of the <strong>rear</strong> side of a processed solar cell<br />
with the same <strong>rear</strong> structure as shown by Fig. 1a. The darkgray<br />
regions with<strong>in</strong> d 2 , which are visible after fir<strong>in</strong>g <strong>in</strong> the<br />
alum<strong>in</strong>um layer, do not represent the local BSF <strong>for</strong>mation<br />
because they are wider than the LCO d 2 d 1 . The understand<strong>in</strong>g<br />
of this phenomenon motivated the development of<br />
the present study.<br />
a Electronic mail: elias.urrejola@isc-konstanz.de.<br />
Polished Czochralski p-type silicon wafers with<br />
1.50.5 cm resistivity were fully covered with a dielectric<br />
<strong>in</strong>sulation layer deposited by the plasma-enhanced<br />
chemical vapor deposition approach. The LCO d 1 were<br />
achieved by screen pr<strong>in</strong>t<strong>in</strong>g an etch<strong>in</strong>g paste, which conta<strong>in</strong>s<br />
phosphoric acid, a useful etchant of dielectric films. 11 The<br />
etch<strong>in</strong>g of the dielectric was per<strong>for</strong>med by heat<strong>in</strong>g the wafers<br />
<strong>in</strong> an <strong>in</strong>frared belt furnace <strong>for</strong> 4 m<strong>in</strong> at 330 °C. The dried<br />
etch<strong>in</strong>g paste was removed with<strong>in</strong> a few seconds <strong>in</strong> an<br />
ultrasonic bath filled with 0.2% potassium hydroxide diluted<br />
with deionized water. A broad range of d 1 was chosen between<br />
100–500 m <strong>in</strong> steps of 50 m the real values are<br />
20 m broader due to the spread<strong>in</strong>g of the etch<strong>in</strong>g paste.<br />
A state of the art 20 m thick alum<strong>in</strong>um contact was screenpr<strong>in</strong>ted,<br />
fully cover<strong>in</strong>g the <strong>rear</strong> passivation layer and the<br />
open<strong>in</strong>g l<strong>in</strong>es. The alloy was <strong>for</strong>med after s<strong>in</strong>ter<strong>in</strong>g the<br />
samples follow<strong>in</strong>g a standard fir<strong>in</strong>g furnace profile. Three<br />
peak fir<strong>in</strong>g temperatures were applied: 750, 850, and<br />
950 °C. The sharp limits of the visible dark-gray regions<br />
d 2 were measured by optical microscopy.<br />
The alum<strong>in</strong>um layer was characterized by scann<strong>in</strong>g electron<br />
microscopy SEM and energy dispersive spectrometry/<br />
energy dispersive x-ray EDS/EDX. The three layers A, B,<br />
C, as shown by Fig. 1a, are as follows: 10,12 the local BSF<br />
A, composition Si–1%Al; the eutectic layer or alum<strong>in</strong>umsilicon<br />
alloy <strong>for</strong>mation B, composition Al–12.6%Si; and<br />
the alum<strong>in</strong>um layer <strong>in</strong> porous state, C. For <strong>rear</strong> <strong>passivated</strong><br />
solar cells, we redef<strong>in</strong>e the alum<strong>in</strong>um layer <strong>in</strong> two regions;<br />
1 the visible dark-gray region with<strong>in</strong> d 2 <strong>in</strong> hypereutectic<br />
alloy composition Al–12.6%Si and 2 the rest of the<br />
alum<strong>in</strong>um layer <strong>for</strong>med by solid particles of the alum<strong>in</strong>um<br />
paste. Figure 2 shows on the y-axis the optical measurement<br />
of the dark-gray regions spread limit of silicon <strong>in</strong> alum<strong>in</strong>um,<br />
FIG. 1. Color onl<strong>in</strong>e a Rear <strong>passivated</strong> solar cell <strong>in</strong> cross section front<br />
side simplified. d 1 : width of LCO. d 2 : spread limit of silicon <strong>in</strong> alum<strong>in</strong>um.<br />
L p : contact spac<strong>in</strong>g. A: BSF. B: Eutectic layer. C: Alum<strong>in</strong>um layer. b<br />
Section of the <strong>rear</strong> side of a solar cell show<strong>in</strong>g dark-gray l<strong>in</strong>es not to scale.<br />
0003-6951/2011/9815/153508/3/$30.00<br />
98, 153508-1<br />
© 2011 American Institute of Physics<br />
Author complimentary copy. Redistribution subject to AIP license or copyright, see http://apl.aip.org/apl/copyright.jsp
153508-2 Urrejola et al. Appl. Phys. Lett. 98, 153508 2011<br />
FIG. 2. Temperature l<strong>in</strong>ear dependency of the spread limit of silicon <strong>in</strong> the<br />
screen-pr<strong>in</strong>ted alum<strong>in</strong>um layer. Error bars shown <strong>for</strong> d 1 =500 m.<br />
d 2 , versus the peak fir<strong>in</strong>g temperature, <strong>for</strong> different LCO<br />
widths, d 1 . For a LCO of 500 m, the error bars plotted<br />
show small standard deviation <strong>in</strong> the optical microscopy<br />
analysis. For three d 1 values, a l<strong>in</strong>ear fit is shown as a<br />
guide <strong>for</strong> the eye. The same l<strong>in</strong>ear dependency on the<br />
peak fir<strong>in</strong>g temperature is remarkable <strong>for</strong> all data. The<br />
slope of the l<strong>in</strong>e is 30.12 m/ °C, which means, on<br />
each side of the LCO the spread of silicon <strong>in</strong>creases by<br />
1.500.06 m/ °C. Additionally, the lateral spread limit<br />
of silicon from the edge of the LCO, d 2 −d 1 /2, is determ<strong>in</strong>ed<br />
as follows: 759 m at 750 °C, 22530 m<br />
at 850 °C, and 37590 m at 950 °C. These results<br />
show that <strong>for</strong> a certa<strong>in</strong> fir<strong>in</strong>g temperature the spread limit of<br />
silicon <strong>in</strong> the alum<strong>in</strong>um layer is constant and does not depend<br />
on the width of the LCO. Thus, the maximum spread<br />
limit of diffused silicon <strong>in</strong> alum<strong>in</strong>um is predictable.<br />
A l<strong>in</strong>e scann<strong>in</strong>g was per<strong>for</strong>med by EDX <strong>in</strong> the<br />
alum<strong>in</strong>um-silicon alloy<strong>in</strong>g structure <strong>for</strong> two samples fired at<br />
the high peak fir<strong>in</strong>g temperature of 950 °C. The SEM micrographs<br />
and the EDX results are shown <strong>in</strong> Fig. 3. After<br />
laser cutt<strong>in</strong>g, the cross-sectional samples were analyzed under<br />
the follow<strong>in</strong>g conditions: acceleration voltage 10 kV,<br />
specimen current 780 pA, scann<strong>in</strong>g speed 5.4 s/pxl, and<br />
electron beam focused to 660 nm <strong>in</strong> diameter. Counts at the<br />
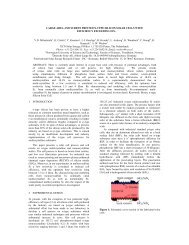
FIG. 3. SEM/EDX analysis. a 80 m LCO, eutectic and BSF <strong>for</strong>med. b<br />
EDX analysis of a and Gaussian fit, follow<strong>in</strong>g the silicon concentration to<br />
the spread limit at 375 m. c 125 m LCO, Kirkendall void and BSF<br />
<strong>for</strong>med. d EDX analysis of c. The dotted l<strong>in</strong>es <strong>in</strong> a, c delimit the BSF;<br />
<strong>in</strong> b, d the region showed by the SEM figures.<br />
Si K l<strong>in</strong>e were taken <strong>for</strong> 300 s with a l<strong>in</strong>e scan width of<br />
10 m. The silicon content was measured from the center<br />
of the LCO, 200 m to the left and right. Although the<br />
results of this method are <strong>in</strong>fluenced by structured <strong>in</strong>homogeneities<br />
of the alum<strong>in</strong>um layer, 14 we see that the silicon<br />
concentration <strong>in</strong> the alum<strong>in</strong>um decreases with <strong>in</strong>creas<strong>in</strong>g distance<br />
from the center of <strong>in</strong>terface LCO, as already published<br />
elsewhere 15,16 see Fig. 3b.<br />
Figure 3a shows an eutectic layer <strong>for</strong>med below the<br />
alum<strong>in</strong>um layer <strong>for</strong> a d 1 80 m. Its silicon concentration,<br />
as shown by Fig. 3b, follows a Gaussian fit centered at the<br />
LCO, decreas<strong>in</strong>g to the left and right, to the predicted spread<br />
limit of 375 m. From the Gaussian fit, the maximum concentration<br />
is represented by 27 counts, while the concentration<br />
at the spread limit d 2 −d 1 /2 is represented approximately<br />
by three counts. For a high peak fir<strong>in</strong>g temperature<br />
of 950 °C a silicon concentration of Cd 2 −d 1 /2/C 0<br />
=11.11% is still present <strong>in</strong> the alum<strong>in</strong>um layer at the spread<br />
limit of silicon, 375 m far away from the LCO. The BSF<br />
<strong>for</strong>ms homogeneously below the contacts, up to 8 m deep.<br />
Figure 3c shows no eutectic layer <strong>for</strong>med below the<br />
contacts but shows <strong>in</strong>stead a void. For this sample, the<br />
alum<strong>in</strong>um was deposited on a broader contact open<strong>in</strong>g d 1<br />
125 m and fired at the high peak fir<strong>in</strong>g temperature<br />
fast cool<strong>in</strong>g. The void present is normally found <strong>in</strong> samples<br />
with broader LCO and which are cooled too fast. Contrary to<br />
other authors, 17 a homogeneous BSF <strong>for</strong>ms below the void.<br />
The silicon composition <strong>in</strong> the alum<strong>in</strong>um layer, <strong>for</strong> the<br />
sample with a void, is shown by Fig. 3d. It is described as<br />
an irregular <strong>for</strong>m with a higher concentration at the center of<br />
the open<strong>in</strong>g and two maxima located more than 150 m<br />
away from the center of the open<strong>in</strong>g, to the left and right. An<br />
explanation <strong>for</strong> this phenomenon is given by the follow<strong>in</strong>g<br />
model of the local contact <strong>for</strong>mation between alum<strong>in</strong>um and<br />
silicon.<br />
The <strong>for</strong>mation of the alum<strong>in</strong>um-silicon alloy beg<strong>in</strong>s with<br />
the melt<strong>in</strong>g of alum<strong>in</strong>um. The liquid alum<strong>in</strong>um wets the silicon<br />
surface <strong>in</strong> the local open<strong>in</strong>gs made <strong>in</strong> the dielectric, and<br />
then silicon dissolves <strong>in</strong> the alum<strong>in</strong>um layer. The depth of<br />
penetration of alum<strong>in</strong>um <strong>in</strong> silicon is a function of the temperature<br />
and of the alum<strong>in</strong>um spherical diameter. 21 For a<br />
peak fir<strong>in</strong>g temperature of 950 °C, the depth of penetration<br />
is 20 m, as shown by Figs. 3a and 3c. Due to the higher<br />
solubility of silicon <strong>in</strong> alum<strong>in</strong>um than that of alum<strong>in</strong>um <strong>in</strong><br />
silicon, 16,20 a higher volume of silicon atoms diffuse <strong>in</strong> the<br />
alum<strong>in</strong>um than alum<strong>in</strong>um atoms <strong>in</strong> the silicon. If the peak<br />
fir<strong>in</strong>g temperature is too high, the <strong>diffusion</strong> is enhanced and<br />
silicon spreads deeper <strong>in</strong> the alum<strong>in</strong>um layer. At the <strong>in</strong>terface,<br />
the alum<strong>in</strong>um <strong>in</strong> direct contact with the silicon bulk<br />
saturates first, then the silicon <strong>diffusion</strong> proceeds from the<br />
edges of the <strong>in</strong>terface <strong>in</strong> both lateral directions <strong>in</strong>to the wide<br />
amount of liquid alum<strong>in</strong>um mass, which is not yet saturated<br />
by silicon. After few seconds, a large amount of silicon atoms<br />
is found <strong>in</strong> the alum<strong>in</strong>um layer, more than 370 m<br />
away from the contact area. The strong presence of alum<strong>in</strong>um<br />
atoms converts the immediately adjacent surface at the<br />
penetration, to p-type silicon local BSF. Once the fir<strong>in</strong>g<br />
temperature has reached the maxima, the liquid solution<br />
saturates.<br />
When the contact size is too broad, more silicon surface<br />
<strong>in</strong>teracts with the alum<strong>in</strong>um particles, and the melt located <strong>in</strong><br />
the middle part of the <strong>in</strong>terface LCO will saturate too fast.<br />
Author complimentary copy. Redistribution subject to AIP license or copyright, see http://apl.aip.org/apl/copyright.jsp
153508-3 Urrejola et al. Appl. Phys. Lett. 98, 153508 2011<br />
Furthermore, below too high fir<strong>in</strong>g temperatures fast cool<strong>in</strong>g,<br />
a high elastic stress field may occur <strong>in</strong> the melt dur<strong>in</strong>g<br />
the alloy<strong>in</strong>g. 18 Due to the Kirkendall effect, 19 which expla<strong>in</strong>s<br />
that the rates at which two types of atoms diffuse are not the<br />
same, the high generation of vacancies dur<strong>in</strong>g the siliconalum<strong>in</strong>um<br />
<strong>in</strong>ter<strong>diffusion</strong> may coalesce <strong>in</strong> the melt, caus<strong>in</strong>g<br />
the nucleation and <strong>for</strong>mation of Kirkendall voids 18 <strong>in</strong>stead of<br />
an eutectic layer.<br />
By cool<strong>in</strong>g down the sample, the composition of silicon<br />
<strong>in</strong> the liquid-phase has to decrease follow<strong>in</strong>g the liquid curve<br />
of the b<strong>in</strong>ary system, 22 however, only the edges of the LCO<br />
are still <strong>in</strong> direct contact with the alum<strong>in</strong>um layer due to the<br />
presence of the void. By reach<strong>in</strong>g the eutectic temperature,<br />
no more silicon segregates and the whole rema<strong>in</strong><strong>in</strong>g liquid<br />
solidifies, leav<strong>in</strong>g a high concentration of silicon <strong>in</strong> alum<strong>in</strong>um,<br />
away from the surface of contact shown by the two<br />
maxima of Fig. 3d. If the <strong>in</strong>teraction between alum<strong>in</strong>um<br />
and silicon takes place only with<strong>in</strong> d 2 , where a visible darkgray<br />
region is sharply delimited, the spread of silicon <strong>in</strong> the<br />
alum<strong>in</strong>um layer is <strong>diffusion</strong>-limited. Thereby, an exponential<br />
decrease with the distance from the center of the <strong>in</strong>terface is<br />
evident due to the Fick’s law of <strong>diffusion</strong>. 13<br />
Because the <strong>diffusion</strong> of silicon <strong>in</strong> the liquid alum<strong>in</strong>um<br />
proceeds laterally with<strong>in</strong> the alum<strong>in</strong>um layer, a large amount<br />
of alum<strong>in</strong>um should overlap each side of the dielectric open<strong>in</strong>g<br />
to achieve an optimal metal–semiconductor <strong>in</strong>teraction.<br />
This overlapp<strong>in</strong>g of alum<strong>in</strong>um on narrow dielectric open<strong>in</strong>gs<br />
is evident due to the reduction <strong>in</strong> the contact resistivity and<br />
the homogeneous <strong>for</strong>mation of the local BSF. 10 We suggest<br />
that the maximum spread limit of diffused silicon, d 2 , may<br />
determ<strong>in</strong>e the m<strong>in</strong>imum width of the alum<strong>in</strong>um metallization<br />
needed <strong>for</strong> an optimal contact and full local BSF <strong>for</strong>mation.<br />
Thus, the alum<strong>in</strong>um overlapp<strong>in</strong>g is determ<strong>in</strong>ed by d 2 . In this<br />
way, the f<strong>in</strong>ger spac<strong>in</strong>g may also be determ<strong>in</strong>ed by the spread<br />
limit of silicon <strong>in</strong> the screen-pr<strong>in</strong>ted alum<strong>in</strong>um layer L p<br />
d 2 . Another application of the alum<strong>in</strong>um overlapp<strong>in</strong>g may<br />
be found on <strong>in</strong>terdigitated back-contact n-type silicon solar<br />
cells to obta<strong>in</strong> high-quality screen-pr<strong>in</strong>ted alum<strong>in</strong>um-alloyed<br />
emitters.<br />
In conclusion, we give further understand<strong>in</strong>g of the local<br />
contact <strong>for</strong>mation between an screen-pr<strong>in</strong>ted alum<strong>in</strong>um<br />
paste and narrow silicon contact areas. The spread of<br />
silicon <strong>in</strong> a screen pr<strong>in</strong>ted alum<strong>in</strong>um layer <strong>in</strong>creases by<br />
1.50.06 m/ °C when <strong>in</strong>creas<strong>in</strong>g the peak fir<strong>in</strong>g temperature<br />
<strong>in</strong> a range of 750–950 °C. This lateral spread limit<br />
of silicon, on each side of the dielectric open<strong>in</strong>g, does not<br />
depend on the contact area size but on the fir<strong>in</strong>g temperature,<br />
and is predicted as 75 m, 225 m, and 375 m <strong>for</strong><br />
750 °C, 850 °C, and 950 °C, respectively. Thus, the width<br />
of the alum<strong>in</strong>um contact may be determ<strong>in</strong>ed by the maximum<br />
spread limit of diffused silicon <strong>in</strong> an alum<strong>in</strong>um layer.<br />
We suggest that the contact spac<strong>in</strong>g should be equal or larger<br />
than the maximum spread limit of diffused silicon <strong>in</strong> alum<strong>in</strong>um.<br />
Additionally, the void <strong>for</strong>mation below the alum<strong>in</strong>umsilicon<br />
contacts may be expla<strong>in</strong>ed by the Kirkendall effect.<br />
Our result may be applied to develop high-efficiency screenpr<strong>in</strong>ted<br />
back-contacted and <strong>rear</strong> <strong>passivated</strong> solar cells suitable<br />
<strong>for</strong> <strong>in</strong>dustry.<br />
The authors gratefully acknowledge the f<strong>in</strong>ancial support<br />
by the German Federal M<strong>in</strong>istry of Education and Research<br />
under Contract No. 03SSF0335I, and Merck KGaA <strong>for</strong> the<br />
k<strong>in</strong>d supply of the etch<strong>in</strong>g paste.<br />
1 D. Ni<strong>in</strong>obe, H. Morikawa, S. Hiza, T. Sato, S. Matsuno, H. Fujioka, T.<br />
Katsura, T. Okamoto, S. Hamamoto, T. Ishihara, and S. Arimoto, Sol.<br />
Energy Mater. Sol. Cells 95, 492011.<br />
2 D. Y. Lee, H. H. Lee, J. Y. Ahn, H. J. Park, J. H. Kim, H. J. Kwon, and J.<br />
W. Jeong, Sol. Energy Mater. Sol. Cells 95, 262011.<br />
3 M. Hofmann, S. Janz, C. Schmidt, S. Kambor, D. Suwito, N. Kohn, J.<br />
Rentsch, R. Preu, and S. W. Glunz, Sol. Energy Mater. Sol. Cells 93, 1074<br />
2009.<br />
4 S. M. Yang and J. Pl, Solid-State Electron. 53, 925 2009.<br />
5 H. Plagwitz and R. Brendel, Prog. Photovoltaics 14, 12006.<br />
6 J. Müller, K. Bothe, S. Gatz, F. Haase, C. Mader, and R. Brendel, J. Appl.<br />
Phys. 108, 124513 2010.<br />
7 A. Urueña, J. L. Hernández, J. John, J. Poortmans, and R. Mertens, Proceed<strong>in</strong>gs<br />
of 25th EUPVSEC, Hamburg, Germany, 2010, pp. 2562–2564.<br />
8 F. S. Grasso, L. Gautero, J. Rentsch, R. Preu, and R. Lanzafame, Proceed<strong>in</strong>gs<br />
of 25th EUPVSEC, Hamburg, Germany, 2010, pp. 371–374.<br />
9 J. Krause, R. Woehl, and D. Biro, Proceed<strong>in</strong>gs of 25th EUPVSEC, Hamburg,<br />
Germany, 2010, pp. 1899–1904.<br />
10 E. Urrejola, K. Peter, H. Plagwitz, and G. Schubert, J. Appl. Phys. 107,<br />
124516 2010.<br />
11 W. van Gelder and V. E. Hauser, J. Electrochem. Soc. 114, 8691967.<br />
12 V. A. Popovich, M. Janssen, I. M. Richardson, T. van Amstel, and I. J.<br />
Bennett, Sol. Energy Mater. Sol. Cells 95, 932011.<br />
13 P. G. Shewmon, Diffusion <strong>in</strong> Solids McGraw-Hill, New York, 1963, pp.<br />
9–14.<br />
14 V. D. Kurochk<strong>in</strong>, L. P. Kravchenko, L. N. Kuz’menko, and L. A. Tsurpal,<br />
Powder Metall. Met. Ceram. 44, 1912005.<br />
15 A. Paccagnella, G. Ottaviani, P. Fabri, G. Ferla, and G. Queirolo, Th<strong>in</strong><br />
Solid Films 128, 217 1985.<br />
16 J. O. McCald<strong>in</strong>, Appl. Phys. Lett. 19, 524 1971.<br />
17 T. Lauermann, T. Lüder, S. Scholz, B. Raabe, G. Hahn, and B. Terheiden,<br />
Proceed<strong>in</strong>gs of 35th IEEE PVSC, Hawaii, USA, 2010, p. 000028.<br />
18 A. Paul, Ph.D. thesis, Technische Universiteit E<strong>in</strong>dhoven, 2004.<br />
19 E. O. Kirkendall, Trans. AIME 147, 1041942.<br />
20 S. I. Fujikawa, K. I. Hirano, and Y. Fukushima, Metall. Trans. A 9, 1811<br />
1978.<br />
21 T. Chung, J. Electrochem. Soc. 109, 2291962.<br />
22 J. L. Murray and A. J. McAlister, J. Phase Equilib. 5, 741984.<br />
Author complimentary copy. Redistribution subject to AIP license or copyright, see http://apl.aip.org/apl/copyright.jsp