The Zebra Cell Concept - ISC Konstanz
The Zebra Cell Concept - ISC Konstanz
The Zebra Cell Concept - ISC Konstanz

Create successful ePaper yourself
Turn your PDF publications into a flip-book with our unique Google optimized e-Paper software.
THE ZEBRA CELL CONCEPT - LARGE AREA N-TYPE INTERDIGITATED BACK CONTACT SOLAR<br />
CELLS AND ONE-CELL MODULES FABRICATED USING STANDARD INDUSTRIAL PROCESSING<br />
EQUIPMENT<br />
Andreas Halm 1 , Valentin D. Mihailetchi 1 , Giuseppe Galbiati 1 , Lejo J. Koduvelikulathu 1 , Razvan Roescu 1 , Corrado<br />
Comparotto 1 , Radovan Kopecek 1 , Kristian Peter 1 , Joris Libal 2<br />
1. International Solar Energy Research Center (<strong>ISC</strong>), <strong>Konstanz</strong>, GERMANY<br />
2. Silfab S.p.A., Padova, ITALY<br />
ABSTRACT: In this paper we present relevant characteristics of our <strong>Zebra</strong> cells and one-cell modules. <strong>The</strong> <strong>Zebra</strong> cell<br />
is an interdigitated back contact (IBC) solar cell produced at <strong>ISC</strong> <strong>Konstanz</strong> using only industrially proven<br />
technologies and standard industrial size 156x156mm² n-type Cz wafers. Wafers of different suppliers have been<br />
evaluated. <strong>The</strong> best efficiencies achieved so far on a batch of 21 wafers are 21% average (champion cell: 21.3%).<br />
Reverse bias electroluminescence (ReBEL) measurements reveal the unique breakdown behavior of the <strong>Zebra</strong> cell.<br />
Due to its alternating p + n + regions on the rear, a homogenous breakdown along the parallel junctions is observed<br />
which does not lead to local shunting. <strong>The</strong> <strong>Zebra</strong> cell can be stringed using standard soldering or bonding with<br />
conductive adhesives. <strong>Cell</strong> to module losses are comparable to standard p-type Al BSF cells. Due to its open rear side<br />
structure, the <strong>Zebra</strong> cell is bifacial. When testing one-cell modules with transparent and black backsheet outdoors our<br />
measurements show an average rise in power output of 13% relative for the bifacial module compared to its<br />
monofacial reference.<br />
Keywords: IBC solar cell, n-type, bifacial, industrial process, <strong>Zebra</strong> cell<br />
1 INTRODUCTION<br />
<strong>The</strong> first silicon solar cell was produced in 1954 with<br />
IBC architecture. It was realized on an n-type substrate<br />
and had an efficiency of 6.35 % [1]. <strong>The</strong> introduction of<br />
this concept to industrial mass production followed<br />
roughly 30 years later by Sunpower Corp.. <strong>The</strong>y fabricate<br />
on 125×125 mm² high quality n-type monocrystalline<br />
wafers using special equipment and processes stemming<br />
from microelectronics [2].<br />
Our bottom up approach to the IBC cell concept is<br />
uniquely different. We use industrial processing<br />
machines which are state of the art in standard cell<br />
production. Our processing sequence can be implemented<br />
in a standard p-type production line by simply adding<br />
further equipment to perform five more processing steps<br />
as compared to a standard Al BSF cell [3, 4]. <strong>The</strong> only<br />
specialized equipment required for our process is a BBR 3<br />
diffusion furnace which is already used for advanced<br />
solar cell production. Following this road we reached<br />
21.3 % cell efficiency on the full area of a 156x156 mm²<br />
n-type Cz substrate. This is – to our knowledge – a world<br />
record and also the only type of IBC solar cell fabricated<br />
on such a large substrate. Additionally, the <strong>Zebra</strong> cell can<br />
be operated in bifacial mode which enhances its effective<br />
conversion efficiency even further.<br />
In the following we present latest efficiency results on<br />
wafers of different suppliers and base resistivity. <strong>The</strong><br />
reverse characteristic of the <strong>Zebra</strong> cell is discussed since<br />
it is an important factor in module assembly. Being aware<br />
that not only the cell but also the module performance is<br />
relevant in application, we address important points in<br />
respect to module assembly. We show cell to module<br />
losses for different interconnection schemes and results<br />
of the bifacial versus monofacial outdoor performance of<br />
our one-cell <strong>Zebra</strong> modules.<br />
2 EXPERIMENTAL<br />
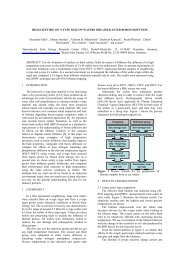
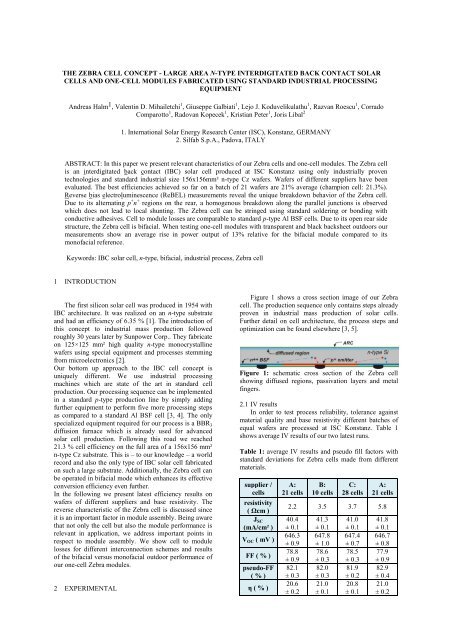
Figure 1 shows a cross section image of our <strong>Zebra</strong><br />
cell. <strong>The</strong> production sequence only contains steps already<br />
proven in industrial mass production of solar cells.<br />
Further detail on cell architecture, the process steps and<br />
optimization can be found elsewhere [3, 5].<br />
Figure 1: schematic cross section of the <strong>Zebra</strong> cell<br />
showing diffused regions, passivation layers and metal<br />
fingers.<br />
2.1 IV results<br />
In order to test process reliability, tolerance against<br />
material quality and base resistivity different batches of<br />
equal wafers are processed at <strong>ISC</strong> <strong>Konstanz</strong>. Table 1<br />
shows average IV results of our two latest runs.<br />
Table 1: average IV results and pseudo fill factors with<br />
standard deviations for <strong>Zebra</strong> cells made from different<br />
materials.<br />
supplier /<br />
cells<br />
resistivity<br />
( Ωcm )<br />
J SC<br />
(mA/cm² )<br />
V OC ( mV )<br />
FF ( % )<br />
pseudo-FF<br />
( % )<br />
η ( % )<br />
A:<br />
21 cells<br />
B:<br />
10 cells<br />
C:<br />
28 cells<br />
A:<br />
21 cells<br />
2.2 3.5 3.7 5.8<br />
40.4<br />
± 0.1<br />
646.3<br />
± 0.9<br />
78.8<br />
± 0.9<br />
82.1<br />
± 0.3<br />
20.6<br />
± 0.2<br />
41.3<br />
± 0.1<br />
647.8<br />
± 1.0<br />
78.6<br />
± 0.3<br />
82.0<br />
± 0.3<br />
21.0<br />
± 0.1<br />
41.0<br />
± 0.1<br />
647.4<br />
± 0.7<br />
78.5<br />
± 0.3<br />
81.9<br />
± 0.2<br />
20.8<br />
± 0.1<br />
41.8<br />
± 0.1<br />
646.7<br />
± 0.8<br />
77.9<br />
± 0.9<br />
82.9<br />
± 0.4<br />
21.0<br />
± 0.2
Average cell results range between 21.0% and 20.6% for<br />
the different materials. Wafers of material A and B with<br />
5.8 Ωcm and 3.5 Ωcm base resistivity reach the highest<br />
average efficiency with 21% and a record cell with<br />
21.3% efficiency which is not yet independently<br />
confirmed. Table 2 shows the IV parameters of our<br />
champion cell.<br />
Table 2: IV parameters champion cell.<br />
J SC<br />
(mA/cm 2 )<br />
V OC<br />
( mV )<br />
FF<br />
( % )<br />
<strong>The</strong> lowest performing batch from supplier A still shows<br />
20.6% average efficiency. This leads to the conclusion<br />
that the material, not the process was the limiting factor.<br />
It is notable that for all batches the standard deviation of<br />
efficiency is very low. This proves the stability of our<br />
process. SunsV OC measurements reveal high pseudo fill<br />
factors (PFF) proving that our device does not suffer<br />
from shunting. V OC values are nearly identical for all<br />
batches independent of the material. <strong>The</strong> limiting factor is<br />
the metal contact with the p + emitter. During the sintering<br />
process, metal stemming from the screen printed paste<br />
penetrates into the emitter region and thus limiting V OC<br />
[6]. <strong>The</strong> dependence of fill factor and J SC on the base<br />
resistivity can be observed clearly comparing the two<br />
batches of supplier A. <strong>The</strong> 2.2 Ωcm batch features the<br />
highest fill factors but also the lowest J SC while the 5.8<br />
Ωcm batch behaves vice versa. This behavior can be<br />
easily explained regarding the lateral carrier transport<br />
over long distances in IBC solar cells which was already<br />
discussed earlier [5].<br />
2.2 Reverse characteristics<br />
Due to its alternating p + n + regions on the rear, the<br />
reverse behavior of the <strong>Zebra</strong> cell differs from a standard<br />
cell with a pn + junction. In the following, reverse dark IV<br />
measurements and ReBEL give more insights.<br />
2.2.1 Reverse dark IV measurement<br />
pseudo FF<br />
( % )<br />
η ( % )<br />
41.9 647.9 78.5 82.8 21.3<br />
Figure 2: reverse dark IV characteristics of a <strong>Zebra</strong> cell.<br />
Figure 2 shows the reverse dark IV curve of a <strong>Zebra</strong> cell.<br />
<strong>The</strong> onset of the breakdown begins early, already at -5.2<br />
V the reverse current exceeds 3 A. Common restrictions<br />
of module producers are that the reverse current at -12 V<br />
should be lower than 3 A. Our cell would not pass this<br />
restriction but due to the special architecture of the <strong>Zebra</strong><br />
cell its validation is not needed. In the case of a<br />
breakdown, the vertically parallel p + n + regions on the rear<br />
side of the <strong>Zebra</strong> cell behave differently. <strong>The</strong> contact of<br />
the two highly doped regions enables the carriers to<br />
tunnel directly from band to band [7] leading to<br />
homogenous heating of the cell in contrary to local<br />
hotspot formation and irreversible shunting occurring in<br />
standard cells. ReBEL images (Figure 3) of the same cell<br />
prove the homogenous breakdown.<br />
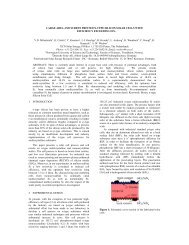
2.2.2 ReBEL images<br />
Figure 3: big picture: reverse EL image of a <strong>Zebra</strong> cell<br />
biased with -6.6 V and -9.9A current flowing, the parallel<br />
line structure shows the breakdown along the junctions;<br />
small picture: magnification of the green bordered region;<br />
overlay of the ReBEL image (red) and a camera image<br />
(cyan) depicting the metal fingers on the rear of the cell.<br />
ReBEL pictures are recorded with our EL/Pl system<br />
developed in house. <strong>The</strong> big picture in figure 3 shows a<br />
<strong>Zebra</strong> cell operated in reverse (bias: -6.6V current flow:<br />
9.9 A). <strong>The</strong> ReBEL signal is structured mostly in parallel<br />
lines along the p + n + junctions. <strong>The</strong> small picture in the top<br />
left corner of figure 3 shows a magnification of the signal<br />
in the green bordered area. Here, the ReBEL signal is<br />
depicted in red, a photo of the same region of the cell is<br />
overlaid in cyan showing the metallization pattern. It can<br />
be observed that the ReBEL signal shows a homogenous<br />
breakdown along the individual junctions located parallel<br />
to the finger grid. <strong>The</strong> different spacing between<br />
breakdown sites and the metallization fingers rises from<br />
the cell geometry. <strong>The</strong> base (n + ) contact fingers are<br />
located nearer to the breakdown sites since the base width<br />
is smaller than the emitter width. It is clearly visible<br />
though that none of the metal fingers are the source of a<br />
breakdown site. This unique characteristic could abolish<br />
the need of mounting bypass diodes in a <strong>Zebra</strong> module<br />
since the individual cell´s reverse behavior leaves it<br />
unharmed when operating with high reverse currents in<br />
the region of the modules I MPP .
Table 3: IV results before and after 9 hours of<br />
continuous reverse current flowing (-9.9A, -6V).<br />
cell<br />
cell 1,<br />
t = 0 h<br />
cell 1,<br />
t = 9 h<br />
cell 2,<br />
t = 0 h<br />
cell 2,<br />
t = 9 h<br />
J SC<br />
(mA/cm 2 )<br />
V OC<br />
(mV)<br />
FF (%) η ( % )<br />
40,4 641 78,6 20,3<br />
40,3 639 78,6 20,2<br />
40,2 642 79,0 20,4<br />
40,1 638 78,1 20,0<br />
Table 3 shows IV measurements of two <strong>Zebra</strong> cells under<br />
1 sun illumination taken before and after 9 hours of<br />
continuous reverse current flow of 9.9A. During this time<br />
the cells heated up to a maximum of 100 °C. <strong>Cell</strong> 1 does<br />
not deteriorate at all for the whole period of time; its FF<br />
stays constant while J SC and V OC change in the range of<br />
the measurement error. <strong>Cell</strong> 2 shows a 0.9 % absolute<br />
reduction of the fill factor. EL control pictures taken for<br />
this cell before and after the 9 hours reverse bias period<br />
though are identical.<br />
2.3 <strong>Cell</strong> to module loss<br />
Interconnection of the <strong>Zebra</strong> cells and assembling<br />
them into modules is important to address since the rear<br />
contacted cell structure poses new challenges. <strong>The</strong><br />
current rear side of the <strong>Zebra</strong> cell contains eight busbars;<br />
four for each polarity. We evaluated different<br />
interconnection schemes. In the following, cell to module<br />
losses for soldering and bonding of conductive adhesives<br />
are regarded in respect to the resulting module<br />
performance. One-cell modules are assembled using the<br />
standard module sandwich structure; the layer stack is<br />
glass – EVA – cell – EVA – backsheet. IV measurements<br />
before and after module assembly are evaluated in<br />
respect to fill factor loss. <strong>The</strong> fill factor is the most<br />
critical loss when evaluating different interconnection<br />
schemes since it is stemming from the contact of the tabs<br />
with the busbars.<br />
Table 4: relative FF loss for different interconnection<br />
schemes.<br />
interconnection type Δ FF (%)<br />
bonding A 4.12<br />
bonding B 2.58<br />
bonding C 4.72<br />
soldering 5.38<br />
reference: soldered Al BSF cell 3.32<br />
Table 4 shows the relative fill factor loss for <strong>Zebra</strong> cells<br />
using different conductive adhesive bonding and<br />
soldering of the interconnection tabs. Since the contacts<br />
for measuring our one-cell modules are far away from the<br />
cell itself, module fill factors are measured lower than on<br />
cell level due to the series resistance of the connectors.<br />
That is why table 4 includes the data of a soldered Al<br />
BSF reference. <strong>The</strong> data shows that bonding with<br />
conductive adhesive B results in the lowest fill factor<br />
loss; even lower than the one for the soldered reference.<br />
Soldering of <strong>Zebra</strong> cells still leaves room for minimizing<br />
losses but was not yet investigated in detail. <strong>The</strong> data<br />
reveals though that the <strong>Zebra</strong> cell is fit for module<br />
assembly using new conductive adhesive gluing but also<br />
classical soldering of the interconnection tabs.<br />
2.4 Outdoor measurements of one-cell modules<br />
After EVA encapsulation with glass on the front and<br />
transparent or black backsheet at the rear, modules were<br />
assembled on the rooftop of <strong>ISC</strong> <strong>Konstanz</strong> to test their<br />
outdoor performance. One module was mounted face<br />
down recording the current generated by the albedo light.<br />
A pyranometer located next to the modules with an<br />
inclination of 30°, heading south – same as the modules -<br />
is recording light intensity. <strong>The</strong> floor underneath the<br />
module array is covered with white backsheet (R 70 %)<br />
to simulate a white painted rooftop. An IV curve of each<br />
module is recorded during 10 s in a 5 minute interval.<br />
Measurements are performed for 21 full days in may<br />
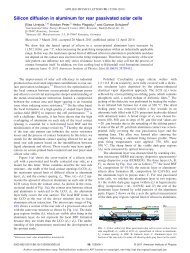
2012. Figure 4 shows a comparison of the normalized<br />
power output of a monofacial versus a bifacial one-cell<br />
module for an overcast day. Normalization is done using<br />
the P MPP measured indoors under 1 sun illumination and<br />
standard conditions. For the bifacial module, front and<br />
back side are characterized separately; in both cases<br />
measured on a black background. <strong>The</strong> power ratio<br />
(P FRONT /P BACK ) of front- and backside for the bifacial<br />
module is 0.75.<br />
Figure 4: comparison of the normalized power output of<br />
a monofacial versus a bifacial one-cell <strong>Zebra</strong> module for<br />
an overcast day; blue: P MPP /P MPP@1sun for the bifacial<br />
module; black: P MPP /P MPP@1sun for the monofacial<br />
module; green: outdoor light intensity measured by<br />
pyranometer; orange: albedo contribution quantified by<br />
I SC /I SC@1sun of the face-down mounted module.<br />
Figure 4 shows the normalized power output over time of<br />
both modules for an overcast day. Integrating the power<br />
output versus the light intensity measured by the<br />
pyranometer, the energy harvest is retrieved. For the<br />
overcast day, the bifacial module shows 17.6 % more<br />
power output than the monofacial one with the black<br />
backsheet.
optimized technique in the fabrication process”, Energy Procedia<br />
8, 2011, p. 421<br />
[6]: L. J. Koduvelikulathu, V. M. Mihailetchi, A. Edler, C.<br />
Comparotto, A. Halm, R. Kopecek, K. Peter, “Metallization and<br />
firing process impact on the V OC – a simulation study”,<br />
proceedings of this conference<br />
[7]: K. Mangersnes “Back-contacted back-junction silicon solar<br />
cells”, PhD. thesis, University of Oslo, October 2010<br />
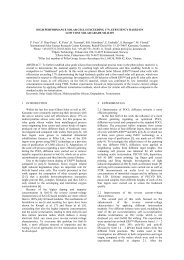
Figure 5: comparison of the normalized power output of<br />
a monofacial versus a bifacial one-cell <strong>Zebra</strong> module for<br />
a clear day; blue: P MPP /P MPP@1sun for the bifacial module;<br />
black: P MPP /P MPP@1sun for the monofacial module; green:<br />
outdoor light intensity measured by pyranometer; orange:<br />
albedo contribution quantified by I SC /I SC@1sun of the facedown<br />
mounted module.<br />
Figure 5 shows the same measurement done on a clear<br />
day. Here, bifacial module is generating 12.2 % more<br />
power. Over the whole period 21 days the power gain for<br />
the bifacial module with transparent backsheet comparing<br />
to the monofacial module with black backsheet is 13 %.<br />
This is a significant increase of the energy harvest<br />
favoring bifacial operation of the <strong>Zebra</strong> cell. Indoor<br />
measurements of one-cell <strong>Zebra</strong> modules using a bifacial<br />
measurement setup as shown in [3, 4] yield in similar<br />
results.<br />
3. SUMMARY<br />
We fabricated highly efficient IBC solar cells, named<br />
“<strong>Zebra</strong>” cells, on 156 x 156 mm² n-type Cz wafers using<br />
only industrial relevant processing equipment. We prove<br />
stable efficiencies on batches of maximum 28 wafers<br />
testing substrates of different suppliers and base<br />
resistivity. So far, we reached 21.3 % maximum<br />
efficiency with our cell concept. We showed that the<br />
<strong>Zebra</strong> cell is ready for module assembly and presented<br />
first results of the outdoor performance of bifacial versus<br />
monofacial one-cell modules.<br />
4. REFERENCES<br />
[1]: D. M. Chapin, C. S. Fuller and G. L. Pearson “A New<br />
Silicon p-n Junction Photocell for Converting Solar Radiation<br />
into Electrical Power”, JAP Vol. 25 (1954) p. 676-677<br />
[2]: D. De Ceuster et al., Proceedings of 22 nd EU-PVSEC, Milan<br />
(2007), p. 816<br />
[3]: V.D. Mihailetchi et al. “high efficiency ibc solar cells<br />
fabricated on large area n-type silicon using industrial available<br />
techniques”, technical digest, 21 International Photovoltaic<br />
Science and Engeneering Conference 28.11.2011-2.12.2011,<br />
Fukuoka, Japan<br />
[4]:G. Galbiati, V. D. Mihailetchi, A. Halm, L. J.<br />
Koduvelikulathu, Razvan Roescu, R. Kopecek, K. Peter, J Libal<br />
“Large Area Back-Contact Back-Junction Solar <strong>Cell</strong>s with<br />
Efficiency Exceeding 21%”, 38th IEEE Photovoltaic Specialist<br />
Conference 2012, Austin, USA<br />
[5]: G. Galbiati, V.D. Mihailetchi, A. Halm, R. Roescu, R.<br />
Kopecek, “Results on n-type IBC solar cells using industrial