High Performance Solar Cells Exceeding 17 ... - ISC Konstanz
High Performance Solar Cells Exceeding 17 ... - ISC Konstanz
High Performance Solar Cells Exceeding 17 ... - ISC Konstanz

Create successful ePaper yourself
Turn your PDF publications into a flip-book with our unique Google optimized e-Paper software.
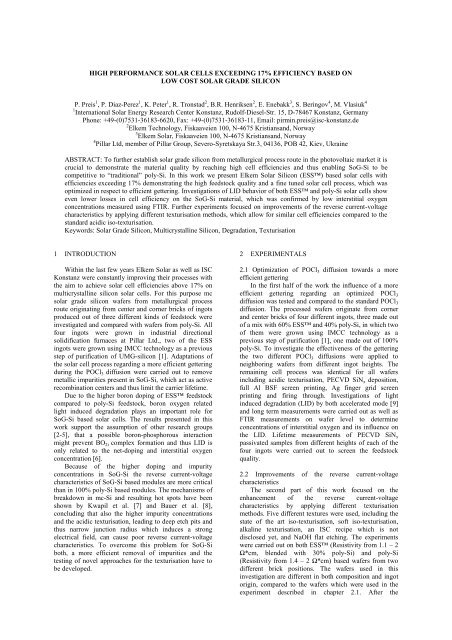
HIGH PERFORMANCE SOLAR CELLS EXCEEDING <strong>17</strong>% EFFICIENCY BASED ON<br />
LOW COST SOLAR GRADE SILICON<br />
P. Preis 1 , P. Diaz-Perez 1 , K. Peter 1 , R. Tronstad 2 , B.R. Henriksen 2 , E. Enebakk 3 , S. Beringov 4 , M. Vlasiuk 4<br />
1 International <strong>Solar</strong> Energy Research Center <strong>Konstanz</strong>, Rudolf-Diesel-Str. 15, D-78467 <strong>Konstanz</strong>, Germany<br />
Phone: +49-(0)7531-36183-6620, Fax: +49-(0)7531-36183-11, Email: pirmin.preis@isc-konstanz.de<br />
2 Elkem Technology, Fiskaaveien 100, N-4675 Kristiansand, Norway<br />
3 Elkem <strong>Solar</strong>, Fiskaaveien 100, N-4675 Kristiansand, Norway<br />
4 Pillar Ltd, member of Pillar Group, Severo-Syretskaya Str.3, 04136, POB 42, Kiev, Ukraine<br />
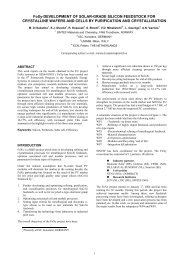
ABSTRACT: To further establish solar grade silicon from metallurgical process route in the photovoltaic market it is<br />
crucial to demonstrate the material quality by reaching high cell efficiencies and thus enabling SoG-Si to be<br />
competitive to “traditional” poly-Si. In this work we present Elkem <strong>Solar</strong> Silicon (ESS) based solar cells with<br />
efficiencies exceeding <strong>17</strong>% demonstrating the high feedstock quality and a fine tuned solar cell process, which was<br />
optimized in respect to efficient gettering. Investigations of LID behavior of both ESS and poly-Si solar cells show<br />
even lower losses in cell efficiency on the SoG-Si material, which was confirmed by low interstitial oxygen<br />
concentrations measured using FTIR. Further experiments focused on improvements of the reverse current-voltage<br />
characteristics by applying different texturisation methods, which allow for similar cell efficiencies compared to the<br />
standard acidic iso-texturisation.<br />
Keywords: <strong>Solar</strong> Grade Silicon, Multicrystalline Silicon, Degradation, Texturisation<br />
1 INTRODUCTION<br />
Within the last few years Elkem <strong>Solar</strong> as well as <strong>ISC</strong><br />
<strong>Konstanz</strong> were constantly improving their processes with<br />
the aim to achieve solar cell efficiencies above <strong>17</strong>% on<br />
multicrystalline silicon solar cells. For this purpose mc<br />
solar grade silicon wafers from metallurgical process<br />
route originating from center and corner bricks of ingots<br />
produced out of three different kinds of feedstock were<br />
investigated and compared with wafers from poly-Si. All<br />
four ingots were grown in industrial directional<br />
solidification furnaces at Pillar Ltd., two of the ESS<br />
ingots were grown using IMCC technology as a previous<br />
step of purification of UMG-silicon [1]. Adaptations of<br />
the solar cell process regarding a more efficient gettering<br />
during the POCl 3 diffusion were carried out to remove<br />
metallic impurities present in SoG-Si, which act as active<br />
recombination centers and thus limit the carrier lifetime.<br />
Due to the higher boron doping of ESS feedstock<br />
compared to poly-Si feedstock, boron oxygen related<br />
light induced degradation plays an important role for<br />
SoG-Si based solar cells. The results presented in this<br />
work support the assumption of other research groups<br />
[2-5], that a possible boron-phosphorous interaction<br />
might prevent BO 2i complex formation and thus LID is<br />
only related to the net-doping and interstitial oxygen<br />
concentration [6].<br />
Because of the higher doping and impurity<br />
concentrations in SoG-Si the reverse current-voltage<br />
characteristics of SoG-Si based modules are more critical<br />
than in 100% poly-Si based modules. The mechanisms of<br />
breakdown in mc-Si and resulting hot spots have been<br />
shown by Kwapil et al. [7] and Bauer et al. [8],<br />
concluding that also the higher impurity concentrations<br />
and the acidic texturisation, leading to deep etch pits and<br />
thus narrow junction radius which induces a strong<br />
electrical field, can cause poor reverse current-voltage<br />
characteristics. To overcome this problem for SoG-Si<br />
both, a more efficient removal of impurities and the<br />
testing of novel approaches for the texturisation have to<br />
be developed.<br />
2 EXPERIMENTALS<br />
2.1 Optimization of POCl 3 diffusion towards a more<br />
efficient gettering<br />
In the first half of the work the influence of a more<br />
efficient gettering regarding an optimized POCl 3<br />
diffusion was tested and compared to the standard POCl 3<br />
diffusion. The processed wafers originate from corner<br />
and center bricks of four different ingots, three made out<br />
of a mix with 60% ESS and 40% poly-Si, in which two<br />
of them were grown using IMCC technology as a<br />
previous step of purification [1], one made out of 100%<br />
poly-Si. To investigate the effectiveness of the gettering<br />
the two different POCl 3 diffusions were applied to<br />
neighboring wafers from different ingot heights. The<br />
remaining cell process was identical for all wafers<br />
including acidic texturisation, PECVD SiN x deposition,<br />
full Al BSF screen printing, Ag finger grid screen<br />
printing and firing through. Investigations of light<br />
induced degradation (LID) by both accelerated mode [9]<br />
and long term measurements were carried out as well as<br />
FTIR measurements on wafer level to determine<br />
concentrations of interstitial oxygen and its influence on<br />
the LID. Lifetime measurements of PECVD SiN x<br />
passivated samples from different heights of each of the<br />
four ingots were carried out to screen the feedstock<br />
quality.<br />
2.2 Improvements of the reverse current-voltage<br />
characteristics<br />
The second part of this work focused on the<br />
enhancement of the reverse current-voltage<br />
characteristics by applying different texturisation<br />
methods. Five different textures were used, including the<br />
state of the art iso-texturisation, soft iso-texturisation,<br />
alkaline texturisation, an <strong>ISC</strong> recipe which is not<br />
disclosed yet, and NaOH flat etching. The experiments<br />
were carried out on both ESS (Resistivity from 1.1 – 2<br />
Ω*cm, blended with 30% poly-Si) and poly-Si<br />
(Resistivity from 1.4 – 2 Ω*cm) based wafers from two<br />
different brick positions. The wafers used in this<br />
investigation are different in both composition and ingot<br />
origin, compared to the wafers which were used in the<br />
experiment described in chapter 2.1. After the
Average solar cell efficiency [%]<br />
Lifetime [s]<br />
texturisation all samples were processed by POCl 3<br />
diffusion, PECVD SiN x deposition, full Al BSF screen<br />
printing, Ag finger grid screen printing and firing<br />
through. Measurements of the solar cell parameters were<br />
carried out and the reverse current was determined at<br />
-14.5V to see the influence of the texturisation on both<br />
results.<br />
3 RESULTS<br />
3.1 Results of diffusion optimization<br />
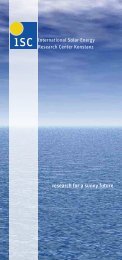
Minority carrier lifetime measurements were<br />
performed to screen the feedstock quality of the<br />
investigated ingots. Therefore the saw damage of wafers<br />
from the center bricks of each ingot was removed and the<br />
samples were passivated by a PECVD SiN x . The<br />
lifetimes of those samples were determined using QSSPC<br />
measurements and are shown in figure 1.<br />
60<br />
50<br />
40<br />
30<br />
20<br />
10<br />
0<br />
ESS 1<br />
ESS 2<br />
ESS 3<br />
Poly<br />
0 10 20 30 40 50 60 70 80 90 100<br />
Ingot Height [%]<br />
Figure 1: Minority carrier lifetime of wafers from<br />
different ingot positions, measured by QSSPC. Ingots<br />
ESS 1 and 2 were purified by IMCC and thus are not<br />
made from the standard ESS feedstock.<br />
Lifetimes between 10µs and 60µs have been measured on<br />
both ESS and poly-Si wafers. Figure 1 shows that the<br />
minority carrier lifetime of the ESS based wafers is at<br />
least on the same level or even higher compared to the<br />
poly-Si reference wafers. The bottom wafers of both<br />
ingots ESS 3 and poly show reduced lifetimes most<br />
likely due to some crucible induced impurities. For the<br />
highest wafer positions the lifetime of all four ingots is<br />
decreasing. In case of the poly-Si ingot it is likely that the<br />
higher boron doping at the top, because of the<br />
segregation of impurities is a reason for the decrease in<br />
lifetime. For the ESS based samples dislocations,<br />
found at the higher ingot positions, might limit the carrier<br />
lifetime, because they act as active recombination<br />
centers.<br />
and are thus not made from standard ESS feedstock<br />
Ingot Brick<br />
V oc<br />
[mv]<br />
J sc<br />
[mA/cm²]<br />
FF<br />
[%]<br />
η<br />
[%]<br />
ESS 1 Corner 621.9 33.7 79.5 16.7<br />
ESS 1 Center 618.4 33.5 79.7 16.5<br />
ESS 2 Corner 619.1 33.9 79.3 16.6<br />
ESS 2 Center 616.8 33.8 79.1 16.5<br />
ESS 3 Corner 613.6 33.5 79.1 16.3<br />
ESS 3 Center 618.7 33.9 79.3 16.6<br />
poly Corner 615.1 33.7 79.0 16.4<br />
poly Center 6<strong>17</strong>.1 33.9 79.2 16.6<br />
Table II: Average solar cell parameters over at least 18<br />
cells per brick, which were evenly distributed over the<br />
complete ingot height, processed using an optimized<br />
diffusion regarding more efficient gettering. Ingots ESS 1<br />
and ESS 2 have been grown using IMCC technology as a<br />
previous step of purification and are thus not made from<br />
standard ESS feedstock.<br />
Ingot Brick<br />
V oc<br />
[mv]<br />
J sc<br />
[mA/cm²]<br />
FF<br />
[%]<br />
η<br />
[%]<br />
ESS 1 Corner 623.8 33.8 79.5 16.7<br />
ESS 1 Center 620.2 33.6 79.6 16.6<br />
ESS 2 Corner 620.5 33.9 79.2 16.7<br />
ESS 2 Center 618.4 33.9 79.0 16.6<br />
ESS 3 Corner 614.5 33.5 78.9 16.3<br />
ESS 3 Center 619.8 34.0 79.2 16.7<br />
poly Corner 616.2 33.8 78.9 16.4<br />
poly Center 618.5 34.0 79.2 16.6<br />
The ingots ESS 1 and ESS 2, which were purified using<br />
IMCC technology, show the highest achieved solar cell<br />
efficiencies, due to high FF, because of the low resistivity<br />
and thus a low series resistance, high V oc caused by the<br />
Fermi level shift as a result of the higher boron<br />
concentration and respective higher doping levels [6],<br />
and J sc similar to the reference wafers. Ingot ESS 3<br />
also shows a good performance at the centre brick,<br />
whereas the corner brick shows the lowest average<br />
efficiency of all investigated bricks.<br />
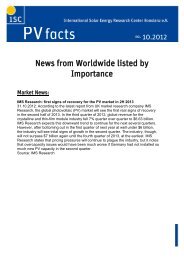
<strong>17</strong>,0<br />
16,8<br />
16,6<br />
16,4<br />
16,2<br />
Optimized<br />
Standard<br />
IV measurements show average efficiencies, over at<br />
least 18 solar cells from each brick, between 16.3% and<br />
16.7% for the ESS based solar cells and between<br />
16.4% and 16.6% for the poly-Si based solar cell<br />
reference (see table I and II).<br />
Table I: Average solar cell parameters over at least 18<br />
cells per brick, which were evenly distributed over the<br />
complete ingot height, processed using the standard<br />
diffusion. Ingots ESS 1 and ESS 2 have been grown<br />
using IMCC technology as a previous step of purification<br />
16,0<br />
ESS 1 Center<br />
ESS 1 Corner<br />
ESS 2 Center<br />
ESS 2 Corner<br />
ESS 3 Center<br />
ESS 3 Corner<br />
Poly Center<br />
Poly Corner<br />
Figure 2: Comparison of average solar cell efficiency of<br />
solar cells diffused by either an optimized or a standard<br />
POCl 3 diffusion. The optimized diffusion was improved<br />
towards a more efficient gettering.<br />
As it can be seen in table I and II and figure 2, the<br />
optimized diffusion leads to an absolute gain of 0.1% in
Interstitial oxygen [ppma]<br />
Reverse current @ -12V [A]<br />
Relative loss in cell efficiency [%]<br />
Relative loss in cell efficiency [%]<br />
cell efficiency for most of the groups, due to enhanced<br />
V oc and J sc values, which we claim to be an effect of a<br />
more efficient gettering. The optimization of the<br />
diffusion leads to solar cell efficiencies exceeding <strong>17</strong>%,<br />
with best solar cells even reaching <strong>17</strong>.1% efficiency. The<br />
results of the best cells of each ingot and brick are shown<br />
in table III.<br />
Table III: <strong>Solar</strong> cell parameter of the best solar cells of<br />
each group. All of the best solar cells were processed<br />
using the optimized diffusion.<br />
Ingot Brick<br />
V oc<br />
[mv]<br />
J sc<br />
[mA/cm²]<br />
FF<br />
[%]<br />
η<br />
[%]<br />
ESS 1 Corner 625.2 33.9 79.5 16.8<br />
ESS 1 Center 628.5 34.1 79.7 <strong>17</strong>.1<br />
ESS 2 Corner 625.0 34.2 79.3 16.9<br />
ESS 2 Center 628.1 34.3 79.4 <strong>17</strong>.1<br />
ESS 3 Corner 615.8 33.8 79.2 16.5<br />
ESS 3 Center 622.1 34.1 79.2 16.8<br />
poly Corner 618.7 34.1 79.3 16.7<br />
poly Center 619.4 34.1 79.4 16.8<br />
Another indication for a more efficient gettering resulting<br />
in lower impurity concentrations on cell level is the<br />
improved reverse current-voltage characteristics. The<br />
reverse breakdown is often caused by metallic impurities<br />
[7]. As shown in figure 3 the solar cells with the<br />
optimized diffusion show an improved reverse current<br />
2<br />
Optimized<br />
Standard<br />
for the SoG-Si based solar cells for most ingot positions,<br />
even though the boron concentrations are higher<br />
compared to the poly-Si. The ingots ESS 1 and ESS 2<br />
show LID mostly below 1%, whereas ingot ESS 3 and<br />
the poly reference show LID up to 1.7% at the bottom<br />
wafers.<br />
1,8<br />
1,6<br />
1,4<br />
1,2<br />
1,0<br />
0,8<br />
0,6<br />
0,4<br />
0,2<br />
0,0<br />
0 10 20 30 40 50 60 70 80 90 100<br />
Figure 4: Relative losses in solar cell efficiencies of solar<br />
cells from the center bricks, depending on the ingot<br />
height.<br />
1,8<br />
1,6<br />
1,4<br />
1,2<br />
1,0<br />
Ingot Height [%]<br />
ESS 1<br />
ESS 2<br />
ESS 3<br />
Poly<br />
ESS 1<br />
ESS 2<br />
ESS 3<br />
Poly<br />
0,8<br />
0,6<br />
1<br />
0<br />
ESS 1 Center<br />
ESS 1 Corner<br />
ESS 2 Center<br />
ESS 2 Corner<br />
ESS 3 Center<br />
ESS 3 Corner<br />
Poly Center<br />
Poly Corner<br />
Figure 3: Comparison of reverse current, as an indicator<br />
of more efficient gettering, of solar cells diffused by<br />
efficient POCl 3 gettering compared to the standard POCl 3<br />
diffusion.<br />
0,4<br />
0,2<br />
0,0<br />
0 10 20 30 40 50 60 70 80 90 100<br />
Ingot Height [%]<br />
Figure 5: Relative losses in solar cell efficiencies of solar<br />
cells from the corner bricks, depending on the ingot<br />
height.<br />
All of the ingots show a decreasing tendency of LID<br />
towards higher ingot positions, what is in good agreement<br />
with FTIR measurements of interstitial oxygen, which<br />
can be seen in figure 6.<br />
LID behavior of solar cells, originating from different<br />
ingot heights ranging from bottom to top from both<br />
center and corner bricks, was investigated. Therefore the<br />
solar cells were exposed to 1 sun illumination at elevated<br />
temperature using a Semilab PV2000 tool, to reach a<br />
completely degraded state due to the formation of BO 2i<br />
complexes. The exact measurement procedure is<br />
explained in [9]. The solar cell parameters were measured<br />
before and after this procedure and the relative loss in<br />
cell efficiency was calculated out of both measurement<br />
results. The results of the relative loss in cell efficiency<br />
for solar cells from the center bricks are shown in figure<br />
4, the results for the solar cells from the corner bricks in<br />
figure 5. The measurement results show lower LID losses<br />
7,00E+0<strong>17</strong><br />
6,00E+0<strong>17</strong><br />
5,00E+0<strong>17</strong><br />
4,00E+0<strong>17</strong><br />
3,00E+0<strong>17</strong><br />
2,00E+0<strong>17</strong><br />
1,00E+0<strong>17</strong><br />
0 10 20 30 40 50 60 70 80 90 100<br />
Ingot Height [%]<br />
ESS 1<br />
ESS 2<br />
ESS 3<br />
Poly
Reverse current @-14.5V [A]<br />
Figure 6: Concentrations of interstitial oxygen of wafers<br />
from different ingot heights, measured using FTIR.<br />
In consideration that bulk resistivity is lower (see table<br />
IV) and respectively the doping level is higher for ESS<br />
based solar cells, these results lead to the conclusion that<br />
LID is rather relating to the net doping and the interstitial<br />
oxygen concentration than to the absolute boron<br />
concentration. This supports the assumption that<br />
phosphorous in compensated silicon somehow prevents<br />
the formation of BO 2i , what was stated by different<br />
research groups before [2-5].<br />
Table IV: Bulk resistivity of investigated wafers<br />
Ingot<br />
Resisitvity [Ω*cm]<br />
Center brick Corner brick<br />
ESS 1 1.0 – 1.2 1.0 – 1.4<br />
ESS 2 1.4 – 2.3 1.4 – 2.0<br />
ESS 3 1.5 – 1.7 1.5 – 1.7<br />
poly 1.5 – 1.8 1.4 – 1.9<br />
3.2 Results of reverse current-voltage characteristics<br />
optimization<br />
Table V shows the average solar cell parameters over<br />
at least 12 solar cells of each group from positions<br />
covering the complete ingot height, which were<br />
processed using different texturisation methods. The soft<br />
iso texturisation was processed with the texturisation<br />
bath, but less silicon was removed compared to the<br />
standard iso-texturisation. The <strong>ISC</strong> recipe is not disclosed<br />
yet.<br />
Table V: Average solar cell parameters of solar cells,<br />
processed by different texturisations.<br />
Ingot Texture V oc<br />
[mV]<br />
70%<br />
ESS<br />
100%<br />
poly<br />
J sc<br />
[mA/cm²]<br />
FF<br />
[%]<br />
Eta<br />
[%]<br />
Iso 618.7 33.1 79.2 16.2<br />
Soft iso 615.7 33.2 79.4 16.2<br />
<strong>ISC</strong> 616.8 33.3 78.8 16.2<br />
Alkaline 6<strong>17</strong>.8 33.4 79.1 16.3<br />
NaOH 620.5 32.6 79.4 16.1<br />
Iso 614.9 34.2 78.9 16.6<br />
Soft iso 612.6 34.3 78.8 16.5<br />
<strong>ISC</strong> 614.2 34.2 78.7 16.5<br />
Alkaline 613.6 34.2 78.8 16.5<br />
NaOH 616.0 33.5 78.8 16.3<br />
As table V shows the solar cell efficiencies of almost all<br />
groups are similar. Only the NaOH flat etched solar cells<br />
show lower cell efficiencies, due to higher reflectivity<br />
resulting in lower J sc values. Depending on the<br />
texturisation the open-circuit of the solar cells is varying<br />
as a consequence of the different surface areas and thus<br />
different surface recombination velocities. The NaOH flat<br />
etched cells show the highest V oc due to the lowest<br />
surface area, whereas the wafers treated by the soft isotexturisation<br />
show the lowest V oc , most likely because the<br />
saw damage was not removed sufficiently. In general the<br />
ESS based solar cells show lower performance than the<br />
poly-Si based solar cells, due to significantly lower short<br />
circuit currents.<br />
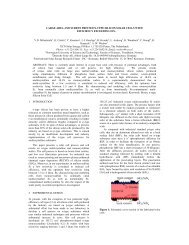
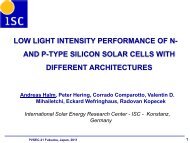
The influence of the different texturisation methods<br />
on the reverse current-voltage characteristics is shown in<br />
figure 7. For the poly-Si solar cells there is only a slight<br />
influence of the texturisation on the reverse current. Both<br />
versions of the iso-texturisation lead to reverse current<br />
values of 1.9 A and 1.5 A respectively, whereas the other<br />
three texturisations lead to reverse currents below 1.2 A.<br />
Even the higher values of the iso-texturisations are in a<br />
non critical region regarding possible hot spots in solar<br />
modules. For the ESS based solar cells the reverse<br />
current generally is higher, due to higher doping levels<br />
and assumable higher concentrations of impurities. The<br />
SoG-Si solar cells treated by the two versions of the isotexturisation<br />
show high reverse currents above 10 A,<br />
measured at a reverse voltage of -14.5 V. The mixed<br />
texturisation, the alkaline texturisation and the NaOH flat<br />
etching leads to reduced reverse current values between<br />
1.9 A and 3.6 A.<br />
12<br />
10<br />
8<br />
6<br />
4<br />
2<br />
0<br />
Figure 7: Average reverse currents, measured at -14.5 V,<br />
depending on the used wafer material and the applied<br />
texturisation.<br />
The lowest reverse current was obtained on the NaOH<br />
flat etched solar cells, due to the reduced influence of the<br />
solar cells surface, but at the same time the solar cell<br />
efficiency of those cell is the lowest. The alkaline<br />
texturisation shows the best combination of solar cell<br />
efficiency with 16.3% and a low reverse current of 3.2 A<br />
at -14.5V reverse voltage and thus seems to be a<br />
sufficient solution to prevent possible hot spots in ESS<br />
based solar modules, while allowing for high efficiencies.<br />
4 CONCLUSIONS<br />
iso soft iso <strong>ISC</strong> alka NaOH<br />
Texturisation<br />
70% ESS<br />
100% Poly<br />
The high quality of ESS feedstock was confirmed<br />
achieving solar cell efficiencies exceeding <strong>17</strong>% with best<br />
cells showing <strong>17</strong>.1% cell efficiency. The obtained cell<br />
results demonstrate that the ingots purified by IMCC<br />
show high solar cell performance and low LID, indicating<br />
that this technology can be an effective alternative for<br />
final purification of SoG-Si. An industrially applicable,<br />
regarding more efficient gettering optimized, POCl 3<br />
diffusion was investigated leading to a gain of 0.1% in<br />
absolute cell efficiency, due to higher V oc and J sc . The<br />
reverse current could also be lowered by the optimized<br />
diffusion, indicating a more efficient removal of<br />
impurities. Generally V oc and FF is higher for ESS based<br />
solar cell, because of the higher boron doping and thus a<br />
Fermi level shift and low resistivity, whereas Jsc appears
to be comparable to poly-Si based solar cells. The<br />
obtained results indicate the potential of ESS for high<br />
efficiency approaches.<br />
Applying an alkaline texturisation to mc wafers lead<br />
to an improvement of the reverse current-voltage<br />
characteristics of ESS based solar cells, while solar cell<br />
efficiency is similar or even higher compared to the state<br />
of the art acidic iso-texturisation, what can help to<br />
prevent hot spots in ESS based solar modules.<br />
5 REFERENCES<br />
[1] S. Beringov et al., New approach to SoG-Si pretreatment<br />
technology and parameters of solar cells<br />
produced with application thereof, 27 th EUPVSEC,<br />
Hamburg, Germany, (2012).<br />
[2] D. Macdonald et al., Boron-oxygen defects in<br />
compensated p-type Czochralski silicon, 24 th<br />
EUPVSEC, Hamburg, Germany, (2009).<br />
[3] R. Kopecek et al., Crystalline Si solar cells from<br />
compensated material; behavior of light induced<br />
degradation, 23 rd EUPVSEC, Valencia, Spain,<br />
(2008).<br />
[4] J. Libal et al., Effect of compensation and of metallic<br />
impurities on the electrical properties of Cz-grown<br />
solar grade silicon, Journal of Applied Physics 104,<br />
(2008).<br />
[5] K. Peter et al., Future potential for SoG-Si feedstock<br />
from the metallurgical process route, 23 rd EUPVSEC,<br />
Valencia, Spain, (2008).<br />
[6] K. Peter et al., Towards <strong>17</strong>% efficient multicrystalline<br />
solar grade silicon solar cells, 25 th EUPVSEC,<br />
Valencia, Spain, (2010).<br />
[7] W. Kwapil et al., Physical mechanisms of breakdown<br />
in multicrystalline silicon solar cells, 24 th EUPVSEC,<br />
Hamburg, Germany, (2009).<br />
[8] J. Bauer et al., Hot spots in multicrystalline silicon<br />
solar cells: avalanche breakdown due to etch pits,<br />
physica status solidi RRL 3, No.2, (2009).<br />
[9] M. Wilson et al., Accelerated light-induced<br />
degradation (ALID) for monitoring of defects in PV<br />
silicon wafers and solar cells, Journal of electronics<br />
mat., Vol 39, No.6, (2010).