High Performance Solar Cells Exceeding 17 ... - ISC Konstanz
High Performance Solar Cells Exceeding 17 ... - ISC Konstanz
High Performance Solar Cells Exceeding 17 ... - ISC Konstanz

Create successful ePaper yourself
Turn your PDF publications into a flip-book with our unique Google optimized e-Paper software.
Reverse current @-14.5V [A]<br />
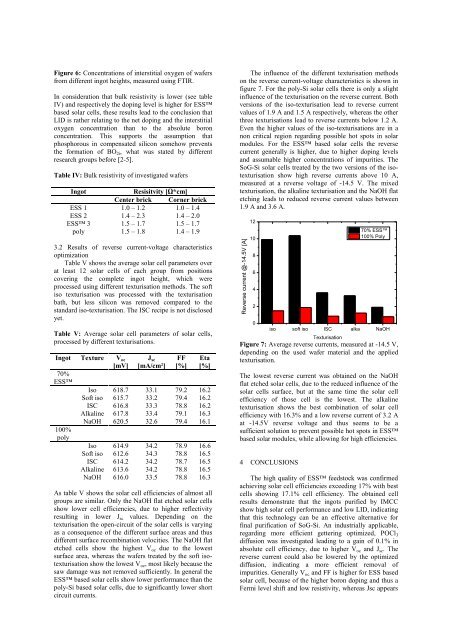
Figure 6: Concentrations of interstitial oxygen of wafers<br />
from different ingot heights, measured using FTIR.<br />
In consideration that bulk resistivity is lower (see table<br />
IV) and respectively the doping level is higher for ESS<br />
based solar cells, these results lead to the conclusion that<br />
LID is rather relating to the net doping and the interstitial<br />
oxygen concentration than to the absolute boron<br />
concentration. This supports the assumption that<br />
phosphorous in compensated silicon somehow prevents<br />
the formation of BO 2i , what was stated by different<br />
research groups before [2-5].<br />
Table IV: Bulk resistivity of investigated wafers<br />
Ingot<br />
Resisitvity [Ω*cm]<br />
Center brick Corner brick<br />
ESS 1 1.0 – 1.2 1.0 – 1.4<br />
ESS 2 1.4 – 2.3 1.4 – 2.0<br />
ESS 3 1.5 – 1.7 1.5 – 1.7<br />
poly 1.5 – 1.8 1.4 – 1.9<br />
3.2 Results of reverse current-voltage characteristics<br />
optimization<br />
Table V shows the average solar cell parameters over<br />
at least 12 solar cells of each group from positions<br />
covering the complete ingot height, which were<br />
processed using different texturisation methods. The soft<br />
iso texturisation was processed with the texturisation<br />
bath, but less silicon was removed compared to the<br />
standard iso-texturisation. The <strong>ISC</strong> recipe is not disclosed<br />
yet.<br />
Table V: Average solar cell parameters of solar cells,<br />
processed by different texturisations.<br />
Ingot Texture V oc<br />
[mV]<br />
70%<br />
ESS<br />
100%<br />
poly<br />
J sc<br />
[mA/cm²]<br />
FF<br />
[%]<br />
Eta<br />
[%]<br />
Iso 618.7 33.1 79.2 16.2<br />
Soft iso 615.7 33.2 79.4 16.2<br />
<strong>ISC</strong> 616.8 33.3 78.8 16.2<br />
Alkaline 6<strong>17</strong>.8 33.4 79.1 16.3<br />
NaOH 620.5 32.6 79.4 16.1<br />
Iso 614.9 34.2 78.9 16.6<br />
Soft iso 612.6 34.3 78.8 16.5<br />
<strong>ISC</strong> 614.2 34.2 78.7 16.5<br />
Alkaline 613.6 34.2 78.8 16.5<br />
NaOH 616.0 33.5 78.8 16.3<br />
As table V shows the solar cell efficiencies of almost all<br />
groups are similar. Only the NaOH flat etched solar cells<br />
show lower cell efficiencies, due to higher reflectivity<br />
resulting in lower J sc values. Depending on the<br />
texturisation the open-circuit of the solar cells is varying<br />
as a consequence of the different surface areas and thus<br />
different surface recombination velocities. The NaOH flat<br />
etched cells show the highest V oc due to the lowest<br />
surface area, whereas the wafers treated by the soft isotexturisation<br />
show the lowest V oc , most likely because the<br />
saw damage was not removed sufficiently. In general the<br />
ESS based solar cells show lower performance than the<br />
poly-Si based solar cells, due to significantly lower short<br />
circuit currents.<br />
The influence of the different texturisation methods<br />
on the reverse current-voltage characteristics is shown in<br />
figure 7. For the poly-Si solar cells there is only a slight<br />
influence of the texturisation on the reverse current. Both<br />
versions of the iso-texturisation lead to reverse current<br />
values of 1.9 A and 1.5 A respectively, whereas the other<br />
three texturisations lead to reverse currents below 1.2 A.<br />
Even the higher values of the iso-texturisations are in a<br />
non critical region regarding possible hot spots in solar<br />
modules. For the ESS based solar cells the reverse<br />
current generally is higher, due to higher doping levels<br />
and assumable higher concentrations of impurities. The<br />
SoG-Si solar cells treated by the two versions of the isotexturisation<br />
show high reverse currents above 10 A,<br />
measured at a reverse voltage of -14.5 V. The mixed<br />
texturisation, the alkaline texturisation and the NaOH flat<br />
etching leads to reduced reverse current values between<br />
1.9 A and 3.6 A.<br />
12<br />
10<br />
8<br />
6<br />
4<br />
2<br />
0<br />
Figure 7: Average reverse currents, measured at -14.5 V,<br />
depending on the used wafer material and the applied<br />
texturisation.<br />
The lowest reverse current was obtained on the NaOH<br />
flat etched solar cells, due to the reduced influence of the<br />
solar cells surface, but at the same time the solar cell<br />
efficiency of those cell is the lowest. The alkaline<br />
texturisation shows the best combination of solar cell<br />
efficiency with 16.3% and a low reverse current of 3.2 A<br />
at -14.5V reverse voltage and thus seems to be a<br />
sufficient solution to prevent possible hot spots in ESS<br />
based solar modules, while allowing for high efficiencies.<br />
4 CONCLUSIONS<br />
iso soft iso <strong>ISC</strong> alka NaOH<br />
Texturisation<br />
70% ESS<br />
100% Poly<br />
The high quality of ESS feedstock was confirmed<br />
achieving solar cell efficiencies exceeding <strong>17</strong>% with best<br />
cells showing <strong>17</strong>.1% cell efficiency. The obtained cell<br />
results demonstrate that the ingots purified by IMCC<br />
show high solar cell performance and low LID, indicating<br />
that this technology can be an effective alternative for<br />
final purification of SoG-Si. An industrially applicable,<br />
regarding more efficient gettering optimized, POCl 3<br />
diffusion was investigated leading to a gain of 0.1% in<br />
absolute cell efficiency, due to higher V oc and J sc . The<br />
reverse current could also be lowered by the optimized<br />
diffusion, indicating a more efficient removal of<br />
impurities. Generally V oc and FF is higher for ESS based<br />
solar cell, because of the higher boron doping and thus a<br />
Fermi level shift and low resistivity, whereas Jsc appears