6. LPC Bituminous Mixtures Design Guide, Sept 2007. - Aapaq.org
6. LPC Bituminous Mixtures Design Guide, Sept 2007. - Aapaq.org
6. LPC Bituminous Mixtures Design Guide, Sept 2007. - Aapaq.org
You also want an ePaper? Increase the reach of your titles
YUMPU automatically turns print PDFs into web optimized ePapers that Google loves.
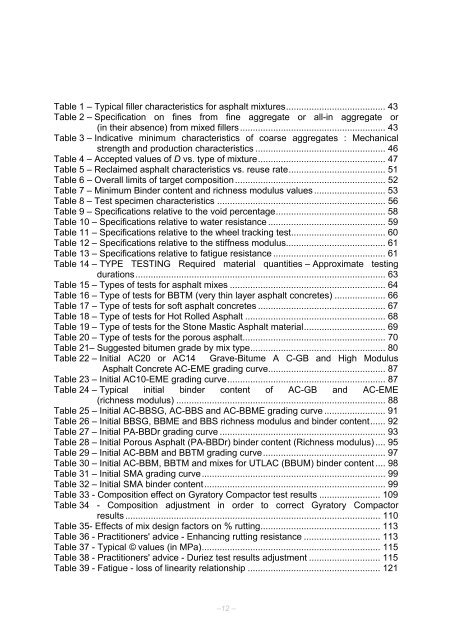
Table 1 – Typical filler characteristics for asphalt mixtures....................................... 43Table 2 – Specification on fines from fine aggregate or all-in aggregate or(in their absence) from mixed fillers......................................................... 43Table 3 – Indicative minimum characteristics of coarse aggregates : Mechanicalstrength and production characteristics ................................................... 46Table 4 – Accepted values of D vs. type of mixture.................................................. 47Table 5 – Reclaimed asphalt characteristics vs. reuse rate...................................... 51Table 6 – Overall limits of target composition........................................................... 52Table 7 – Minimum Binder content and richness modulus values ............................ 53Table 8 – Test specimen characteristics .................................................................. 56Table 9 – Specifications relative to the void percentage........................................... 58Table 10 – Specifications relative to water resistance .............................................. 59Table 11 – Specifications relative to the wheel tracking test..................................... 60Table 12 – Specifications relative to the stiffness modulus....................................... 61Table 13 – Specifications relative to fatigue resistance ............................................ 61Table 14 – TYPE TESTING Required material quantities – Approximate testingdurations.................................................................................................. 63Table 15 – Types of tests for asphalt mixes ............................................................. 64Table 16 – Type of tests for BBTM (very thin layer asphalt concretes) .................... 66Table 17 – Type of tests for soft asphalt concretes .................................................. 67Table 18 – Type of tests for Hot Rolled Asphalt ....................................................... 68Table 19 – Type of tests for the Stone Mastic Asphalt material................................ 69Table 20 – Type of tests for the porous asphalt........................................................ 70Table 21– Suggested bitumen grade by mix type..................................................... 80Table 22 – Initial AC20 or AC14 Grave-Bitume A C-GB and High ModulusAsphalt Concrete AC-EME grading curve.............................................. 87Table 23 – Initial AC10-EME grading curve.............................................................. 87Table 24 – Typical initial binder content of AC-GB and AC-EME(richness modulus) .................................................................................. 88Table 25 – Initial AC-BBSG, AC-BBS and AC-BBME grading curve ........................ 91Table 26 – Initial BBSG, BBME and BBS richness modulus and binder content...... 92Table 27 – Initial PA-BBDr grading curve ................................................................. 93Table 28 – Initial Porous Asphalt (PA-BBDr) binder content (Richness modulus) .... 95Table 29 – Initial AC-BBM and BBTM grading curve................................................ 97Table 30 – Initial AC-BBM, BBTM and mixes for UTLAC (BBUM) binder content .... 98Table 31 – Initial SMA grading curve........................................................................ 99Table 32 – Initial SMA binder content....................................................................... 99Table 33 - Composition effect on Gyratory Compactor test results ........................ 109Table 34 - Composition adjustment in order to correct Gyratory Compactorresults .................................................................................................... 110Table 35- Effects of mix design factors on % rutting............................................... 113Table 36 - Practitioners' advice - Enhancing rutting resistance .............................. 113Table 37 - Typical © values (in MPa)...................................................................... 115Table 38 - Practitioners' advice - Duriez test results adjustment ............................ 115Table 39 - Fatigue - loss of linearity relationship .................................................... 121–12 –


