6. LPC Bituminous Mixtures Design Guide, Sept 2007. - Aapaq.org
6. LPC Bituminous Mixtures Design Guide, Sept 2007. - Aapaq.org
6. LPC Bituminous Mixtures Design Guide, Sept 2007. - Aapaq.org

Create successful ePaper yourself
Turn your PDF publications into a flip-book with our unique Google optimized e-Paper software.
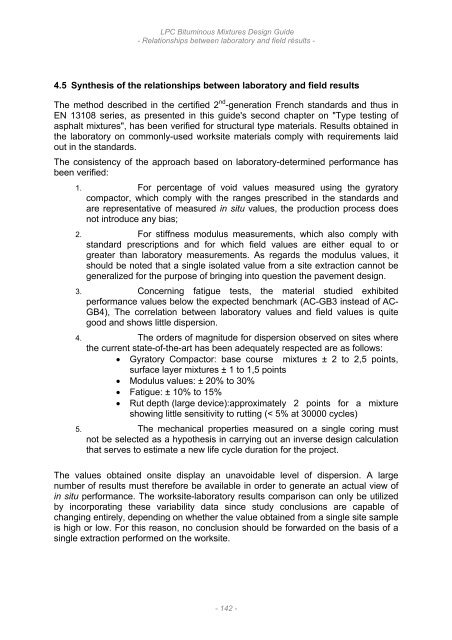
<strong>LPC</strong> <strong>Bituminous</strong> <strong>Mixtures</strong> <strong>Design</strong> <strong>Guide</strong>- Relationships between laboratory and field résults -4.5 Synthesis of the relationships between laboratory and field resultsThe method described in the certified 2 nd -generation French standards and thus inEN 13108 series, as presented in this guide's second chapter on "Type testing ofasphalt mixtures", has been verified for structural type materials. Results obtained inthe laboratory on commonly-used worksite materials comply with requirements laidout in the standards.The consistency of the approach based on laboratory-determined performance hasbeen verified:1. For percentage of void values measured using the gyratorycompactor, which comply with the ranges prescribed in the standards andare representative of measured in situ values, the production process doesnot introduce any bias;2. For stiffness modulus measurements, which also comply withstandard prescriptions and for which field values are either equal to <strong>org</strong>reater than laboratory measurements. As regards the modulus values, itshould be noted that a single isolated value from a site extraction cannot begeneralized for the purpose of bringing into question the pavement design.3. Concerning fatigue tests, the material studied exhibitedperformance values below the expected benchmark (AC-GB3 instead of AC-GB4), The correlation between laboratory values and field values is quitegood and shows little dispersion.4. The orders of magnitude for dispersion observed on sites wherethe current state-of-the-art has been adequately respected are as follows:• Gyratory Compactor: base course mixtures ± 2 to 2,5 points,surface layer mixtures ± 1 to 1,5 points• Modulus values: ± 20% to 30%• Fatigue: ± 10% to 15%• Rut depth (large device): approximately 2 points for a mixtureshowing little sensitivity to rutting (< 5% at 30000 cycles)5. The mechanical properties measured on a single coring mustnot be selected as a hypothesis in carrying out an inverse design calculationthat serves to estimate a new life cycle duration for the project.The values obtained onsite display an unavoidable level of dispersion. A largenumber of results must therefore be available in order to generate an actual view ofin situ performance. The worksite-laboratory results comparison can only be utilizedby incorporating these variability data since study conclusions are capable ofchanging entirely, depending on whether the value obtained from a single site sampleis high or low. For this reason, no conclusion should be forwarded on the basis of asingle extraction performed on the worksite.- 142 -