Full year report 2012 - Nobel Biocare Corporate
Full year report 2012 - Nobel Biocare Corporate
Full year report 2012 - Nobel Biocare Corporate

Create successful ePaper yourself
Turn your PDF publications into a flip-book with our unique Google optimized e-Paper software.
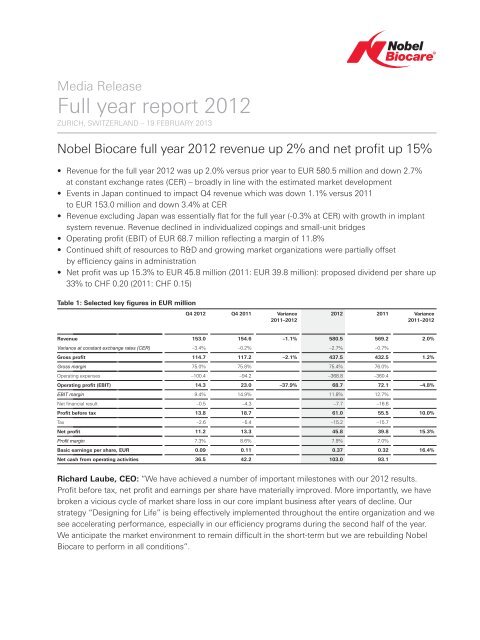
Media Release<strong>Full</strong> <strong>year</strong> <strong>report</strong> <strong>2012</strong>ZURICH, SWITZERLAND – 19 FEBRUARY 2013<strong>Nobel</strong> <strong>Biocare</strong> full <strong>year</strong> <strong>2012</strong> revenue up 2% and net profit up 15%• Revenue for the full <strong>year</strong> <strong>2012</strong> was up 2.0% versus prior <strong>year</strong> to EUR 580.5 million and down 2.7%at constant exchange rates (CER) – broadly in line with the estimated market development• Events in Japan continued to impact Q4 revenue which was down 1.1% versus 2011to EUR 153.0 million and down 3.4% at CER• Revenue excluding Japan was essentially flat for the full <strong>year</strong> (-0.3% at CER) with growth in implantsystem revenue. Revenue declined in individualized copings and small-unit bridges• Operating profit (EBIT) of EUR 68.7 million reflecting a margin of 11.8%• Continued shift of resources to R&D and growing market organizations were partially offsetby efficiency gains in administration• Net profit was up 15.3% to EUR 45.8 million (2011: EUR 39.8 million): proposed dividend per share up33% to CHF 0.20 (2011: CHF 0.15)Table 1: Selected key figures in EUR millionQ4 <strong>2012</strong> Q4 2011 Variance <strong>2012</strong> 2011 Variance2011–<strong>2012</strong> 2011–<strong>2012</strong>Revenue 153.0 154.6 –1.1% 580.5 569.2 2.0%Variance at constant exchange rates (CER) –3.4% –0.2% –2.7% –0.7%Gross profit 114.7 117.2 –2.1% 437.5 432.5 1.2%Gross margin 75.0% 75.8% 75.4% 76.0%Operating expenses –100.4 –94.2 –368.8 –360.4Operating profit (EBIT) 14.3 23.0 –37.9% 68.7 72.1 –4.8%EBIT margin 9.4% 14.9% 11.8% 12.7%Net financial result –0.5 –4.3 –7.7 –16.6Profit before tax 13.8 18.7 61.0 55.5 10.0%Tax –2.6 –5.4 –15.2 –15.7Net profit 11.2 13.3 45.8 39.8 15.3%Profit margin 7.3% 8.6% 7.9% 7.0%Basic earnings per share, EUR 0.09 0.11 0.37 0.32 16.4%Net cash from operating activities 36.5 42.2 103.0 93.1Richard Laube, CEO: “We have achieved a number of important milestones with our <strong>2012</strong> results.Profit before tax, net profit and earnings per share have materially improved. More importantly, we havebroken a vicious cycle of market share loss in our core implant business after <strong>year</strong>s of decline. Ourstrategy “Designing for Life” is being effectively implemented throughout the entire organization and wesee accelerating performance, especially in our efficiency programs during the second half of the <strong>year</strong>.We anticipate the market environment to remain difficult in the short-term but we are rebuilding <strong>Nobel</strong><strong>Biocare</strong> to perform in all conditions”.
Business performance updateTable 2: Revenue by regionin EUR million Q4 <strong>2012</strong> Q4 2011 * Variance Variance <strong>2012</strong> 2011 * Variance Variance(CER)(CER)Europe, Middle East and Africa (EMEA) 62.1 63.2 –1.7% –2.7% 230.1 237.0 –2.9% –3.6%Share of total revenue 41% 41% 40% 41%Americas 61.0 56.8 7.4% 2.8% 228.5 208.6 9.5% 1.8%Share of total revenue 40% 37% 39% 37%Asia/Pacific 29.9 34.6 –13.6% –14.9% 121.9 123.6 –1.4% –8.6%Share of total revenue 19% 22% 21% 22%Total 153.0 154.6 –1.1% –3.4% 580.5 569.2 2.0% –2.7%* A new segment “Americas”, which reflects realigned management structures, has been <strong>report</strong>ed since 1 January <strong>2012</strong>. As previously announced, the revenue ofLatAm/RoW has now been included into other regions, mainly North America. For better comparison, prior <strong>year</strong> figures have been reclassified to reflect the new regionalsegment definition.In <strong>2012</strong>, <strong>Nobel</strong> <strong>Biocare</strong> generated revenue of EUR 580.5 million, an increase of 2.0% compared with2011 supported by a positive currency effect driven mainly by the strong US dollar and Japanese yenagainst the euro. This development is estimated to be in line with peers. Year-on-<strong>year</strong> CER growth wasdown 2.7%. Revenue was significantly impacted by the double-digit percentage market decline in Japan,which contributes about 12% to the group revenue. Excluding Japan, revenue for the full <strong>year</strong> would beat prior <strong>year</strong> level at CER (-0.3%).In Europe, Middle East and Africa (EMEA), revenue (CER) for the full <strong>year</strong> declined by 3.6% toEUR 230.1 million (Q4 <strong>2012</strong>: -2.7% CER). Many markets in this region remained weak throughout the<strong>year</strong> due to the continued economic and fiscal challenges and subsequent low patient flow for implantbasedtooth restorations. In two large European markets, Spain and Italy, the decline in <strong>2012</strong> wassignificant. <strong>Nobel</strong> <strong>Biocare</strong> developed at least in line with peers in most markets in Europe. Market sharegains were achieved in Russia and France as well as in Italy and Sweden in declining markets.In the Americas, revenue (CER) in <strong>2012</strong> increased by 1.8% to EUR 228.5 million (Q4 <strong>2012</strong>: 2.8%). Thisperformance was driven by the low single-digit percent increase in the US, driven by implant systems,which grew broadly in line with peers, supported by the continued implementation of value-addedservices. As a result of the softening market in the US during the course of the <strong>year</strong>, the landscape hasbecome more competitive. In Canada performance remained sluggish after a weak start to the <strong>year</strong>. In<strong>Nobel</strong> <strong>Biocare</strong>’s two directly-served Latin American countries, Brazil and Mexico, the company achieveda strong improvement compared with the prior <strong>year</strong>.In the Asia/Pacific region, revenue (CER) for the full <strong>year</strong> was down 8.6% to EUR 121.9 million (Q4<strong>2012</strong>: -14.9%). The market in Japan was heavily affected due to adverse media coverage on dentalimplant treatments in general. Subsequently, patient flow declined significantly and the market wasestimated to be down about 15%. Excluding Japan, which accounts for about 60% of the regionalrevenue, APAC grew 6.9% (CER) in <strong>2012</strong>. Double-digit percent increases were achieved in China, Indiaand Taiwan, while revenue in Australia and Southeast Asia declined. Thanks to continued rapid growth,China is now the third largest revenue contributor in the region after Japan and Australia.<strong>Full</strong> <strong>year</strong> <strong>report</strong> <strong>2012</strong>2/21
Alpha-Bio Tec (ABT) is targeting customer groups with higher price sensitivity and simpler product andsolutions needs. ABT continued to show growth rates above 20% thanks to the expansion of itsdistributor network and increasing market share in its distributor markets.Implant systems (84% of Group revenue) declined 1.3% (CER) for the <strong>year</strong>. <strong>Nobel</strong>Active ® continued togrow at strong rates throughout the <strong>year</strong>, supported by the introduction of the 3.0 version and was up13% over the prior <strong>year</strong>. The new implant launches <strong>Nobel</strong>Replace ® Platform Shift (PS) and ConicalConnection (CC) developed on track, attracting new customers and positively contributing to thedevelopment of <strong>Nobel</strong>Replace ® , which is the Group’s largest implant line. Excluding Japan, whereimplant treatments were negatively affected as described above, implant systems grew 1.9% (CER) forthe full <strong>year</strong>. The individualized business (16% of group revenue) declined 9.2% in <strong>2012</strong>. In this areahigh-end implant-retained solutions were flat, while the decline was above 20% in scanners andtraditional tooth-based restorations, where production is shifting towards chair-side and in-lab. Therecently launched <strong>Nobel</strong>Clinician TM treatment planning system, also uniquely available on Mac OS ® , isimproving treatment safety and gaining new subscribers. This tool has sold disproportionally well inJapan in view of the media coverage on implant safety. In October <strong>2012</strong>, the first iPad ® controlled drillmotor OsseoCare TM Pro were delivered and beta testing in the <strong>Nobel</strong>Procera ® Scan and Design Centerstarted, enabling laboratory customers a convenient way to access precision individualized componentsto treat edentulous patients.Financial performance updateGross profit in the <strong>report</strong>ing period increased to EUR 437.5 million (2011: EUR 432.5 million), reflectinga slightly lower gross margin of 75.4% compared with the previous <strong>year</strong> (2011: 76.0%). The negativesales impact in Japan and the reassessment of a royalty liability related to prior <strong>year</strong>s accounted for thedecline in margin. A positive margin impact from currency and a slightly more favorable business mix(implant systems versus individualized) was broadly offset by a higher share of ABT sales and expensesfor the build-up of the new <strong>Nobel</strong>Procera Scan and Design Center. The gross margin in individualizedwas largely in line with a <strong>year</strong> ago at just about 45%.Operating expenses in the full <strong>year</strong> were EUR 368.8 million (2011: EUR 360.4 million). In the course of<strong>2012</strong> various initiatives were put into place to reshape <strong>Nobel</strong> <strong>Biocare</strong> into a fitter, performance-orientedorganization. Rightsizing of some functions was driven by reallocating resources to growth drivers suchas R&D and training and education. Further, <strong>Nobel</strong> <strong>Biocare</strong> rolled out its value-added program intoadditional markets, shifted sales resources from countries in decline in Europe to growing markets, suchas the US, China and Brazil. In addition, the company conducted six successful <strong>Nobel</strong> <strong>Biocare</strong> symposiain Europe and North America. As innovative products and solutions are a key growth driver for thebusiness, over 50 R&D projects were initiated and R&D spending increased by EUR 6.0 million or 21%(16% CER). This was partly funded through a reduction of administrative functions and expenses of EUR4.9 million or 6% (-9% CER). The efficiency improvement programs that were initiated throughout theorganization resulted in a reduction in headcount in the fourth quarter of the <strong>year</strong>. Overall operatingexpenses in <strong>2012</strong> include EUR 13.0 million from currency translation and EUR 3.7 million from nonrecurringcosts related to the accelerated measures to improve efficiency as well as increased costsrelated to legal cases. Excluding costs for termination and severance across functions, operatingexpenses in relation to sales at CER were broadly in line with prior <strong>year</strong>, and slightly lower in <strong>report</strong>edcurrency.<strong>Full</strong> <strong>year</strong> <strong>report</strong> <strong>2012</strong>3/21
Profit from operations (EBIT) for the full <strong>year</strong> was slightly down to EUR 68.7 million (2011: EUR 72.1million). Impact from lower Japan sales, a reassessment of a royalty liability related to prior <strong>year</strong>s andtermination and severance costs accounted for the decrease in EBIT margin over the prior <strong>year</strong>. Positivecurrency impact was largely offset by investments into growth drivers. The EBIT margin for <strong>2012</strong> was11.8% (or 11.0% in CER) compared with 12.7% in the prior <strong>year</strong>.Currencies – For <strong>2012</strong>, the favorable currency translation impact was 4.7pp on revenue, and 0.8pp onthe EBIT margin. The US dollar and Japanese yen strengthening against the euro drove this positivecurrency translation impact. Gross margin was positively impacted by 0.1pp.The net financial result in the <strong>report</strong>ing <strong>year</strong> was EUR -7.7 million (2011: EUR -16.6 million). Interestexpense in <strong>2012</strong> was lower due to a lower debt level compared with the <strong>year</strong> before (EUR 250 millionconvertible bonds repaid in November 2011 and replaced by a CHF 120 million straight bond). While thehedging result of the ongoing business was broadly neutral, the overall hedging result comparisonbenefitted from a EUR 11.6 million one-off hedging cost in relation to the convertible bond in 2011.Taxes –Tax expenses in <strong>2012</strong> were EUR 15.2 million versus EUR 15.7 million in 2011. A more favorableregional profit contribution mix as well as favorable outcome of certain tax disputes led to this improvedresult despite a higher profit before tax. The underlying tax rate is 24.8% compared with 28.3% in theprior <strong>year</strong>.Net profit for the <strong>year</strong> was up by 15.3% to EUR 45.8 million (2011: EUR 39.8 million), reflecting a highernet profit margin of 7.9% (2011: 7.0%). The improved net financial result and tax result were the mainreasons for this improvement, which led to earnings per share (EPS) of EUR 0.37 (2011: EUR 0.32).Cash flow from operating activities for the full <strong>year</strong> totaled EUR 103.0 million (2011: EUR 93.1million). This improvement was primarily a result of exceptional taxes paid in the previous <strong>year</strong>. At theend of <strong>2012</strong>, <strong>Nobel</strong> <strong>Biocare</strong> <strong>report</strong>ed a cash position of EUR 146.6 million versus EUR 107.5 million in2011 and has returned to a net cash position. This cash level is further supported by the syndicatedcredit facility giving the Group sufficient financial flexibility from a strategic perspective.Strategy progress update<strong>Nobel</strong> <strong>Biocare</strong>’s strategy is guided by the company mission “Designing for Life”. This aims to helpcustomers treat more patients better for improved quality of life with superior products and solutionsdesigned to last the life of the patient. This mission is realized and business performance is achievedthrough four strategic pillars:Innovative products and solutions “Designing for Life” – The <strong>Nobel</strong>Active ® implant system hasreached 5 <strong>year</strong>s of double-digit growth. This performance was supported by the successful launchexecution of the 3.0 narow version, which continues to attract new customers. The introduction of<strong>Nobel</strong>Replace ® Platform Shift (PS) and <strong>Nobel</strong>Replace Conical Connection (CC) has also been on track.Aiding patient safety through the use of digital technology is one of the focus areas. Here, the recentlyupgraded <strong>Nobel</strong>Clinician TM treatment planning software continues to gain new subscribers,disproportionally well in Japan. Further, the Group saw a very well uptake of the new drill motor,<strong>Full</strong> <strong>year</strong> <strong>report</strong> <strong>2012</strong>4/21
OsseoCare TM Pro, that was introduced in October and is uniquely operated by an iPad ® . As previously<strong>report</strong>ed, the new <strong>Nobel</strong>Procera ® Scan and Design Center began initial beta testing in early October,offering customers a convenient way to access precision individualized components needed to treatedentulous patients. The Group is again at the forefront and widening its lead in the digital workflow.Customer value add “Partnering for Life”– Over the course of the <strong>year</strong>, <strong>Nobel</strong> <strong>Biocare</strong> hasestablished a new sales and marketing organization, reducing redundancies and enabling quicker serviceto the customer. A tool box with a broad variety of programs to help customers to treat more patientsbetter was introduced. The programs range from study clubs and the esthetic alliance that improvesprofessional networking and various patient communication tools designed to attract patient visits. Tofacilitate interaction with <strong>Nobel</strong> <strong>Biocare</strong>, a new online store went live, first in the US, with gradualintroduction in EMEA and Asia in 2013. To support the recent and upcoming product and solutionlaunches the Sales Academy sales force training program has been rolled out globally since thebeginning of this <strong>year</strong>.Training and education “Learning for Life”– The Company established a new T&E concept withleading clinicians, which aims to help customers to improve quality of treatment care and safety. Thecompany conducted six very well attended symposia in Europe and North America in <strong>2012</strong>. The recentlyannounced Global Symposium in New York in June, featuring nearly 100 key opinion leaders and expertsin their fields has filled up quickly and only a few seats are left.Operating efficiency and effectiveness – <strong>Nobel</strong> <strong>Biocare</strong> is systematically reshaping into a fitterperformance- oriented organization. Efficiency improvement programs have been initiated throughoutthe organization, resulting in a reduction in headcount in the fourth quarter. Resources were reallocatedfrom administration to growth drivers such as R&D and growing country organizations.Product launches 2013 – <strong>Nobel</strong> <strong>Biocare</strong> has established a systematic innovation pipeline following therelevant clinical focus areas. For 2013 the following launches have already been announced: A newimplant version with a partially machined collar expanding the <strong>Nobel</strong>Replace ® portfolio. Further, asignificant upgrade of <strong>Nobel</strong>Clinician improving images for planning of implant placement and prostheticrestorations. A new second-generation <strong>Nobel</strong>Procera ® Scanner and additional restorative components forcompetitive implant platforms, further opening <strong>Nobel</strong>Procera ® . Additionally, an initial milestone step willbe achieved with the opening of the <strong>Nobel</strong>Procera ® milling system to a third-party scanner with the newopenaccess program.Executive Committee update – Effective 1 January 2013, Walter Ritter, Head Global HumanResources was appointed to the <strong>Nobel</strong> <strong>Biocare</strong> Executive Committee. At the same time, Frank Mengisassumed his responsibilities as Head of Global Operations and member of the Executive Committee.Frank Mengis has extensive senior management experience in operations and manufacturing in the lifesciences field including the dental industry. Most recently, he held senior management positions inProject Management and Development, Global Manufacturing, Operations and Quality Management atStraumann.Annual General MeetingThe Board of Directors’ proposals to the Annual General Meeting of shareholders (AGM) scheduled for28 March 2013, in Zurich, Switzerland, in addition to the approval of the annual accounts, include:<strong>Full</strong> <strong>year</strong> <strong>report</strong> <strong>2012</strong>5/21
Dividend – The Board of Directors proposes a dividend of CHF 0.20 per registered share (2011: CHF0.15) reflecting the improved net profit of the <strong>year</strong> and a payout ratio of 44%. It is planned to pay thisdividend out of reserves and in a shareholder-friendly way without deduction of withholding tax. Thepayment date for this dividend, if approved by the AGM, is set for 8 April 2013 (ex-dividend date: 3 April2013, record date: 5 April 2013).Addition to the Board of Directors – To drive the implementation of <strong>Nobel</strong> <strong>Biocare</strong>’s strategy, one ofthe priorities of the Board of Directors has been to broaden and strengthen its operational andmanagement expertise, in particular in the area of medical technology and implant-based toothrestoration. Following this priority, the Board of Directors proposes Franz Maier to be elected as aMember of the Board. Franz Maier brings a successful track record of over 20 <strong>year</strong>s in both functionaland general management positions, most recently as an Executive Vice President Sales and Member ofthe Executive Board of Straumann in the medical devices and biotechnology industry. All existingMembers of the Board stand for re-election.Outlook<strong>Nobel</strong> <strong>Biocare</strong> believes that the market conditions for 2013 will remain difficult, similar to <strong>2012</strong>.In this environment, the Company targets to modestly build market share and deliver modest revenuegrowth. Based on this and the initiated measures, and barring any unforeseen events, <strong>Nobel</strong> <strong>Biocare</strong>expects to deliver an EBIT margin improvement of 50 to100 bps at constant exchange rates (CER).<strong>Nobel</strong> <strong>Biocare</strong> is moving from ‘rebuilding’ to a phase of continual performance improvements. Withinthe next 3 to 5 <strong>year</strong>s, assuming markets improve beyond 2013 to modest mid-single digit growth, <strong>Nobel</strong><strong>Biocare</strong> targets growing at least in line with the market and to improve EBIT margin also continuallybetween 50 to 100 bps per annum at constant exchange rates.<strong>Nobel</strong> <strong>Biocare</strong> (NOBN, SIX Swiss Exchange) is a world leader in innovative restorative and esthetic dentalsolutions. As a complete solutions provider, <strong>Nobel</strong> <strong>Biocare</strong> offers the most comprehensive range of solutionsfrom tooth to root, for single tooth to fully edentulous indications. The solutions portfolio covers dentalimplants (including the key brands <strong>Nobel</strong>Active ® , Brånemark System ® and <strong>Nobel</strong>Replace ® , individualizedprosthetics and equipment (<strong>Nobel</strong>Procera ® , guided surgery solutions and biomaterials). <strong>Nobel</strong> <strong>Biocare</strong> hasapproximately 2’500 employees and recorded revenue of EUR 580.5 million in <strong>2012</strong>. The company is headquarteredin Zurich, Switzerland. Production takes place at seven sites located in Canada, Israel, Japan,Sweden, and the US. <strong>Nobel</strong> <strong>Biocare</strong> has 34 direct sales organizations.Further information is available from:Süha DemokanInvestor and <strong>Corporate</strong> RelationsTel: +41 43 211 42 30, +41 79 430 81 46suha.demokan@nobelbiocare.com<strong>Full</strong> <strong>year</strong> <strong>report</strong> <strong>2012</strong>6/21
The complete <strong>Full</strong> Year Report <strong>2012</strong> is available in English, while an abridged version of the <strong>report</strong> isavailable in German. Both documents can be downloaded from the <strong>Nobel</strong> <strong>Biocare</strong> website athttp://corporate.nobelbiocare.com/en/investors and http://corporate.nobelbiocare.com/de/investors,respectively. A preliminary PDF version of the Annual Report <strong>2012</strong> in English can be downloaded viawww.nobelbiocare.com or obtained from investor.relations@nobelbiocare.com.As <strong>Nobel</strong> <strong>Biocare</strong> is covered by various financial analysts, the company has contracted Vara Research toperiodically update the consensus analysis, based on the estimates of all participating brokerage firms.The most recent analyst consensus can be accessed at any time via the following site:http://corporate.nobelbiocare.com/en/investors/financial-analysis/analyst-consensus.aspx.Investor and analyst presentationAn investor and analyst presentation in English will be held today, 19 February 2013, at 10.00 am CET atthe SIX Swiss Exchange, ConventionPoint, Auditorium, Selnaustrasse 30, Zurich, Switzerland.This presentation can be listened to live via audio-webcast at www.nobelbiocare.com/investors and isalso accessible via telephone conference, using the dial-in numbers below:+41 (0)91 610 56 00 Continental Europe+44 (0)203 059 58 62 UK+1 (1) 631 570 56 13 USAFor additional local dial-in numbers, please Investors section of our website: www.nobelbiocare.com.To ensure timely participation, please call approximately 5–10 minutes prior to the times indicated above.Recording of the webcast will be available on the website shortly after the end of the conference.Financial calendar:Annual General Meeting 28 March 2013Interim Report 1, 2013 25 April 2013Interim Report 2, 2013 22 August 2013Interim Report 3, 2013 07 November 2013<strong>Full</strong> Year Report 2013 18 February 2014<strong>Full</strong> <strong>year</strong> <strong>report</strong> <strong>2012</strong>7/21
DisclaimerThis media release contains forward-looking statements based on beliefs of <strong>Nobel</strong> <strong>Biocare</strong>’s management. When usedin this media release, words such as “anticipate”, “believe”, “estimate”, “expect”, “intend”, “plan” and “project” areintended to identify forward-looking statements. They may involve risks and uncertainties, including technologicaladvances in the medical field, product demand and market acceptance, the effect of economic conditions, the impactof competitive products and pricing, foreign currency exchange rates and other risks. These forward-looking statementsreflect the views of <strong>Nobel</strong> <strong>Biocare</strong> as of the date made with respect to future events and are subject to risks and uncertainties.All of these forward-looking statements are based on estimates and assumptions made by management ofthe company and are believed to be reasonable, though are inherently uncertain and difficult to predict. Actual resultsor experience could differ materially from the forward-looking statements. <strong>Nobel</strong> <strong>Biocare</strong> disclaims any intention orobligation to update these forward-looking statements.<strong>Full</strong> <strong>year</strong> <strong>report</strong> <strong>2012</strong>8/21
Selected financial informationin EUR million Q4 <strong>2012</strong> Q4 2011 FY <strong>2012</strong> FY 2011Income statementRevenue 153.0 154.6 580.5 569.2Gross profit 114.7 117.2 437.5 432.5Operating expenses –100.4 –94.2 –368.8 –360.4Profit from operations (EBIT) 14.3 23.0 68.7 72.1Profit before tax 13.8 18.7 61.0 55.5Income tax expense –2.6 –5.4 –15.2 –15.7Profit attributable to owners of <strong>Nobel</strong> <strong>Biocare</strong> 11.2 13.3 45.8 39.8Balance sheetNon-current assets 297.8 324.5Current assets 302.8 267.7Total equity 325.0 281.5Non-current liabilities 140.6 136.8Current liabilities 135.0 173.9Cash and cash equivalents including bank overdraft 146.6 107.5MiscellaneousNet cash from operating activities 36.5 42.2 103.0 93.1Depreciation, amortization and impairment losses 7.6 8.8 32.0 32.5Investments in property, plant and equipment 2.1 3.0 7.6 17.0Research and development expenses 10.3 8.0 35.0 29.0Employees as of the end of the period (number) 2’496 2’472Key ratiosRevenue growth (%) –1.1 0.9 2.0 –1.3Revenue growth in local currencies (%) –3.4 –0.2 –2.7 –0.7Gross margin (%) 75.0 75.8 75.4 76.0Operating expenses/revenue ratio (%) 65.6 60.9 63.5 63.3EBITDA margin (%) 14.3 20.6 17.4 18.4Operating (EBIT) margin (%) 9.4 14.9 11.8 12.7Net profit margin (%) 7.3 8.6 7.9 7.0Return on average equity (%) 1 15.2 14.0Equity/assets ratio (%) 54.1 47.5Share informationNumber of shares as of end of period 123’784’530 123’784’530Average number of shares outstanding 123’054’603 122’775’158Share price as of end of period (CHF) 7.76 10.92Market value as of end of period (MCHF) 961 1’352Basic earnings per share (EUR) 0.09 0.11 0.37 0.32Diluted earnings per share (EUR) 0.09 0.11 0.37 0.32Equity per share (EUR) 2.63 2.271 Includes net profit for the last four quarters over average equity for the last four quarters<strong>Full</strong> <strong>year</strong> <strong>report</strong> <strong>2012</strong>9/21
Audit proceduresThe condensed interim <strong>report</strong> has not been audited. However, the <strong>report</strong> is based on the consolidatedbalance sheet as of 31 December <strong>2012</strong>, the consolidated statements of income, comprehensive income,changes in equity and cash flows for the financial <strong>year</strong> <strong>2012</strong>, and the explanatory notes. The incomestatement, statement of comprehensive income and cash flow statement for the three-month periodfrom 1 October to 31 December <strong>2012</strong> were not subject to any audit procedures.<strong>Full</strong> <strong>year</strong> <strong>report</strong> <strong>2012</strong>10/21
Condensed consolidatedfinancial statements <strong>2012</strong>FULL-YEAR REPORT <strong>2012</strong><strong>Nobel</strong> <strong>Biocare</strong> Holding AG, P.O. Box, CH-8058 Zurich AirportTel +41 (0) 43 211 42 00<strong>Full</strong> <strong>year</strong> <strong>report</strong> <strong>2012</strong>11/21
Income statementin EUR ‘000 Note Q4 <strong>2012</strong> Q4 2011 FY <strong>2012</strong> FY 2011Revenue 6 152’994 154’621 580’485 569’179Cost of goods sold –38’255 –37’406 –143’003 –136’677Gross profit 114’739 117’215 437’482 432’502Selling and marketing expenses 1 –69’557 –66’066 –259’536 –252’219Administrative expenses 1 –20’518 –20’077 –74’252 –79’152Research and development expenses –10’346 –8’028 –35’008 –29’005Profit from operations (EBIT) 14’318 23’044 68’686 72’126Financial income 7 683 414 1’207 2’335Finance cost 7 –2’338 –3’882 –9’076 –14’318Net foreign exchange result 7 1’123 –883 178 –4’674Profit before tax 13’786 18’693 60’995 55’469Income tax expenses –2’636 –5’428 –15’146 –15’688Profit attributable to owners of <strong>Nobel</strong> <strong>Biocare</strong> 11’150 13’265 45’849 39’781Basic earnings per share (EUR) 0.09 0.11 0.37 0.32Diluted earnings per share (EUR) 0.09 0.11 0.37 0.321 Certain comparatives have been reclassified from administrative to selling and marketing expenses.Statement of comprehensive incomein EUR ‘000 Note Q4 <strong>2012</strong> Q4 2011 FY <strong>2012</strong> FY 2011Profit attributable to owners of <strong>Nobel</strong> <strong>Biocare</strong> 11’150 13’266 45’849 39’781Other comprehensive income:Foreign currency translation differences –4’916 17’913 523 –37’276Effective portion of changes in fair valueof net investment hedges 867 – –633 –Reclassification of foreign currency translationdifferences to income statement, net of tax 7 – 508 – 1’217Effective portion of changes in fair valueof cash flow hedges, net of tax 1’158 –257 3’474 –6’397Net change in fair value of cash flow hedgesreclassified to income statement, net of tax 7 –490 109 1’315 –2’649Total other comprehensive income/(expenses)for the period, net of tax –3’381 18’273 4’679 –45’105Total comprehensive income/(expenses) for theperiod attributable to owners of <strong>Nobel</strong> <strong>Biocare</strong> 7’769 31’539 50’528 –5’324<strong>Full</strong> <strong>year</strong> <strong>report</strong> <strong>2012</strong>12/21
Balance sheetin EUR ‘000 Note 31 December <strong>2012</strong> 31 December 2011AssetsProperty, plant and equipment 70’950 86’331Intangible assets 205’674 212’558Non-current receivables 3’940 3’420Deferred tax assets 17’274 22’235Total non-current assets 297’838 324’544Inventories 20’433 23’946Trade and other receivables 96’217 109’362Current income tax assets 17’411 5’799Prepaid expenses and accrued income 13’743 13’754Derivative financial instruments 8’369 7’389Cash and cash equivalents 1 146’571 107’456Total current assets 302’744 267’706Total assets 600’582 592’250Equity and liabilitiesShare capital 8 31’861 31’861Share premium 108’547 111’023Treasury shares –16’185 –21’498Retained earnings 200’825 160’118Total equity attributable to owners of <strong>Nobel</strong> <strong>Biocare</strong> 325’048 281’504Provisions 3’134 3’172Pension liabilities 10’353 8’643Loans and borrowings 99’505 98’400Deferred tax liabilities 27’324 26’269Other non-current liabilities 244 357Total non-current liabilities 140’560 136’841Loans and borrowings – 36’928Trade payables 19’191 15’378Current provisions 8’763 5’935Current income tax liabilities 38’941 36’763Other current liabilities and derivatives 11’443 16’748Accrued expenses and deferred income 56’636 62’153Total current liabilities 134’974 173’905Total liabilities 275’534 310’746Total equity and liabilities 600’582 592’2501 As of 31 December <strong>2012</strong>, the Group held no restricted cash (31 December 2011: EUR 7’122 k).<strong>Full</strong> <strong>year</strong> <strong>report</strong> <strong>2012</strong>13/21
Statement of changes in equityin EUR ‘000 Note Share Share Treasury Trans- Hedging Other Total Total equityCapital premium shares lation reserve retained retained attributablereserve earnings earnings to ownersof <strong>Nobel</strong><strong>Biocare</strong>Balance as of 1 January 2011 31’861 151’113 –40’216 –123’281 2’820 297’692 177’231 319’989Comprehensive income:Profit for the <strong>year</strong> 39’781 39’781 39’781Other comprehensive expenses, net of tax –36’059 –9’046 –45’105 –45’105Total comprehensive income/(expenses) –36’059 –9’046 39’781 –5’324 –5’324Transactions with owners of <strong>Nobel</strong> <strong>Biocare</strong>:Acquisition of treasury shares 8 –5’056 –5’056Expiry of call options on own shares –22’720 22’720 –Allocation of shares to share plan participants –301 1’054 –753 –753 –Convertible bond – equity component –17’069 17’069 17’069 –Share-based payment expenses, net of tax 10 4’911 4’911 4’911Dividends to owners of <strong>Nobel</strong> <strong>Biocare</strong> relating to 2010 –33’016 –33’016 –33’016Total transactions with owners of <strong>Nobel</strong> <strong>Biocare</strong> –40’090 18’718 –11’789 –11’789 –33’161Balance as of 31 December 2011 31’861 111’023 –21’498 –159’340 –6’226 325’684 160’118 281’504Balance as of 1 January <strong>2012</strong> 31’861 111’023 –21’498 –159’340 –6’226 325’684 160’118 281’504Comprehensive income:Profit for the <strong>year</strong> 45’849 45’849 45’849Other comprehensive income, net of tax –110 4’789 – 4’679 4’679Total comprehensive income/(expenses) –110 4’789 45’849 50’528 50’528Transactions with owners of <strong>Nobel</strong> <strong>Biocare</strong>:Sale of treasury shares 8 –1’792 3’960 2’168Allocation of shares to share plan participants –684 1’353 –669 –669 –Share-based payment expenses 10 6’117 6’117 6’117Dividends to owners of <strong>Nobel</strong> <strong>Biocare</strong> relating to 2011 9 –15’269 –15’269 –15’269Total transactions with owners of <strong>Nobel</strong> <strong>Biocare</strong> –2’476 5’313 –9’821 –9’821 –6’984Balance as of 31 December <strong>2012</strong> 31’861 108’547 –16’185 –159’450 –1’437 361’712 200’825 325’048<strong>Full</strong> <strong>year</strong> <strong>report</strong> <strong>2012</strong>14/21
Cash flow statementin EUR ‘000 Note Q4 <strong>2012</strong> FY <strong>2012</strong> FY 2011Profit before tax 13’787 60’995 55’469Adjusted for:Depreciation, amortization and impairment losses 7’612 32’033 32’451Net financial result 7 532 7’691 16’657Share-based payment expenses 10 1’066 6’117 4’911Other non-cash (income)/expenses 2’050 453 –3’896Changes in working capital and provisions:Decrease in trade and other current receivables 4’680 11’607 25’144(Increase)/decrease in inventories –1’196 2’966 –203Increase/(decrease) in trade and other current liabilities 6’675 3’240 –7’772Increase/(decrease) in provisions, accrued expenses and deferred income 2’530 –2’859 3’000Income taxes paid –1’222 –19’285 –32’655Net cash from operating activities 36’514 102’958 93’106Purchases of property, plant and equipment –2’126 –7’576 –16’987Purchases of intangible assets –865 –2’834 –1’367Interest received 676 1’196 2’083Other investing and hedging activities –5’546 2’911 –30’528Net cash used in investing activities –7’861 –6’303 –46’799Acquisition of treasury shares 8 – – –5’056Proceeds from sale of treasury shares 8 – 2’168 –Proceeds from current interest-bearing loans and borrowings 7 – 30’000 36’928Repayment of current interest-bearing loans and borrowings 7 – –66’928 –262’812Proceeds from non-current interest-bearing loans and borrowings 7 – – 95’775Hedging of interest-bearing loans and borrowings – – –4’412Interest paid –4’943 –7’053 –5’829Dividends paid 9 – –15’269 –33’016Net cash used in financing activities –4’943 –57’082 –178’422Increase/(decrease) in cash and cash equivalents 23’710 39’573 –132’115Cash and cash equivalents at beginning of period 124’200 107’456 239’519Effect of exchange rate differences on cash held –1’339 –458 52Cash and cash equivalents at end of period 1 146’571 146’571 107’4561 As of 31 December <strong>2012</strong>, the Group held no restricted cash (31 December 2011: EUR 7’122 k).<strong>Full</strong> <strong>year</strong> <strong>report</strong> <strong>2012</strong>15/21
Notes to the condensed consolidated financial statementsNote 1 Organization<strong>Nobel</strong> <strong>Biocare</strong> Holding AG (the Company) is a limited liability company incorporated and domiciled inSwitzerland. The condensed consolidated financial statements of <strong>Nobel</strong> <strong>Biocare</strong> for the <strong>year</strong> ended31 December <strong>2012</strong> comprise the Company and its subsidiaries (the Group).<strong>Nobel</strong> <strong>Biocare</strong> is a highly focused and specialized leader in the market of implant-based dentalrestorations. The Group’s broad portfolio includes dental implant systems for all indications, acomprehensive range of high-precision individualized prosthetics, CAD/CAM systems, diagnostics,treatment planning and guided surgery solutions. <strong>Nobel</strong> <strong>Biocare</strong> supports its customers through allphases of professional development, offering world-class training and education as well as a range ofpractice support and patient information materials. <strong>Nobel</strong> <strong>Biocare</strong> is headquartered in Zurich,Switzerland.The condensed consolidated financial statements of <strong>Nobel</strong> <strong>Biocare</strong> Group were authorized for issue bythe Board of Directors of <strong>Nobel</strong> <strong>Biocare</strong> Holding AG on 18 February 2013.Note 2 Statement of complianceThe Group applies International Financial Reporting Standards (IFRS). The condensed consolidatedfinancial statements have been prepared in accordance with the requirements of IAS 34 Interim FinancialReporting and should be read in conjunction with the audited consolidated financial statements for the<strong>year</strong> ended 31 December <strong>2012</strong>.Note 3 Accounting policiesThe accounting policies are the same as those applied in the consolidated financial statements for the<strong>year</strong> ended 31 December <strong>2012</strong>.Note 4 Basis of preparationThe condensed consolidated financial statements include all the subsidiaries controlled by <strong>Nobel</strong> <strong>Biocare</strong>and are presented in euro (EUR), rounded to thousands.The preparation of interim financial statements requires management to make judgments, estimates andassumptions that affect the application of policies and <strong>report</strong>ed amounts of assets and liabilities, incomeand expenses, as well as the disclosure of contingent liabilities. Actual results may differ from theseestimates. Critical judgments made by management in the application of IFRS and key sources ofestimation uncertainties were the same as those applied to the consolidated financial statements for the<strong>year</strong> ended 31 December <strong>2012</strong>.Note 5 SeasonalityThe Group is not exposed to material seasonal fluctuations in its operations.Note 6 Operating segmentsOperating segments are determined based on the <strong>report</strong>s reviewed by the Board of Directors that areused to track performance, make strategic decisions and allocate resources to the segments.<strong>Full</strong> <strong>year</strong> <strong>report</strong> <strong>2012</strong>16/21
Operating segments are identified geographically as the business is managed on a global basis and isrun in three geographical areas. The business contribution is derived from sales, the cost of goodspurchased from manufacturing sites and expenses related to the sale of products in the respectiveregions. Certain administrative expenses directly attributable to the sale of products are also allocated tothe three geographic regions. The Board of Directors reviews and assesses the business (i.e. sales andbusiness expenses) on this basis.Revenue arises from two integrated product groups, Implant system products and Individualizedproducts. These products are sold in all operating segments, often with both Implant system andIndividualized products forming part of a combined offer as <strong>Nobel</strong> <strong>Biocare</strong> is a full-solution provider.in EUR ‘000 Europe, Middle East Americas Asia/Pacific Total Groupand Africa (EMEA)FY <strong>2012</strong> FY 2011 1 FY <strong>2012</strong> FY 2011 1 FY <strong>2012</strong> FY 2011 FY <strong>2012</strong> FY 2011External sales 230’140 236’942 228’441 208’641 121’904 123’596 580’485 569’179Share of total revenue 40% 41% 39% 37% 21% 22% 100% 100%Business expenses –141’840 –139’478 –120’805 –112’582 –65’989 –65’708 –328’634 –317’768Business contribution 88’300 97’464 107’636 96’059 55’915 57’888 251’851 251’4111 Prior <strong>year</strong> figures are reclassified to reflect changes in the management structure.Certain expenses, presented in the reconciliation, are not attributable to a particular segment and arereviewed as a whole across the Group irrespective of geographic origin. Unallocated business expensesinclude certain production costs remaining with the manufacturing sites. Functional costs compriseheadquarter and plant functions, which include global marketing, global symposia events, quality,logistics, IT, research and development, <strong>Nobel</strong>Procera development, legal and finance. Also included arereconciling and other items, e.g., adjustments and eliminations made in preparing the financialstatements. The business contribution also excludes the effects of Group-wide equity-settled sharebasedexpenses and depreciation, amortization and impairment expenses. The revenue from externalcustomers <strong>report</strong>ed to the Board of Directors is measured in a manner consistent with that in the incomestatement. There are no significant sales between the segments. No individual customer represents asignificant portion of the Group’s revenue.Reconciliationin EUR ‘000 FY <strong>2012</strong> FY 2011Business contribution 251’851 251’411Unallocated business expenses –18’150 –13’982Functional costs –126’897 –128’011Depreciation, amortization and impairment losses –32’033 –32’451Share-based payment expenses –6’117 –4’911Reconciling and other items 32 70Operating profit (EBIT) 68’686 72’126Net financial result –7’691 –16’657Profit before tax 60’995 55’469<strong>Full</strong> <strong>year</strong> <strong>report</strong> <strong>2012</strong>17/21
Note 7 Net financial resultin EUR ’000 Q4 <strong>2012</strong> Q4 2011 FY <strong>2012</strong> FY 2011Interest income 683 414 1’207 2’335Financial income 683 414 1’207 2’335Interest expenses –1’331 –2’632 –5’084 –10’029Net change in fair value of interest rate swap (cash flowhedge) reclassified from other comprehensive income –226 –241 –904 –241Other financial expenses –781 –1’009 –3’088 –4’048Finance cost –2’338 –3’882 –9’076 –14’318Net foreign exchange losses –2’484 –5’858 –5’148 28’056Net derivative instruments at fair value through profit or loss 2’834 5’505 5’769 –35’798Net change in fair value of cash flow hedges reclassifiedfrom other comprehensive income 773 –530 –443 3’068Net foreign exchange result 1 1’123 –883 178 –4’674Net financial result –532 –4’351 –7’691 –16’6571 Foreign currency gains and losses have been separated from financial income and finance cost to better reflect the nature of income and losses arising from financial instruments.Prior <strong>year</strong> figures have been reclassified accordingly.In <strong>2012</strong>, interest expenses related mainly to the CHF 120’000 k straight bond issued on 10 October2011, and to amounts that had been drawn on the EUR 330’000 k syndicated banking facility. On 6February <strong>2012</strong>, EUR 36’928 k, which had been drawn in 2011, was repaid, and a further EUR 30’000 kwas drawn and later repaid on 8 May <strong>2012</strong>. As of 31 December <strong>2012</strong>, no drawings on the syndicatedbanking facility were outstanding. In 2011, interest expenses related mainly to the CHF 385’000 kconvertible bond, which was outstanding until 8 November 2011.A forward-starting interest rate swap had been put in place to protect against interest rate changes priorto the issuance of the currently outstanding straight bond. The net change in the fair value of that hedgeis being reclassified from other comprehensive income over the term of the bond and is shown underfinance cost.Other financial expenses mainly comprise fees for the EUR 330’000 k syndicated banking facility.Net foreign exchange gains and losses arise from operating in multiple currencies, while gains andlosses on derivative instruments result from hedging such exposures. In 2011, derivative instruments atfair value through profit or loss included option premiums paid to hedge the economic risk of the risingSwiss franc against the euro in conjunction with the approaching redemption of the convertible bond. Asa result of the decision of the Swiss National Bank in September 2011 to set a minimum exchange rateof CHF 1.20 to the euro, these options lost their value resulting in a loss of EUR 11’648 k. This amountwas included within the cash flow statement under “other investing and hedging activities” along withrollover effects on derivatives.Note 8 EquityShare capitalThe share capital of <strong>Nobel</strong> <strong>Biocare</strong> Holding AG is held in Swiss franc (CHF). The number of issued sharesby <strong>Nobel</strong> <strong>Biocare</strong> Holding AG on 31 December <strong>2012</strong> totaled 123’784’530 (2011: 123’784’530) with a parvalue of CHF 0.40 per share, fully paid up.<strong>Full</strong> <strong>year</strong> <strong>report</strong> <strong>2012</strong>18/21
The share capital may be increased by issuing no more than 247’620 shares (2011: 247’620), each with apar value of CHF 0.40, to be fully paid up, equaling an amount of no more than CHF 99’048(2011: CHF 99’048) by virtue of the exercise of options granted to employees and officers of the Group.In addition, the share capital may be increased by an amount of up to CHF 10 million by issuing up to25 million fully paid-up registered shares with a nominal value of CHF 0.40 following the exercise ofconversion and/or option rights which are granted in connection with the issuance of bonds or similardebt instruments by the Company or one of its Group companies in capital markets or in connectionwith a transaction.The holders of registered shares are entitled to receive dividends as declared from time to time and areentitled to one vote per share at meetings of the Company. All shares rank equally with regard to theCompany‘s residual assets.On 14 March <strong>2012</strong>, the Group sold 240’000 treasury shares that had been held to cover its exposurefrom the performance share unit plan for consideration of EUR 2’168 k, and on 2 July <strong>2012</strong>, 81’981treasury shares were granted to share plan participants as described in note 10. On 16 March 2011, theGroup acquired in total 360’754 treasury shares to cover its existing exposure from the performanceshare unit plan for consideration of EUR 5’056 k.Note 9 DividendsOn 29 March <strong>2012</strong>, the AGM approved a dividend of CHF 0.15 per registered share to be paid out ofreserves without deduction of withholding tax. The dividend was paid to shareholders on 5 April <strong>2012</strong>out of reserves without deduction of withholding tax. The total amount of the dividend paid wasCHF 18.4 million or EUR 15.3 million.On 18 February 2013, the Company’s Board of Directors decided to propose to the AGM a dividend toshareholders of CHF 0.20 per registered share to be paid out of reserves without deduction ofwithholding tax. The total amount of the proposed dividend is CHF 24.6 million or approximatelyEUR 20 million depending on exchange rates at the pay-out date.Note 10 Share-based payment transactionsPerformance share unit program (PSUP)This long-term incentive plan covers executives of operating units and the headquarters with a single,global program. Participants are granted performance-based share units (PSUs) under the PSUP. Vestingof these shares is subject to specific performance achievements over a graded three-<strong>year</strong> period whereone-third of the share units vests after one <strong>year</strong>, one-third after two <strong>year</strong>s and one-third after three <strong>year</strong>s.The PSUP is accounted for as an equity-settled share-based payment plan under IFRS 2.Vesting is subject to a service period and to the achievement of a predefined performance of the <strong>Nobel</strong><strong>Biocare</strong> (NOBN) share price relative to the Swiss Market Index (SMI) or the Swiss Leader Index (SLI) forthe period. If this relative performance is achieved, each share unit will be converted into a predeterminedamount of <strong>Nobel</strong> <strong>Biocare</strong> shares at the vesting date. The performance share units cannot besettled in cash.<strong>Full</strong> <strong>year</strong> <strong>report</strong> <strong>2012</strong>19/21
The fair value of services received in return for performance share units granted is measured byreference to the fair value of units granted. Grant date fair value per unit was measured based on aMonte Carlo simulation. Market conditions are taken into account when estimating the fair value of theinstruments granted. Service conditions are not taken into account for the grant date fair valuemeasurement of the services received.As of 28 February <strong>2012</strong>, a total of 581’847 performance share units <strong>2012</strong> with similar terms andconditions as the 2011 program were granted to the plan participants.Share planA separate share-based payment plan was established for members of the Board of Directors in 2008 asthey do not participate in the PSUP. On 2 July <strong>2012</strong>, share plan participants were granted 81’981 shares(2011: 56’880 shares) of <strong>Nobel</strong> <strong>Biocare</strong> Holding AG for no consideration. A five-<strong>year</strong> transfer restrictionapplies for the share plans <strong>2012</strong> and 2011.in EUR ’000 Q4 <strong>2012</strong> Q4 2011 FY <strong>2012</strong> FY 2011PlanPerformance share unit plan 1’066 701 5’448 4’158Share plan – 44 669 753Total 1’066 745 6’117 4’911Note 11 Ongoing disputesLitigation / Legal proceedingsAt the beginning of July 2005, a lawsuit against <strong>Nobel</strong> <strong>Biocare</strong> claiming patent infringement was filed bya doctor in New York. The suit concerns two patents, which the doctor alleges are infringed by theStargrip and Replace products. The suit was put on hold by the court pending reexaminationproceedings at the US Patent Office regarding one of the patents. Those proceedings are complete, andthe Court reinstated the litigation in May 2009. <strong>Nobel</strong> <strong>Biocare</strong> has evaluated these patents in depth andhas numerous defenses that it will vigorously pursue. <strong>Nobel</strong> <strong>Biocare</strong> contends that it does not infringethese patents, and that the patent claims are invalid based on prior art. No date for a court hearing hasbeen set yet.<strong>Nobel</strong> <strong>Biocare</strong> was facing claims by an asset management company, which is currently in liquidation dueto lack of corporate structure. In Curaçao, the final decision of the Court of Appeals rejected all claims ofthe asset management company against <strong>Nobel</strong>. Consequently, all assets of <strong>Nobel</strong> <strong>Biocare</strong> underattachment since 2008 were unblocked. In the US, the July <strong>2012</strong> decision of the United States Court ofAppeals for the Second Circuit in favor of <strong>Nobel</strong> <strong>Biocare</strong> rejecting all requests of the asset managementcompany became final. <strong>Nobel</strong> <strong>Biocare</strong> will consider whether to file for sanctions against the assetmanagement company. <strong>Nobel</strong> <strong>Biocare</strong> has filed a court case in Switzerland to establish inter alia forrefund of certain unjustified fees paid. The first instance decision of the court in Zug in February <strong>2012</strong>granted all of <strong>Nobel</strong> <strong>Biocare</strong>’s claims, against which the asset management company has filed appeal. InJanuary 2013, the liquidator of the asset management company in Zug, Switzerland, indicated that hewould not continue the court proceedings in the Court of Appeals case against the first instance decisiongranting <strong>Nobel</strong> <strong>Biocare</strong>’s requests.<strong>Full</strong> <strong>year</strong> <strong>report</strong> <strong>2012</strong>20/21
In June 2010, a Canadian company filed a complaint against BioCad Medical Inc. suing for patentinfringement in the Federal Court of Québec, Canada. The lawsuit alleges that BioCad infringes aCanadian patent owned by said Canadian company on the production of superstructures for dentalimplants. BioCad Medical Inc. and its consulting patent lawyers are of the opinion that no valid claims ofthe Canadian company’s patent are being infringed and will, therefore, vigorously defend the patentinfringement suit. In addition, <strong>Nobel</strong> <strong>Biocare</strong> had filed for invalidation of the respective German patent ofthe Canadian company with the German Federal Patent Court and for declaratory judgment with thecompetent court in Milan, Italy, that neither the respective Italian nor the German patent of said companyare infringed. In September <strong>2012</strong>, the German Federal Patent Court invalidated all claims of the Canadiancompany’s German patent, a decision against which the Canadian company announced it would appeal.The main hearing of the court in Milan on the question of its international competence is scheduled forearly 2013. In June <strong>2012</strong> <strong>Nobel</strong> <strong>Biocare</strong>’s US entities received a notice of infringement letter concerningfive US patents of the Canadian company alleging <strong>Nobel</strong>’s surgical guides and implant bar overdenturesare infringing. The US <strong>Nobel</strong> entities filed a Declaratory Judgment action in July <strong>2012</strong> in Federal DistrictCourt Eastern District of Virginia asking the court to declare that <strong>Nobel</strong> does not infringe the patentsand/or that they are invalid. In January 2013, the court granted <strong>Nobel</strong>’s summary judgment motionsagainst the Canadian company, declaring that the US <strong>Nobel</strong> entities do not infringe the company’spatents. Judgment in favor of <strong>Nobel</strong> was entered and the case was dismissed with prejudice.In July 2010, a Californian dentist filed a class action suit in the Federal Court of Los Angeles (USA)against <strong>Nobel</strong> <strong>Biocare</strong> USA LLC, <strong>Nobel</strong> <strong>Biocare</strong> AB and <strong>Nobel</strong> <strong>Biocare</strong> Holding AG alleging productdefects of <strong>Nobel</strong>Direct implants and claiming damages. In August 2011, the United States District Courtfor the Central District of California in Los Angeles granted the dentist’s motion, holding that therequirements for a class certification had been met. The certified class includes all individuals in theUnited States who have purchased any <strong>Nobel</strong>Direct dental implants other than “<strong>Nobel</strong>Direct Groovy”.<strong>Nobel</strong> <strong>Biocare</strong> filed for motions for summary judgment and for reconsideration. In August <strong>2012</strong>, theFederal Court narrowed down the class certification to claims under California Unfair Competition Law,thus considerably reducing the value of the claims at stake and limiting the remedy to restitution (i.e.,either replacement or refund of the implant). In December <strong>2012</strong>, the parties concluded a settlementagreement while compensation of attorney’s costs on the plaintiff’s side to be negotiated or determinedby the court.There are other minor disputes pending regarding contractual obligations, including warranty- and laborrelateddisputes, arising from the ordinary business of <strong>Nobel</strong> <strong>Biocare</strong> and its subsidiaries.Note 12 Subsequent eventsThere have been no material events between 31 December <strong>2012</strong> and the date of authorization thatwould require adjustments to the consolidated financial statements or disclosures.<strong>Full</strong> <strong>year</strong> <strong>report</strong> <strong>2012</strong>21/21