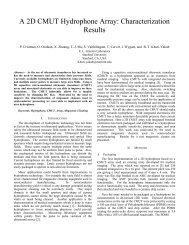
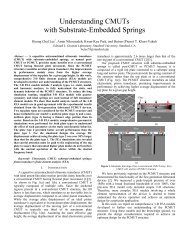
K.K. Park et al. / Sensors and Actuators B 160 (2011) 1120–1127 1123of a 50 nm polymer film on the quality factor and the resonant frequencyof the device is negligible b<strong>as</strong>ed on the input impedanceme<strong>as</strong>urement. The parallel resonant frequency slightly is incre<strong>as</strong>edby 0.64% while the quality factor is decre<strong>as</strong>ed by 7 after the polymerdeposition.Compared to the spin coating method, the inkjet-dispensingmethod tends to have less uni<strong>for</strong>mity across the active area. However,the inkjet-dispensing method can selectively pattern are<strong>as</strong>of interest, e.g., top side of <strong>CMUT</strong> plates of a single device, andcoat different polymers on multiple devices in a single die <strong>for</strong> arrayimplementation [11].2.5. Detection systemFig. 4. Photograph of inkjet polymer coating. Cylinder on the top of the picture ismicro-capillary used <strong>as</strong> droplet ejection. In this photograph, the solvent containinga polymer on the center element is not dried yet.that of parallel resonant frequency (140) due to the resonator-toresonatornon-uni<strong>for</strong>mity. To avoid low Q at the series resonantfrequency, the oscillator circuit is designed to oscillate at the parallelresonant frequency.2.4. Chemical functionalizationThe resonators must be functionalized with a sorbent film toabsorb analytes in air. This sorbent film should have high sensitivityand good selectivity to the analyte of interest. Among several commerciallyavailable polymers such <strong>as</strong> polyallylamine hydrochloride(PAAM), polyethylene glycol (PEG), and polyvinyl alcohol (PVA), weselected polyisobutylene (PIB) <strong>as</strong> the sorbent film to detect <strong>DMMP</strong>because of its availability and higher sensitivity to <strong>DMMP</strong> [20].Diluted droplets of PIB (in toluene, 1 mg/ml), each with avolume of 0.2 nl, were ejected on the 18 MHz device using aninkjet-dispensing system (model MD-P-801, Microdrop, Norderstedt,Germany) [21]. The ejected droplets con<strong>for</strong>mally coated thesurface of the <strong>CMUT</strong> (Fig. 4). Then the solvent evaporated in a fewseconds leaving a thin layer of polymer. It is challenging to me<strong>as</strong>urethe thickness of this polymer film using optical methods becausethe coated film is thin and optically transparent; only a particlepattern (Fig. 5) indicates the edge of the polymer coating. Thus,using atomic <strong>for</strong>ce microscope (AFM), operated in tapping mode,we me<strong>as</strong>ured the thickness of the polymer to be 50 nm. The effectFig. 5. Optical picture of a <strong>CMUT</strong> after functionalization. Small dotted line representsthe edge of the polymer coating.An accurate me<strong>as</strong>urement of the resonant frequency is an essentialpart of a highly sensitive <strong>sensor</strong> system; lower frequencynoise will result in lower limit of <strong>detection</strong> level of the system.The resonant frequency can be determined through the electricalinput impedance me<strong>as</strong>urement. However, this method suffersfrom limited frequency-sweep resolution and slow response time.There<strong>for</strong>e, we designed a low noise oscillator circuit that tracks theresonant frequency of the device. This method allows <strong>for</strong> accuratereal-time me<strong>as</strong>urements using a digital frequency counter connectedto the output of the oscillator circuit.2.5.1. Oscillator circuit designThe oscillator circuit is composed of the <strong>CMUT</strong> <strong>as</strong> well <strong>as</strong> otherdiscrete circuit components. For an optimal design, the circuit couldbe simulated and optimized in design steps. During these steps,the me<strong>as</strong>ured input impedance (Fig. 3a) could be modeled in anappropriate <strong>for</strong>mat and incorporated in the circuit simulation. Inthis work, we modeled the input impedance of the device <strong>as</strong> a6-elements circuit model <strong>as</strong> shown in Fig. 3b. The model consistsof the conventional 4-element RLC model (Rx, Lx, Cx, and Co) andadditional two elements, Cc, and Rc. The 4-element RLC model isknown <strong>as</strong> Butterworth Van Dyke model and commonly used <strong>as</strong> anequivalent circuit model <strong>for</strong> MEMS resonators. The additional twoelements (i.e. Cc and Rc) represent the contact capacitance and thecontact resistance to the substrate. The values of six elements wereextracted from the me<strong>as</strong>ured input impedance b<strong>as</strong>ed on a le<strong>as</strong>tsquares fitting method (Fig. 3a).Compared to other MEMS resonators and quartz-b<strong>as</strong>ed resonators,<strong>CMUT</strong> resonators have two characteristics that govern theoscillator design. First, the <strong>CMUT</strong> is a one-port resonator, i.e., it h<strong>as</strong>two electrical pads, a signal pad and a ground pad. This configurationgives more limitation of the topology of the oscillation circuit,compared to other two-port MEMS resonators [22,23]. Second, allthe resonator units (elements) share the substrate <strong>as</strong> a commonground. There<strong>for</strong>e the oscillator circuit, which is required to becompatible with the multi-channel oscillator, can access only oneelectrode of the <strong>CMUT</strong>, and leave the other electrode connectedto ground. L<strong>as</strong>t, <strong>as</strong> previously mentioned, the quality factor of theparallel resonant frequency of the <strong>CMUT</strong> is higher than that of theseries resonant frequency. The circuit is designed to oscillate at theparallel resonant frequency to take advantage of higher Q.B<strong>as</strong>ed on the above criteria, an oscillator circuit w<strong>as</strong> designedand implemented (Fig. 6). The <strong>CMUT</strong> resonator w<strong>as</strong> interfaced tothe circuit through a voltage divider. The value of the capacitor inthis stage w<strong>as</strong> chosen to optimize the tradeoff between in-circuitQ and the gain of the voltage divider. The gain stage and band-p<strong>as</strong>sfilter were implemented using low noise op-amps (AD8045 andOPA657) to satisfy the Barkhausen criteria. The implemented circuitrequires only two op-amps inside the oscillation loop, with atotal power consumption of 80 mW. The loop gain is sufficientlylarger than unity around the resonant frequency to start the oscillationfrom in-circuit noise components, and thus the system does
1124 K.K. Park et al. / Sensors and Actuators B 160 (2011) 1120–1127Fig. 6. (a) Schematic of the oscillator circuit including a <strong>CMUT</strong>. (b) Optical picture of a populated oscillator circuit on PCB.not require an additional start-up circuit. The <strong>CMUT</strong> is directlymounted on a printed circuit board (PCB) without a chip-carrierand wire-bonded on the PCB to reduce par<strong>as</strong>itic capacitance.2.5.2. Per<strong>for</strong>mance of the oscillatorThe free running oscillation frequency of the circuit w<strong>as</strong> me<strong>as</strong>uredusing an external digital frequency counter (Model SRS620,Stan<strong>for</strong>d Research System, Sunnyvale, CA) with a typical gate timeof 10 ms, i.e., 100 frequency samples per a second. Frequency in<strong>for</strong>mationis transferred to an external PC <strong>for</strong> signal processing. Thetime delay between the counter and the PC is less than 100 ms,which is short enough <strong>for</strong> a real-time me<strong>as</strong>urement of the frequencyshift due <strong>chemical</strong> absorption.The amount of frequency shift is proportional to the amount of<strong>chemical</strong> absorption. As a result, the limit of <strong>detection</strong> of the outputsignal, i.e., frequency noise level, decides the limit of <strong>detection</strong>of analyte concentration in air. In order to quantify the frequencynoise level, we used the Allan deviation method [24], which is acommon method to me<strong>as</strong>ure the short-term frequency stabilityof timing references. The Allan deviation number, y (n 0 ,M), <strong>for</strong>a given gate time, n 0 , is√√ y (n 0 , M) =√ 12n 2 (M − 2n + 1)∑M−2n j+n−1( ¯f i+n − ¯f i ) 2 , (4)j=0∑where 0 is the gate time of the frequency me<strong>as</strong>urement, M is totalnumber of samples and ¯f i is the averaged frequency of n-samples.This method averages neighboring frequency samples to computedeviation at a given averaging time, n 0 , (i.e., effective gate time). Ina short averaging time, the Allan deviation tends to decre<strong>as</strong>e withmore averaging time. However, the Allan deviation incre<strong>as</strong>es whenthe averaging time is larger than a certain value, because the driftof the resonant frequency (i.e., mid-term frequency noise) startsto dominate the frequency variation. We me<strong>as</strong>ured a large numberof finely spaced frequency samples and computed the Allandeviation <strong>for</strong> various averaging times to find the optimal averagingtime (Fig. 7). The oscillator h<strong>as</strong> the lowest Allan deviation( y /f) of 2.74 × 10 −8 at 50 ms averaging time, which correspondsto a frequency noise level of 0.5 Hz. B<strong>as</strong>ed on Eq. (3), the <strong>sensor</strong>’sminimum <strong>detection</strong> limit of loaded m<strong>as</strong>s per unit area ( min /A) is1.92 × 10 −11 kg/m 2 or 0.192 ag/m 2 with 3- confidence levels.i=jand bubblers [11,25]. Purified air from a zero air generator (Model76-803, Balston Parker, Haverhill, MA) w<strong>as</strong> used to provide flowthrough two MFCs. These two MFCs separately control the flow rateof the carrier air and flow rate of the air injected into a bubbler. Inthe bubbler, the air flows through a liquid-ph<strong>as</strong>e analyte, resultingin evaporation of the analyte into the air. The air containinganalyte molecules is then mixed with the carrier air. This mixtureg<strong>as</strong> is transferred into a 3 cm 3 gl<strong>as</strong>s chamber, which encloses thepolymer-coated <strong>CMUT</strong> resonator.The typical flow rates of the bubbler air is 1–10 ml/min and theflow rate of diluted air is adjusted in 499–490 ml/min to regulatethe total flow rate to 500 ml/min. The volume concentration of ananalyte is calculated b<strong>as</strong>ed on three parameters: the flow rate of theair through the bubbler, flow rate of the carrier air and the vaporpressure of each analyte, <strong>as</strong>suming the output of the bubbler is fullysaturated with the analyte.3. Results3.1. Sensitivity and limit of <strong>detection</strong>We chose <strong>DMMP</strong> <strong>as</strong> our main analyte and ethanol and water<strong>as</strong> reference analytes. Fig. 8 shows transient responses of the frequencyto different concentrations of three different analytes. Foreach me<strong>as</strong>urement, the analyte molecules were injected into thechamber at 60 s by flowing air through the bubbler containing<strong>DMMP</strong>. The PIB coating absorbs the analyte molecules until itreaches an equilibrium condition <strong>for</strong> the given analyte concentration.The m<strong>as</strong>s of the absorbed molecules shifts the resonant2.6. Experimental setupThe volume sensitivity is me<strong>as</strong>ured using an in-house <strong>chemical</strong>set-up that can deliver low vapor concentrations of <strong>DMMP</strong>. Theexperimental setup consists of several m<strong>as</strong>s flow controllers (MFC)Fig. 7. Allan deviation y of the oscillator circuit in Fig. 6(b).