A GIS Based Water Balance Study of Africa - Physical Land Resources
A GIS Based Water Balance Study of Africa - Physical Land Resources
A GIS Based Water Balance Study of Africa - Physical Land Resources
Create successful ePaper yourself
Turn your PDF publications into a flip-book with our unique Google optimized e-Paper software.
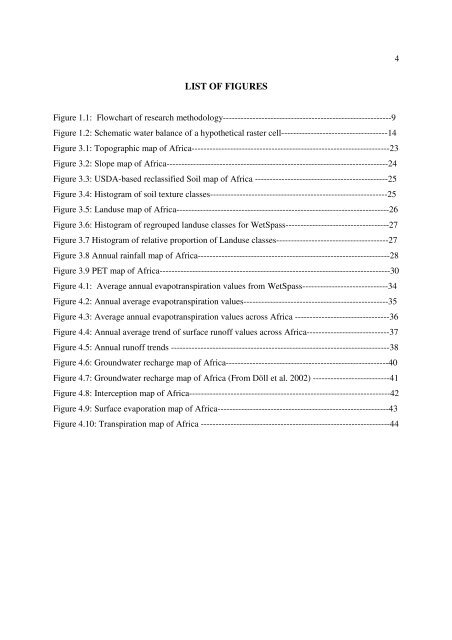
4LIST OF FIGURESFigure 1.1: Flowchart <strong>of</strong> research methodology---------------------------------------------------------9Figure 1.2: Schematic water balance <strong>of</strong> a hypothetical raster cell------------------------------------14Figure 3.1: Topographic map <strong>of</strong> <strong>Africa</strong>-------------------------------------------------------------------23Figure 3.2: Slope map <strong>of</strong> <strong>Africa</strong>---------------------------------------------------------------------------24Figure 3.3: USDA-based reclassified Soil map <strong>of</strong> <strong>Africa</strong> ---------------------------------------------25Figure 3.4: Histogram <strong>of</strong> soil texture classes------------------------------------------------------------25Figure 3.5: <strong>Land</strong>use map <strong>of</strong> <strong>Africa</strong>------------------------------------------------------------------------26Figure 3.6: Histogram <strong>of</strong> regrouped landuse classes for WetSpass-----------------------------------27Figure 3.7 Histogram <strong>of</strong> relative proportion <strong>of</strong> <strong>Land</strong>use classes--------------------------------------27Figure 3.8 Annual rainfall map <strong>of</strong> <strong>Africa</strong>-----------------------------------------------------------------28Figure 3.9 PET map <strong>of</strong> <strong>Africa</strong>------------------------------------------------------------------------------30Figure 4.1: Average annual evapotranspiration values from WetSpass-----------------------------34Figure 4.2: Annual average evapotranspiration values-------------------------------------------------35Figure 4.3: Average annual evapotranspiration values across <strong>Africa</strong> --------------------------------36Figure 4.4: Annual average trend <strong>of</strong> surface run<strong>of</strong>f values across <strong>Africa</strong>----------------------------37Figure 4.5: Annual run<strong>of</strong>f trends --------------------------------------------------------------------------38Figure 4.6: Groundwater recharge map <strong>of</strong> <strong>Africa</strong>-------------------------------------------------------40Figure 4.7: Groundwater recharge map <strong>of</strong> <strong>Africa</strong> (From Döll et al. 2002) --------------------------41Figure 4.8: Interception map <strong>of</strong> <strong>Africa</strong>--------------------------------------------------------------------42Figure 4.9: Surface evaporation map <strong>of</strong> <strong>Africa</strong>----------------------------------------------------------43Figure 4.10: Transpiration map <strong>of</strong> <strong>Africa</strong> ----------------------------------------------------------------44


