RealView Debugger User Guide - ARM Information Center
RealView Debugger User Guide - ARM Information Center
RealView Debugger User Guide - ARM Information Center

Create successful ePaper yourself
Turn your PDF publications into a flip-book with our unique Google optimized e-Paper software.
®<strong>RealView</strong><strong>Debugger</strong>Version 1.8<strong>User</strong> <strong>Guide</strong>Copyright © 2002-2005 <strong>ARM</strong> Limited. All rights reserved.<strong>ARM</strong> DUI 0153G
<strong>RealView</strong> <strong>Debugger</strong><strong>User</strong> <strong>Guide</strong>Copyright © 2002-2005 <strong>ARM</strong> Limited. All rights reserved.Release <strong>Information</strong>The following changes have been made to this document.Change HistoryDate Issue ChangeApril 2002 A <strong>RealView</strong> <strong>Debugger</strong> v1.5 releaseSeptember 2002 B <strong>RealView</strong> <strong>Debugger</strong> v1.6 releaseFebruary 2003 C <strong>RealView</strong> <strong>Debugger</strong> v1.6.1 releaseSeptember 2003 D <strong>RealView</strong> <strong>Debugger</strong> v1.6.1 release for RVDS v2.0January 2004 E <strong>RealView</strong> <strong>Debugger</strong> v1.7 release for RVDS v2.1December 2004 F <strong>RealView</strong> <strong>Debugger</strong> v1.8 release for RVDS v2.2May 2005 G <strong>RealView</strong> <strong>Debugger</strong> v1.8 SP1 release for RVDS v2.2 SP1Proprietary NoticeWords and logos marked with ® or are registered trademarks or trademarks owned by <strong>ARM</strong> Limited. Otherbrands and names mentioned herein may be the trademarks of their respective owners.Neither the whole nor any part of the information contained in, or the product described in, this documentmay be adapted or reproduced in any material form except with the prior written permission of the copyrightholder.The product described in this document is subject to continuous developments and improvements. Allparticulars of the product and its use contained in this document are given by <strong>ARM</strong> in good faith. However,all warranties implied or expressed, including but not limited to implied warranties of merchantability, orfitness for purpose, are excluded.This document is intended only to assist the reader in the use of the product. <strong>ARM</strong> Limited shall not be liablefor any loss or damage arising from the use of any information in this document, or any error or omission insuch information, or any incorrect use of the product.Confidentiality StatusThis document is Non-Confidential. The right to use, copy and disclose this document may be subject tolicense restrictions in accordance with the terms of the agreement entered into by <strong>ARM</strong> and the party that<strong>ARM</strong> delivered this document to.Product StatusThe information in this document is final, that is for a developed product.ii Copyright © 2002-2005 <strong>ARM</strong> Limited. All rights reserved. <strong>ARM</strong> DUI 0153G
Web Addresshttp://www.arm.com<strong>ARM</strong> DUI 0153G Copyright © 2002-2005 <strong>ARM</strong> Limited. All rights reserved. iii
iv Copyright © 2002-2005 <strong>ARM</strong> Limited. All rights reserved. <strong>ARM</strong> DUI 0153G
Contents<strong>RealView</strong> <strong>Debugger</strong> <strong>User</strong> <strong>Guide</strong>PrefaceAbout this book .............................................................................................. xFeedback ...................................................................................................... xvChapter 1Chapter 2Chapter 3Starting to use <strong>RealView</strong> <strong>Debugger</strong>1.1 Starting <strong>RealView</strong> <strong>Debugger</strong> ....................................................................... 1-21.2 Using <strong>RealView</strong> Connection Broker ............................................................ 1-81.3 <strong>RealView</strong> <strong>Debugger</strong> directories ................................................................. 1-11Working with Images2.1 Loading images ........................................................................................... 2-22.2 Managing images ........................................................................................ 2-92.3 Working with symbols ............................................................................... 2-192.4 Working with multiple images .................................................................... 2-202.5 Unloading and reloading images .............................................................. 2-22Controlling Execution3.1 Submitting commands ................................................................................ 3-23.2 Defining execution context .......................................................................... 3-33.3 Using execution controls ............................................................................. 3-73.4 Working with the Debug menu .................................................................. 3-113.5 Automating debugging operations ............................................................ 3-15<strong>ARM</strong> DUI 0153G Copyright © 2002-2005 <strong>ARM</strong> Limited. All rights reserved. v
Contents3.6 Searching for source files ......................................................................... 3-19Chapter 4Chapter 5Chapter 6Chapter 7Chapter 8Working with Breakpoints4.1 Breakpoints in <strong>RealView</strong> <strong>Debugger</strong> ............................................................ 4-24.2 Setting default breakpoints ....................................................................... 4-154.3 Generic breakpoint operations ................................................................. 4-204.4 Setting unconditional breakpoints explicitly .............................................. 4-214.5 Setting hardware breakpoints explicitly .................................................... 4-244.6 Specifying processor exceptions (global breakpoints) ............................. 4-334.7 Setting conditional breakpoints ................................................................. 4-344.8 Using the Set Address/Data Breakpoint dialog box .................................. 4-414.9 Attaching macros to breakpoints .............................................................. 4-564.10 Controlling the behavior of breakpoints .................................................... 4-594.11 Using the Break/Tracepoints pane ........................................................... 4-634.12 Disabling and clearing breakpoints ........................................................... 4-724.13 Setting breakpoints from saved lists ......................................................... 4-74Memory Mapping5.1 About memory mapping ............................................................................. 5-25.2 Enabling and disabling memory mapping ................................................... 5-45.3 Setting up a memory map .......................................................................... 5-55.4 Viewing the memory map ........................................................................... 5-75.5 Editing map entries ................................................................................... 5-125.6 Setting top_of_memory and stack values ................................................. 5-135.7 Generating linker command files for non-<strong>ARM</strong> targets ............................. 5-14Working with Debug Views6.1 Working with registers ................................................................................ 6-26.2 Working with memory ............................................................................... 6-196.3 Working with the stack .............................................................................. 6-306.4 Using the call stack ................................................................................... 6-366.5 Working with watches ............................................................................... 6-40Reading and Writing Memory, Registers, and Flash7.1 About interactive operations ....................................................................... 7-27.2 Using the Memory/Register Operations menu ........................................... 7-37.3 Accessing interactive operations in other ways .......................................... 7-47.4 Working with Flash ..................................................................................... 7-57.5 Examples of interactive operations ........................................................... 7-10Working with Browsers and Favorites8.1 Using browsers ........................................................................................... 8-28.2 Using the Data Navigator pane .................................................................. 8-58.3 Using the Symbol Browser pane .............................................................. 8-178.4 Using the Function List dialog box ............................................................ 8-198.5 Using the Variable List dialog box ............................................................ 8-21vi Copyright © 2002-2005 <strong>ARM</strong> Limited. All rights reserved. <strong>ARM</strong> DUI 0153G
Contents8.6 Using the Module/File List dialog box ....................................................... 8-238.7 Using the Register List Selection dialog box ............................................. 8-258.8 Specifying browser lists ............................................................................. 8-278.9 Using the Favorites Chooser/Editor dialog box ......................................... 8-29Chapter 9Chapter 10Appendix AAppendix BWorking with Macros9.1 About macros .............................................................................................. 9-29.2 Using macros .............................................................................................. 9-89.3 Getting more information .......................................................................... 9-17Configuring Workspace Settings10.1 Using workspaces ..................................................................................... 10-210.2 Viewing workspace settings ...................................................................... 10-910.3 Configuring workspace settings .............................................................. 10-15Workspace Settings ReferenceA.1 DEBUGGER ............................................................................................... A-2A.2 CODE .......................................................................................................... A-6A.3 ALL .............................................................................................................. A-8<strong>RealView</strong> <strong>Debugger</strong> on Sun Solaris and Red Hat LinuxB.1 About this Appendix .................................................................................... B-2B.2 Getting more information ............................................................................ B-3B.3 X-Windows configuration change required on Sun Solaris ......................... B-4B.4 Changes to target configuration details ...................................................... B-5B.5 Changes to GUI and general user information ............................................ B-7Glossary<strong>ARM</strong> DUI 0153G Copyright © 2002-2005 <strong>ARM</strong> Limited. All rights reserved. vii
Contentsviii Copyright © 2002-2005 <strong>ARM</strong> Limited. All rights reserved. <strong>ARM</strong> DUI 0153G
PrefaceThis preface introduces the <strong>RealView</strong> ® <strong>Debugger</strong> <strong>User</strong> <strong>Guide</strong> that shows you how to use<strong>RealView</strong> <strong>Debugger</strong> to debug your application programs. It contains the followingsections:• About this book on page x• Feedback on page xv.<strong>ARM</strong> DUI 0153G Copyright © 2002-2005 <strong>ARM</strong> Limited. All rights reserved. ix
PrefaceAbout this bookThis book describes how to use <strong>RealView</strong> <strong>Debugger</strong> to debug applications and images:• a detailed description of how to use <strong>RealView</strong> <strong>Debugger</strong> to debug images using arange of debug targets, including examples• a description of the built-in features of <strong>RealView</strong> <strong>Debugger</strong>, such as workspacesand macros• appendixes containing reference information for the software developer• a glossary of terms for users new to <strong>RealView</strong> <strong>Debugger</strong>.Intended audienceThis book has been written for developers who are using <strong>RealView</strong> <strong>Debugger</strong> to manage<strong>ARM</strong> ® architecture-targeted development projects. It assumes that you are anexperienced software developer, and that you are familiar with the <strong>ARM</strong> developmenttools. It does not assume that you are familiar with <strong>RealView</strong> <strong>Debugger</strong>.This book includes an appendix that contains information for developers using<strong>RealView</strong> <strong>Debugger</strong> on Sun Solaris and Red Hat Linux.Before you startIt is recommended that you read <strong>RealView</strong> <strong>Debugger</strong> v1.8 Essentials <strong>Guide</strong> beforestarting to use this book. In particular, read the chapter that describes the user desktopbecause this contains details about menus and GUI elements used in the rest of thedocumentation suite.ExamplesThe examples given in this book have all been tested and shown to work as described.Your hardware and software might not be the same as that used for testing theseexamples, so it is possible that certain addresses or values might vary slightly from thoseshown, and some of the examples might not apply to you. In these cases you might haveto modify the instructions to suit your own circumstances.The examples in this book use the sample programs and projects stored in the \Examplesdirectory in your <strong>RealView</strong> Developer Suite root installation.In general, examples use <strong>RealView</strong> <strong>ARM</strong>ulator ® ISS (RVISS) to simulate an <strong>ARM</strong>architecture-based debug target. In some cases, examples are given for other debugtarget systems.x Copyright © 2002-2005 <strong>ARM</strong> Limited. All rights reserved. <strong>ARM</strong> DUI 0153G
PrefaceUsing this bookThis book is organized into the following chapters:Chapter 1 Starting to use <strong>RealView</strong> <strong>Debugger</strong>Read this chapter for details of how to start using <strong>RealView</strong> <strong>Debugger</strong> onyour workstation.Chapter 2 Working with ImagesThis chapter contains details of how to work with application programsin <strong>RealView</strong> <strong>Debugger</strong>, including how to load an image ready fordebugging and how to view image details.Chapter 3 Controlling ExecutionRead this chapter for details of how to control program execution duringyour debugging sessions. It gives details on using the major controloptions and describes how to use files to keep a record of the debuggingsession.Chapter 4 Working with BreakpointsRead this chapter for details of how to use breakpoints to controlexecution of your application program. This chapter contains a fulldescription of breakpoint options in <strong>RealView</strong> <strong>Debugger</strong>.Chapter 5 Memory MappingThis chapter gives details of how to manage memory for single processoroperation during a debugging session. It describes the Process Controlpane that contains a dynamic display of the current memoryconfiguration.Chapter 6 Working with Debug ViewsRead this chapter for details of how to monitor execution of yourapplication program by setting watches, reading registers and trackingchanges to memory contents.Chapter 7 Reading and Writing Memory, Registers, and FlashRead this chapter for details of operations on registers contents andmemory that can be accessed dynamically during a debugging session. Inthis way, <strong>RealView</strong> <strong>Debugger</strong> enables you to have greater control overyour application software.Chapter 8 Working with Browsers and FavoritesRead this chapter for details of the browsers accessible from the Codewindow when using <strong>RealView</strong> <strong>Debugger</strong>.<strong>ARM</strong> DUI 0153G Copyright © 2002-2005 <strong>ARM</strong> Limited. All rights reserved. xi
PrefaceTypographical conventionsChapter 9 Working with MacrosRead this chapter for details of how to create macros when working with<strong>RealView</strong> <strong>Debugger</strong>.Chapter 10 Configuring Workspace Settings<strong>RealView</strong> <strong>Debugger</strong> uses a workspace to enable you to configure yourworking environment and to maintain persistence information from onesession to the next. You achieve this by using a workspace properties fileand a global configuration file. This chapter describes the contents ofthese files and how to change your settings.Appendixes and GlossaryAppendix A Workspace Settings ReferenceRead this appendix for details of how to set options toconfigure your working environment using <strong>RealView</strong><strong>Debugger</strong> workspaces. This appendix must be read inassociation with Chapter 10 Configuring Workspace Settings.Appendix B <strong>RealView</strong> <strong>Debugger</strong> on Sun Solaris and Red Hat LinuxRead this appendix for details of how to use <strong>RealView</strong><strong>Debugger</strong> on Sun Solaris and Red Hat Linux. This appendixcontains corrections and additions to the documentation suite.GlossaryAn alphabetically arranged glossary defines the special termsused in this book.The following typographical conventions are used in this book:italicboldmonospacemonospaceHighlights important notes, introduces special terminology,denotes internal cross-references, and citations.Highlights interface elements, such as menu names. Denotes<strong>ARM</strong> processor signal names. Also used for terms in descriptivelists, where appropriate.Denotes text that can be entered at the keyboard, such ascommands, file and program names, and source code.Denotes a permitted abbreviation for a command or option. Theunderlined text can be entered instead of the full command oroption name.xii Copyright © 2002-2005 <strong>ARM</strong> Limited. All rights reserved. <strong>ARM</strong> DUI 0153G
Prefacemonospace italicmonospace boldDenotes arguments to commands and functions where theargument is to be replaced by a specific value.Denotes language keywords when used outside example code.Further readingThis section lists publications from both <strong>ARM</strong> Limited and third parties that provideadditional information.<strong>ARM</strong> periodically provides updates and corrections to its documentation. Seehttp://www.arm.com for current errata, addenda, and Frequently Asked Questions.<strong>ARM</strong> publicationsThis book is part of the <strong>RealView</strong> <strong>Debugger</strong> documentation suite. Other books in thissuite include:• <strong>RealView</strong> <strong>Debugger</strong> v1.8 Essentials <strong>Guide</strong> (<strong>ARM</strong> DUI 0181)• <strong>RealView</strong> <strong>Debugger</strong> v1.8 Target Configuration <strong>Guide</strong> (<strong>ARM</strong> DUI 0182)• <strong>RealView</strong> <strong>Debugger</strong> v1.8 Command Line Reference <strong>Guide</strong> (<strong>ARM</strong> DUI 0175)• <strong>RealView</strong> <strong>Debugger</strong> v1.8 Extensions <strong>User</strong> <strong>Guide</strong> (<strong>ARM</strong> DUI 0174)• <strong>RealView</strong> <strong>Debugger</strong> v1.8 Project Management <strong>User</strong> <strong>Guide</strong> (<strong>ARM</strong> DUI 0227).For details on using the <strong>RealView</strong> Compilation Tools (RVCT), see the books in theRVCT documentation suite.For details on using RVISS, see the following documentation:• <strong>RealView</strong> <strong>ARM</strong>ulator ISS <strong>User</strong> <strong>Guide</strong> (<strong>ARM</strong> DUI 0207).For general information on software interfaces and standards supported by <strong>ARM</strong>, seeinstall_directory\Documentation\Specifications\....See the datasheet or Technical Reference Manual for information relating to yourhardware.See the following documentation for information relating to the <strong>ARM</strong> debug interfacessuitable for use with <strong>RealView</strong> <strong>Debugger</strong>:• <strong>RealView</strong> ICE <strong>User</strong> <strong>Guide</strong> (<strong>ARM</strong> DUI 0155)• Multi-ICE ® <strong>User</strong> <strong>Guide</strong> (<strong>ARM</strong> DUI 0048)• <strong>ARM</strong> MultiTrace <strong>User</strong> <strong>Guide</strong> (<strong>ARM</strong> DUI 0150).Other publicationsFor a comprehensive introduction to <strong>ARM</strong> architecture see:<strong>ARM</strong> DUI 0153G Copyright © 2002-2005 <strong>ARM</strong> Limited. All rights reserved. xiii
PrefaceSteve Furber, <strong>ARM</strong> system-on-chip architecture (2nd edition, 2000). Addison Wesley,ISBN 0-201-67519-6.For a detailed introduction to regular expressions, as used in the <strong>RealView</strong> <strong>Debugger</strong>search and pattern matching tools, see:Jeffrey E. F. Friedl, Mastering Regular Expressions, Powerful Techniques for Perl andOther Tools, 1997. O'Reilly & Associates, Inc. ISBN 1-56592-257-3.For the definitive guide to the C programming language, on which the <strong>RealView</strong><strong>Debugger</strong> macro and expression language is based, see:Brian W. Kernighan, Dennis M. Ritchie, The C Programming Language (2nd edition,1989). Prentice-Hall, ISBN 0-13-110362-8.For more information about the JTAG standard, see:IEEE Standard Test Access Port and Boundary Scan Architecture (IEEE Std. 1149.1),available from the IEEE (http://www.ieee.org).For more information about CEVA-Oak, CEVA-TeakLite, and CEVA-Teak processorsfrom CEVA, Inc. see http://www.ceva-dsp.com.For more information about the ZSP400 and ZSP500 processors from the ZSP divisionof LSI Logic see http://www.zsp.com.xiv Copyright © 2002-2005 <strong>ARM</strong> Limited. All rights reserved. <strong>ARM</strong> DUI 0153G
PrefaceFeedback<strong>ARM</strong> Limited welcomes feedback on both <strong>RealView</strong> <strong>Debugger</strong> and its documentation.Feedback on <strong>RealView</strong> <strong>Debugger</strong>If you have any problems with <strong>RealView</strong> <strong>Debugger</strong>, submit a Software Problem Report:1. Select Help → Send a Problem Report... from the <strong>RealView</strong> <strong>Debugger</strong> mainmenu.2. Complete all sections of the Software Problem Report.3. To get a rapid and useful response, give:• a small standalone sample of code that reproduces the problem, ifapplicable• a clear explanation of what you expected to happen, and what actuallyhappened• the commands you used, including any command-line options• sample output illustrating the problem.4. Email the report to your supplier.Feedback on this bookIf you have any comments on this book, send email to errata@arm.com giving:• the document title• the document number• the page number(s) to which your comments apply• a concise explanation of your comments.General suggestions for additions and improvements are welcome.<strong>ARM</strong> DUI 0153G Copyright © 2002-2005 <strong>ARM</strong> Limited. All rights reserved. xv
Prefacexvi Copyright © 2002-2005 <strong>ARM</strong> Limited. All rights reserved. <strong>ARM</strong> DUI 0153G
Chapter 1Starting to use <strong>RealView</strong> <strong>Debugger</strong>This chapter describes how to start using <strong>RealView</strong> ® <strong>Debugger</strong>. It contains the followingsections:• Starting <strong>RealView</strong> <strong>Debugger</strong> on page 1-2• Using <strong>RealView</strong> Connection Broker on page 1-8• <strong>RealView</strong> <strong>Debugger</strong> directories on page 1-11.NoteWhere <strong>RealView</strong> <strong>Debugger</strong> panes are shown in this document, they are shown asfloating panes. Floating panes show the name of the pane in the title bar. Docked panesdo not have a title bar, and so do not show the title. See the <strong>RealView</strong> <strong>Debugger</strong> v1.8Essentials <strong>Guide</strong> for more details on panes in <strong>RealView</strong> <strong>Debugger</strong>.<strong>ARM</strong> DUI 0153G Copyright © 2002-2005 <strong>ARM</strong> Limited. All rights reserved. 1-1
Starting to use <strong>RealView</strong> <strong>Debugger</strong>1.1 Starting <strong>RealView</strong> <strong>Debugger</strong>This section describes how to start the debugger. It contains the following sections:• Starting on Windows• Starting on Sun Solaris and Red Hat Linux• Starting from the command line• Setting user-defined environment variables on page 1-7.1.1.1 Starting on WindowsTo start <strong>RealView</strong> <strong>Debugger</strong>, select the following from the Windows Start menu:Programs → <strong>ARM</strong> → <strong>RealView</strong> Developer Suite v2.2 → <strong>RealView</strong> <strong>Debugger</strong>v1.8.11.1.2 Starting on Sun Solaris and Red Hat LinuxTo start <strong>RealView</strong> <strong>Debugger</strong> on Sun Solaris or Red Hat Linux, a <strong>RealView</strong> <strong>Debugger</strong>Control Panel, RVDEBUGCP is provided. See Getting started with <strong>RealView</strong> <strong>Debugger</strong> onpage B-7 for more details on using RVDEBUGCP).1.1.3 Starting from the command lineIf your <strong>RealView</strong> Developer Suite (RVDS) environment is correctly configured, you canstart <strong>RealView</strong> <strong>Debugger</strong> from the command line by typing rvdebug together with anyarguments (see Syntax of the rvdebug command on page 1-3).By default, the <strong>RealView</strong> <strong>Debugger</strong> starts in graphical user interface (GUI) mode. Youmust specify the -cmd option to start <strong>RealView</strong> <strong>Debugger</strong> in command line interface(CLI) mode.NoteIf you are having problems starting <strong>RealView</strong> <strong>Debugger</strong>, see the <strong>RealView</strong> DeveloperSuite Getting Started <strong>Guide</strong> for details of how to fix problems with your RVDSenvironment.1-2 Copyright © 2002-2005 <strong>ARM</strong> Limited. All rights reserved. <strong>ARM</strong> DUI 0153G
Starting to use <strong>RealView</strong> <strong>Debugger</strong>Syntax of the rvdebug commandThe syntax for starting <strong>RealView</strong> <strong>Debugger</strong> at the command-line is as follows:rvdebug [-b|-cmd][-install=pathname][-user=name][-home[=]pathname][-aws=pathname|-aws=-][-init[=]connection [-exec[=]image_pathname]][-inc[=]pathname][-jou[=]pathname][-log[=]pathname][-stdiolog[=]pathname][-nologo]where:-awsRuns a <strong>RealView</strong> <strong>Debugger</strong> session with the specified workspace. Thisoverrides any workspace specification that was stored when the previoussession ended.Use -aws=- to start without a workspace.-b Runs a <strong>RealView</strong> <strong>Debugger</strong> session in batch mode, that is without anyuser interaction.Use this with -inc to run a script file containing commands.Can be replaced with -b.NoteDo not use -b without -inc. If you do, <strong>RealView</strong> <strong>Debugger</strong> runs as ahidden process, and you have to use the Task Manager to terminate thervdebug process on Windows, or kill the rvdebug process on Sun Solarisor Red Hat Linux.If you use only -inc , the script file is run with the GUI enabled.-cmd-execRuns the <strong>RealView</strong> <strong>Debugger</strong> in headless debugger mode, where you canuse CLI commands to carry out debugging tasks. This enables you tointeract with the debugger without using the <strong>RealView</strong> <strong>Debugger</strong> GUI.See the <strong>RealView</strong> <strong>Debugger</strong> v1.8 Essentials <strong>Guide</strong> for details on gettingstarted with the headless debugger. Also, see the <strong>RealView</strong> <strong>Debugger</strong> v1.8Command Line Reference <strong>Guide</strong> for details on the CLI commands.Specifies the image to be loaded when <strong>RealView</strong> <strong>Debugger</strong> runs. Theimage specification can also include section details and image arguments.You can optionally include =, for example -exec=image.NoteYou must also use -init when loading an image in this way.<strong>ARM</strong> DUI 0153G Copyright © 2002-2005 <strong>ARM</strong> Limited. All rights reserved. 1-3
Starting to use <strong>RealView</strong> <strong>Debugger</strong>-homeSpecifies a <strong>RealView</strong> <strong>Debugger</strong> home directory used for the debuggingsession. You can optionally include =, for example -home=homedir. If thespecified directory does not exist, a new one is created. Where this is notspecified, the default directory is used.NoteThis option is only available under Windows. On Sun Solaris and RedHat Linux platforms, <strong>RealView</strong> <strong>Debugger</strong> always uses the homedirectory as specified by the $RVDEBUG_HOME environment variable.See Defining the home directory on Windows on page 1-11 for details.-inc-init-install-jouRuns a <strong>RealView</strong> <strong>Debugger</strong> session with the specified include file. Youcan optionally include =.Use -inc:• in batch mode in association with the -bat setting, to execute thecommands contained in the file and then exit the debugger• in command-line mode in association with the -cmd setting, toexecute the commands contained in the file and then leave thedebugger running ready to continue the debugging session• in GUI mode on its own, to execute the commands contained in thefile during a debugging session.Specifies the connection to establish when <strong>RealView</strong> <strong>Debugger</strong> runs. Youcan optionally include =, for example -init=connection. This optionrequires that you specify the connection using the named connectionformat:@endpoint_connection@access_providerFor example, @new_arm@localhost for RVISS.Specifies the installation directory where this differs from the defaultinstallation. This must point to the following directory:install_directory\RVD\Core\...\platformOn Windows systems, this is then used to define the location of thedefault <strong>RealView</strong> <strong>Debugger</strong> home directory when the debugger runs forthe first time.This overrides the environment variable RVDEBUG_INSTALL, and must beused if RVDEBUG_INSTALL is not set.Runs a <strong>RealView</strong> <strong>Debugger</strong> session with the specified journal file openfor writing. You can optionally include =, for example -jou=filename. Canbe replaced with -j.1-4 Copyright © 2002-2005 <strong>ARM</strong> Limited. All rights reserved. <strong>ARM</strong> DUI 0153G
Starting to use <strong>RealView</strong> <strong>Debugger</strong>-log-nologo-stdiolog-userRuns a <strong>RealView</strong> <strong>Debugger</strong> session with the specified log file open forwriting. You can optionally include =, for example -log=filename. Can bereplaced with -l.Runs a <strong>RealView</strong> <strong>Debugger</strong> session without displaying a splash screen.Runs a <strong>RealView</strong> <strong>Debugger</strong> session with the specified STDIOlog fileopen for writing. You can optionally include =, for example-stdiolog=filename. Can be replaced with -s.Specifies the user ID in the <strong>RealView</strong> <strong>Debugger</strong> home directory used forthe debugging session. Where this is not specified, the default Windowslogin is used.See Defining the home directory on Windows on page 1-11 for details.ExamplesThe following examples show how to use some of the command line options whenstarting <strong>RealView</strong> <strong>Debugger</strong> from the command line on Windows. The examplesassume that <strong>RealView</strong> <strong>Debugger</strong> is installed on the C drive, and use a working directoryon the D drive.• To start <strong>RealView</strong> <strong>Debugger</strong> and specify a home directory, where RVDEBUG_HOME isnot set:C:\<strong>ARM</strong>\RVD\Core\...\win_32-pentium\bin\rvdebug.exe-home="D:\rvd_work\home\my_user_name”• To start <strong>RealView</strong> <strong>Debugger</strong> and specify a workspace:C:\<strong>ARM</strong>\RVD\Core\...\win_32-pentium\bin\rvdebug.exe"-aws="D:\rvd_work\home\my_user_name\friday_test.aws”• To start <strong>RealView</strong> <strong>Debugger</strong> without loading a workspace:C:\<strong>ARM</strong>\RVD\Core\...\win_32-pentium\bin\rvdebug.exe -aws=-• To start <strong>RealView</strong> <strong>Debugger</strong> with a log file open for writing:C:\<strong>ARM</strong>\RVD\Core\...\win_32-pentium\bin\rvdebug.exe-log="D:\rvd_work\home\my_user_name\test_files\my_log.log”• To start <strong>RealView</strong> <strong>Debugger</strong> with a connection to RVISS, and an image loadedthat takes two arguments:C:\<strong>ARM</strong>\RVD\Core\...\win_32-pentium\bin\rvdebug.exe-init=@new_arm@localhost -exec “D:\rvd_work\images\my_image.axf;;100 200”<strong>ARM</strong> DUI 0153G Copyright © 2002-2005 <strong>ARM</strong> Limited. All rights reserved. 1-5
Starting to use <strong>RealView</strong> <strong>Debugger</strong>Getting more informationTo find more information on operations available from the command line, see:• Chapter 2 Working with Images for details on loading images.• Chapter 3 Controlling Execution for details on using log and journal files.• Chapter 10 Configuring Workspace Settings for details on workspaces.1-6 Copyright © 2002-2005 <strong>ARM</strong> Limited. All rights reserved. <strong>ARM</strong> DUI 0153G
Starting to use <strong>RealView</strong> <strong>Debugger</strong>1.1.4 Setting user-defined environment variablesYou can set user-defined environment variables to reconfigure the <strong>RealView</strong> <strong>Debugger</strong>environment to your particular requirements.Overriding the default home directorySet RVDEBUG_HOME to override the default home directory, for example:RVDEBUG_HOME=D:\<strong>ARM</strong>\RVD\Core\...\win_32-pentium\home\my_homeSpecifying a shared locationTo specify a shared location for <strong>RealView</strong> <strong>Debugger</strong> target configuration files, set:RVDEBUG_SHARE=H:\ournet\devel\rvd\shared<strong>ARM</strong> DUI 0153G Copyright © 2002-2005 <strong>ARM</strong> Limited. All rights reserved. 1-7
Starting to use <strong>RealView</strong> <strong>Debugger</strong>1.2 Using <strong>RealView</strong> Connection BrokerTarget vehicles can reside on the same workstation as <strong>RealView</strong> <strong>Debugger</strong> or any otherworkstation on your network. These services are handled by <strong>RealView</strong> ConnectionBroker. This section includes:• <strong>RealView</strong> Connection Broker operating modes• Starting <strong>RealView</strong> Connection Broker on Windows• Starting <strong>RealView</strong> Connection Broker from the command line on page 1-9• Using <strong>RealView</strong> Network Broker on page 1-10.1.2.1 <strong>RealView</strong> Connection Broker operating modes<strong>RealView</strong> Connection Broker operates in two modes:LocalRemoteOperating as <strong>RealView</strong> Simulator Broker, this runs on your localworkstation and enables you to access targets on the local workstation.Operating as <strong>RealView</strong> Network Broker, this runs on a remoteworkstation and makes specified targets on that workstation available toother workstations connected to the same network.Local host simulators are available immediately from the Connection Control window.If you expand the Simulator Broker vehicle, ready to connect to a simulator, <strong>RealView</strong><strong>Debugger</strong> starts <strong>RealView</strong> Connection Broker in local mode to manage yourconnection.See the chapter that describes configuring custom connections in <strong>RealView</strong> <strong>Debugger</strong>v1.8 Target Configuration <strong>Guide</strong> for examples of how to set up your own connections.1.2.2 Starting <strong>RealView</strong> Connection Broker on WindowsTo start <strong>RealView</strong> Connection Broker, select the following from the Windows Startmenu:Programs → <strong>ARM</strong> → <strong>RealView</strong> Developer Suite v2.2 → <strong>RealView</strong> NetworkBroker v1.8.1This starts <strong>RealView</strong> Connection Broker in remote mode.1-8 Copyright © 2002-2005 <strong>ARM</strong> Limited. All rights reserved. <strong>ARM</strong> DUI 0153G
Starting to use <strong>RealView</strong> <strong>Debugger</strong>1.2.3 Starting <strong>RealView</strong> Connection Broker from the command lineIf your <strong>RealView</strong> Developer Suite (RVDS) environment is correctly configured, you canstart <strong>RealView</strong> Connection Broker from the command line by typing rvbroker togetherwith any arguments (see <strong>RealView</strong> Connection Broker command line syntax).By default, <strong>RealView</strong> Connection Broker starts as <strong>RealView</strong> Simulator Broker. Youmust specify the remote option to start <strong>RealView</strong> Network Broker.NoteIf you are having problems starting <strong>RealView</strong> Connection Broker, see the <strong>RealView</strong>Developer Suite Getting Started <strong>Guide</strong> for details of how to fix problems with yourRVDS environment.<strong>RealView</strong> Connection Broker command line syntaxThe syntax for the command-line method of starting <strong>RealView</strong> Connection Broker inlocal or remote mode is as follows:rvbroker -install=pathname [port_num] [remote]where:-installport_numremoteSpecifies the <strong>RealView</strong> <strong>Debugger</strong> installation directory where this differsfrom the default installation.This overrides the environment variable RVDEBUG_INSTALL, and must beused if RVDEBUG_INSTALL is not set.Specifies the TCP/IP port number to use. 0 is the default port number. Youcan use a port number greater than zero for remote connections.Specifies that the TCP/IP port is used to make this workstation visible toother network users:• if specified, <strong>RealView</strong> Connection Broker runs as <strong>RealView</strong>Network Broker• if not specified, <strong>RealView</strong> Connection Broker runs as <strong>RealView</strong>Simulator Broker.<strong>ARM</strong> DUI 0153G Copyright © 2002-2005 <strong>ARM</strong> Limited. All rights reserved. 1-9
Starting to use <strong>RealView</strong> <strong>Debugger</strong>1.2.4 Using <strong>RealView</strong> Network BrokerAny remote workstation that is to give access to simulators or emulators must berunning <strong>RealView</strong> Connection Broker in remote mode, that is <strong>RealView</strong> NetworkBroker. This can be started in two ways:• if the remote workstation is running Sun Solaris or Red Hat Linux and the rshcommand is available at the local workstation, the local workstation can start<strong>RealView</strong> Network Broker on the remote workstation• if the remote workstation is running Windows, <strong>RealView</strong> Network Broker mustbe started explicitly on that workstation.If you are using a remote Windows workstation to access simulators or emulators, start<strong>RealView</strong> Network Broker:1. Log onto the remote workstation.2. Start <strong>RealView</strong> Network Broker as described in:• Starting <strong>RealView</strong> Connection Broker on Windows on page 1-8• Starting <strong>RealView</strong> Connection Broker from the command line on page 1-9.NoteIf you end a debugging session, and close down <strong>RealView</strong> <strong>Debugger</strong>, this does notterminate <strong>RealView</strong> Network Broker on the remote workstation. You must shut thisdown explicitly.To access a remote host simulator or emulator using <strong>RealView</strong> Network Broker youmust define the location of the remote workstation in your target configuration settings.The chapter that describes working with remote targets in <strong>RealView</strong> <strong>Debugger</strong> v1.8Target Configuration <strong>Guide</strong> includes examples of how to set up your own connections.1-10 Copyright © 2002-2005 <strong>ARM</strong> Limited. All rights reserved. <strong>ARM</strong> DUI 0153G
Starting to use <strong>RealView</strong> <strong>Debugger</strong>1.3 <strong>RealView</strong> <strong>Debugger</strong> directories<strong>RealView</strong> <strong>Debugger</strong> must be able to identify the installation directory and a homedirectory so that it can locate files and store updated files or user configuration details.This section describes:• Defining the installation directory• Defining the home directory on Windows• The home directory on Sun Solaris or Red Hat Linux on page 1-12• Using the examples directories on page 1-12.1.3.1 Defining the installation directory<strong>RealView</strong> <strong>Debugger</strong> must be able to identify the installation directory so that it canlocate user files and configuration files. It uses the following sequence of tests to definethe installation directory:1. The -install command line argument, where used (see Starting from thecommand line on page 1-2). This is available only on Windows systems.2. The RVDEBUG_INSTALL environment variable, which is set during installation.1.3.2 Defining the home directory on Windows<strong>RealView</strong> <strong>Debugger</strong> requires a home directory to store user-specific settings andconfiguration files. This is not the same as your Windows home directory.On Windows, the location of this directory depends on the environment variables set,and the command line arguments used, when <strong>RealView</strong> <strong>Debugger</strong> starts. It uses thefollowing sequence of tests to define the home directory:1. The -home command line argument (only available under Windows), if used (seeStarting from the command line on page 1-2).2. The RVDEBUG_HOME environment variable, if set (see Setting user-definedenvironment variables on page 1-7).3. The -user command line argument, if used (see Starting from the command lineon page 1-2). This is then used to specify the user ID in the home directory, forexample set USER=my_user_name to specify the home directory:install_directory\RVD\Core\...\home\my_user_name.4. Your default Windows login, for example:install_directory\RVD\Core\...\home\WinLogID.<strong>ARM</strong> DUI 0153G Copyright © 2002-2005 <strong>ARM</strong> Limited. All rights reserved. 1-11
Starting to use <strong>RealView</strong> <strong>Debugger</strong>If your Windows login ID contains spaces, these are converted to underscores.Any ID longer than 14 characters is automatically truncated.Because you can choose the home directory, the installation directory and your username, the <strong>RealView</strong> <strong>Debugger</strong> home directory is defined in this book as being in adefault location:install_directory\RVD\Core\...\home\user_nameHere, user_name is your Windows login ID. This means that your files might be storedin places other than those given in the examples.For details on the files that are stored in the <strong>RealView</strong> <strong>Debugger</strong> home directory see theonline help topic Where is information stored?1.3.3 The home directory on Sun Solaris or Red Hat LinuxOn Sun Solaris or Red Hat Linux, your home directory is in ~/rvd.1.3.4 Using the examples directoriesVarious demonstration projects are supplied as part of the <strong>RealView</strong> Developer Suiteroot installation. These contain programs in the form of <strong>ARM</strong> ® assembly language, C,or C++ source code files. These projects are stored in:install_directory\RVDS\Examples\...\projectThe root installation also includes demonstration projects, and associated files, forworking with Flash. These are in:install_directory\RVD\Core\...\flash\examples\platform1-12 Copyright © 2002-2005 <strong>ARM</strong> Limited. All rights reserved. <strong>ARM</strong> DUI 0153G
Chapter 2Working with ImagesThis chapter describes how to manage images during a <strong>RealView</strong> ® <strong>Debugger</strong> debuggingsession. It contains the following sections:• Loading images on page 2-2• Managing images on page 2-9• Working with symbols on page 2-19• Working with multiple images on page 2-20• Unloading and reloading images on page 2-22.<strong>ARM</strong> DUI 0153G Copyright © 2002-2005 <strong>ARM</strong> Limited. All rights reserved. 2-1
Working with Images2.1 Loading imagesIf you have started <strong>RealView</strong> <strong>Debugger</strong>, as described in Chapter 1 Starting to use<strong>RealView</strong> <strong>Debugger</strong>, you can begin to use many features of the debugger, for exampleediting source code and building projects. However, to begin debugging images youmust connect to a suitably configured debug target.<strong>RealView</strong> <strong>Debugger</strong> uses a board file to access information about the debuggingenvironment and the debug targets available to you, for example how memory ismapped. See <strong>RealView</strong> <strong>Debugger</strong> v1.8 Target Configuration <strong>Guide</strong> for details of how tocustomize your targets using your board file.You can start to use <strong>RealView</strong> <strong>Debugger</strong> with the default board file installed as part ofthe root installation without making any more changes.Select Target → Connect to Target... from the main menu to display the ConnectionControl window to make your first connection. For details on using this window, see thechapter that describes getting started with <strong>RealView</strong> <strong>Debugger</strong> in <strong>RealView</strong> <strong>Debugger</strong>v1.8 Essentials <strong>Guide</strong>.If you have started <strong>RealView</strong> <strong>Debugger</strong> and connected to a debug target, you can loadan image to begin your debugging session. This section describes different ways to loadan image to your debug target and how to monitor the loading operation:• Loading from a user-defined project on page 2-3• Using the Load File to Target dialog box on page 2-3• Loading from the Process Control pane on page 2-5• Quick loading on page 2-5• Loading from the command line on page 2-6• Loading and runtime visualization on page 2-8.The examples in this section assume that you are using a Typical installation and thatthe software has been installed in the default location. If you have changed thesedefaults, or set the environment variable RVDEBUG_INSTALL, your installation differs fromthat described here.NoteWhen you are using <strong>RealView</strong> <strong>ARM</strong>ulator ® ISS software simulator to simulate an<strong>ARM</strong> ® architecture-based debug target:• You must load an image, or write to the PC, to begin execution.• Loading an image does not automatically send a reset. To reset at the same timeas an image load, send a RESET command before you load, or reload, the image.2-2 Copyright © 2002-2005 <strong>ARM</strong> Limited. All rights reserved. <strong>ARM</strong> DUI 0153G
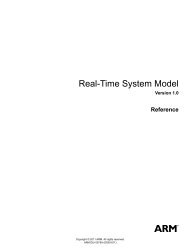
Working with Images2.1.1 Loading from a user-defined projectWhere you have created a user-defined project, it is recommended that you open theproject first to load and debug the associated image, or images. Opening the projectenables you to access the project properties, save new settings, or make changes to thebuild model.To load the image associated with an open user-defined project, click on the bluehyperlink in the File Editor pane. For the example dhrystone project, the imagehyperlink is:install_directory\RVDS\Examples\...\dhrystone\DebugRel\dhrystone.axfNoteIf you load an image, built as part of a user-defined project, without opening the project,this does not give you access to all the project properties because these are unknown to<strong>RealView</strong> <strong>Debugger</strong>. In this case, <strong>RealView</strong> <strong>Debugger</strong> creates an in-memory project, oruses the saved auto-project file (see Working with auto-projects on page 2-13 fordetails).2.1.2 Using the Load File to Target dialog boxSelect Target → Load Image... from the Code window main menu to load an image toa processor for execution. This displays the Load File to Target dialog box shown inFigure 2-1.Figure 2-1 Load File to Target dialog box<strong>ARM</strong> DUI 0153G Copyright © 2002-2005 <strong>ARM</strong> Limited. All rights reserved. 2-3
Working with ImagesThis dialog box contains controls to configure the way the image is loaded forexecution:Symbols OnlyBy default, any object file loaded from this dialog box also loads thesymbols. If you want to load only the symbols then select this check box,for example when you are working with ROM images.If the program was initially compiled without a symbol table then youmust recompile the program before loading only the symbols.See Working with symbols on page 2-19 for more details.Replace Existing File(s)By default, loading a new image overwrites any image currently loadedto the target.If you are working with multiple applications, use this check box to carryout separate loads of associated modules such as an RTOS and associatedapplications.Sections:Use this field to enter a comma-separated list of sections to be loaded, forexample, ER_RO,ER_RW,ER_ZI.A name entered here is then used as the argument to a LOAD command (seeSpecifying the target connection and load instruction on page 2-7).Arguments: Use this field to enter a space-separated list of arguments to the image.Entries in this field create an arguments list used with the LOAD command(see Specifying the target connection and load instruction on page 2-7).PCWhen you load an image to the debug target you can optionally set theProgram Counter (PC):Auto-Set PCSelected by default, this control defines the location of the PCwhen you load an image. <strong>RealView</strong> <strong>Debugger</strong> tracks the stateof the other check boxes on this dialog box and sets the PC atthe normal entry point, if you select the check box ReplaceExisting File(s).Unselect the Auto-Set PC check box to have control over thePC when you load an image.Set PC to Entry pointWhere selected, <strong>RealView</strong> <strong>Debugger</strong> sets the PC at the startaddress specified in the object module.2-4 Copyright © 2002-2005 <strong>ARM</strong> Limited. All rights reserved. <strong>ARM</strong> DUI 0153G
Working with ImagesThis is the default if you select both:• Auto-Set PC• Replace Existing File(s).Unselect the Set PC to Entry point check box to prevent theload command setting the PC.NoteControls used here, for example setting the PC, might be overridden by load settingselsewhere, for example as specified in your project or target configuration settings.2.1.3 Loading from the Process Control paneIf you have started <strong>RealView</strong> <strong>Debugger</strong> and are connected to a debug target, you canload an image for execution from the Process Control pane:1. Select View → Process Control from the default Code window main menu todisplay the Process Control pane.With no image loaded, the pane only shows details about the debug targetprocessor and the current location of the PC.2. Right-click on the top line, the processor entry (for example <strong>ARM</strong>7TDMI), to displaythe Process context menu.With no image loaded, you can also display this menu from the Image entry.3. Select Load Image... to display the Load File to Target dialog box.4. Complete the entries in the dialog box, described in Using the Load File to Targetdialog box on page 2-3, to load the required image.2.1.4 Quick loadingWith a connection established, you can load an image by dragging the appropriateexecutable file, with the .axf extension, and dropping it into the File Editor pane. Ifsuccessful, this is the same as loading the image using the Load File to Target dialogbox with the default settings (shown in Figure 2-1 on page 2-3), that is the load auto-setsthe PC and overwrites any existing image on the debug target.NoteEnsure that the target device for the current connection, shown in the Code window titlebar, matches the processor type of the image you are trying to load. If they do not matchthe load fails. For example, you cannot load an image built for an <strong>ARM</strong>architecture-based processor on a DSP.<strong>ARM</strong> DUI 0153G Copyright © 2002-2005 <strong>ARM</strong> Limited. All rights reserved. 2-5
Working with ImagesIn addition, make sure that the processor or architecture of the target matches theprocessor or architecture that you specified when you built the image. Although theimage might load, it might not run correctly. For example, you cannot run an image builtfor an <strong>ARM</strong>966E-S processor on an <strong>ARM</strong>7TDMI target.2.1.5 Loading from the command lineYou can start <strong>RealView</strong> <strong>Debugger</strong> from the command line and specify an image to loadautomatically. You must also specify a target connection to use. The syntax for loadingan image this way is:rvdebug.exe -init=@endpoint_connection@access_provider -exec pathnamewhere pathname specifies the image loaded and can also include image sections to beloaded and image arguments. See Specifying the target connection and load instructionon page 2-7 for more details.If the pathname includes spaces, it must be enclosed in quotes, for example:rvdebug.exe -init=@new_arm@localhost -exec “C:\rvd_work\my images\my_image.axf”This starts <strong>RealView</strong> <strong>Debugger</strong>, connects to RVISS, and issues a load/pd/r commandto load the named image to your debug target. The /pd switch specifies that any errormessages are to appear in a dialog box. The /r switch specifies that any image currentlyloaded on the chosen target is to be replaced by the specified image. For details of theLOAD command, see <strong>RealView</strong> <strong>Debugger</strong> v1.8 Command Line Reference <strong>Guide</strong>.NoteFor details on running <strong>RealView</strong> <strong>Debugger</strong> from the command line see Chapter 1Starting to use <strong>RealView</strong> <strong>Debugger</strong>. Also see the chapter that describes getting startedwith the CLI in the <strong>RealView</strong> <strong>Debugger</strong> v1.8 Essentials <strong>Guide</strong>.Connection prompt on load failureStarting <strong>RealView</strong> <strong>Debugger</strong> in this way connects to the target, loads the specifiedimage to that target, and updates the Code window. This is the same as Using the LoadFile to Target dialog box on page 2-3.If you do not specify a target connection when starting <strong>RealView</strong> <strong>Debugger</strong> from thecommand line, or the specified connection fails, the debugger displays a prompt box,shown in Figure 2-2 on page 2-7, for you to complete the connection.2-6 Copyright © 2002-2005 <strong>ARM</strong> Limited. All rights reserved. <strong>ARM</strong> DUI 0153G
Working with ImagesFigure 2-2 Connection promptClick:YesNoCauses the debugger to wait until you successfully connect to your debugtarget. The image is then loaded to the connected target.Starts the debugger but cancels the image loading operation.Specifying the target connection and load instructionTo load an image from the command line, you must also specify a target connection.You can also pass arguments to the image and specify any image sections to be loaded.The syntax is as follows:rvdebug.exe -init=@endpoint_connection@access_provider -execimage.axf;[sections];[arg1 arg2 ...]where:endpoint_connectionSpecifies the endpoint connection name.access_providerSpecifies the access provider name for the connection.image.axf Specifies the image to be loaded.sections Specifies the sections to load for the image, for example, ER_RO,ER_RW.arg1 arg2 ...Specifies an optional, space-separated, list of arguments to the image.NoteSpaces must not be included between the argument and the qualifier. Where anarguments list is given, quotes must be used.For details on specifying sections and arguments, see the LOAD command in <strong>RealView</strong><strong>Debugger</strong> v1.8 Command Line Reference <strong>Guide</strong>.<strong>ARM</strong> DUI 0153G Copyright © 2002-2005 <strong>ARM</strong> Limited. All rights reserved. 2-7
Working with ImagesExamplesThe following examples show how to use the -init and -exec arguments:• To establish a connection to the Simulator Broker interface of RVISS, and load animage with sections ER_RO and ER_RW and the argument 5000:rvdebug.exe -init=@new_arm@localhost -exec“C:\rvd\images\my_image.axf;ER_RO,ER_RW;5000”If you want to supply arguments, but no sections, leave the sections blank, forexample:“C:\rvd\images\my_image.axf;;5000”• To establish a connection to the Simulator Broker interface of RVISS, and load animage without specific sections and without arguments:2.1.6 Loading and runtime visualizationrvdebug.exe -init=@new_arm@localhost -exec C:\rvd\images\my_image.axfAs you load an image to your debug target, the Code window Status line shows theprogress of the load and gives an indication of the percentage complete.The Status line also shows the Processor status of the debug target:• Where an image is loaded but not executing, the status shows Stopped.• Where an image is running, the status shows Running, together with a movingprogress.• Where the current state of the target is unknown, the status shows Unknown. Forexample it might have been running when the connection was established or itmight be disconnected.2-8 Copyright © 2002-2005 <strong>ARM</strong> Limited. All rights reserved. <strong>ARM</strong> DUI 0153G
Working with Images2.2 Managing imagesThis section describes how to manage your application files in the Code window. Itcontains the following sections:• Viewing image details in the Code window• Viewing image details in the Process Control pane on page 2-11• Working with auto-projects on page 2-13• Working with user-defined projects on page 2-17.The examples in this section assume that:• you are using a Typical installation and that the software has been installed in thedefault location. If you have changed these defaults, or set the environmentvariable RVDEBUG_INSTALL, your installation differs from that described here.• you are licensed to use multiprocessor debugging mode. However, where given,multiprocessor examples are only used for illustration. If you are licensed to workin single-processor mode your Code window differs from that shown here, forexample some toolbar buttons are not available to you, but all the examples workas described.2.2.1 Viewing image details in the Code windowIf an image is successfully loaded to the target processor, the Code window is updated,shown in Figure 2-3 on page 2-10.<strong>ARM</strong> DUI 0153G Copyright © 2002-2005 <strong>ARM</strong> Limited. All rights reserved. 2-9
Working with ImagesFigure 2-3 Code window with image loadedNoteIn this Code window Text Coloring is enabled by default and line numbering is turnedon by selecting Edit → Advanced → Show Line Numbers.<strong>RealView</strong> <strong>Debugger</strong> updates the panes with information about the new image, whereknown. Because you have not started debugging, other panes are empty.When you load an image with symbols, as here, <strong>RealView</strong> <strong>Debugger</strong> searches for thecorresponding source file associated with the current execution context (usually thatcontaining main()) and displays the file as a tab in the File Editor pane. The Src tab actslike a button to display the current source if it is available. In this example, click on theSrc tab to display the source-level code view.The image was loaded with the Auto-set PC option set and so execution control islocated at the default entry point. This is indicated by a box at line 78, colored red bydefault.Click on the Dsm tab to show the disassembly-level view.2-10 Copyright © 2002-2005 <strong>ARM</strong> Limited. All rights reserved. <strong>ARM</strong> DUI 0153G
Working with ImagesSee Code views on page 3-3 for more details on using these tabs.2.2.2 Viewing image details in the Process Control paneBy default, the side pane to the right of the File Editor pane is the Process Control pane.However, if you no longer have the Process Control pane visible, select View →Process Control to display it as a floating pane, shown in Figure 2-4.The Process Control pane contains tabs:Figure 2-4 Image details in the Process Control paneProcessMapDisplays details of the target processor or, in multiprocessor debuggingmode, the current process.See Working with processes for details.Displays the memory mapping for the target processor, or the currentprocess. You can also temporarily change the map settings if required.See Chapter 5 Memory Mapping for details on using this tab.The tabs displayed in the Process Control pane depend on the debugging mode that youare licensed to use and your current debugging environment. For example, whendebugging multithreaded applications, a Thread tab is displayed. See the chaptersdescribing RTOS support and multiprocessing in <strong>RealView</strong> <strong>Debugger</strong> v1.8 Extensions<strong>User</strong> <strong>Guide</strong> for more details.Working with processesThe Process Control pane shows details about each connection known to <strong>RealView</strong><strong>Debugger</strong>. If you are debugging a single process application, use the Process tab to seethe processor details, project details, and information about any image(s) loaded ontothe debug target, for example:• image name<strong>ARM</strong> DUI 0153G Copyright © 2002-2005 <strong>ARM</strong> Limited. All rights reserved. 2-11
Working with Images• image resources, including DLLs• how the image was loaded (that is, image with symbols, or symbols only)• associated files.Use context menus in the Process tab to:• reset your target processor (where supported)• load, unload, and reload images, and refresh symbols• manage settings for auto-projects and user-defined projects• open a specified source file.In the example in Figure 2-4 on page 2-11, you can see the entries:Current processShows the target processor and the current state of any running process.Where the process is stopped, as here, this shows the location of the PC.Where the process is executing, this changes to Run.ImageDetails the loaded images:Load For each image, a check box indicates the load state and whathas been loaded, that is image, symbols, or both.Project Shows that the project associated with the connection is eithera real, user-defined project file (shown by the project name) oran auto-project (shown by ).Settings Shows where project settings are stored. Thesemight be from a disk file (shown by ) orfrom an in-memory auto-project (shown by ).Sources These are either the sources making up the project,sources extracted from the makefile used in thebuild, or sources from the loaded image.Depending on the type of project, right-click on thisentry to display a context menu to specify howsources are collected.Working with source filesWhen working with entries in the Process Control pane, you can use type aheadfacilities to locate files. This is especially useful where your project specifies a largenumber of source files. For example, type the first letter of the source file that you want2-12 Copyright © 2002-2005 <strong>ARM</strong> Limited. All rights reserved. <strong>ARM</strong> DUI 0153G
Working with Imagesto view. <strong>RealView</strong> <strong>Debugger</strong> expands the Sources entry and locates the first matchingoccurrence. When using this feature, the type ahead buffer is case insensitive and islimited to 128 characters. Do one of the following to clear the buffer:• select a different item• press Home to move to the top of the pane• press Escape.Getting more information about an entry in the Process tabRight-click on an entry in the Process tab to see the context menu associated with thatentry. Select Properties to see a text description of the item under the cursor.NoteThe options available from the context menu depend on which entry is selected and thecurrent state of the process or processor.2.2.3 Working with auto-projectsAn auto-project is an in-memory Custom project. The project settings are obtained fromthe image, where known. However, because no build details are known, the imagecannot be rebuilt from the auto-project. See the <strong>RealView</strong> <strong>Debugger</strong> v1.8 ProjectManagement <strong>User</strong> <strong>Guide</strong> for more details about auto-projects and Custom projects.When you load an image directly to a debug target, <strong>RealView</strong> <strong>Debugger</strong> checks to seeif an auto-project file exists for the image in the same location. Where an auto-projectexists, <strong>RealView</strong> <strong>Debugger</strong> opens it and then uses it to load the specified image. Whereno auto-project exists, <strong>RealView</strong> <strong>Debugger</strong> creates an in-memory auto-project to use inthis session.If, for example, you load the image dhrystone.axf, ininstall_directory\RVDS\Examples\...\dhrystone\DebugRel, <strong>RealView</strong> <strong>Debugger</strong> looksfor the corresponding auto-project file dhrystone.axf.apr, in the same location. Whereno auto-project exists, <strong>RealView</strong> <strong>Debugger</strong> creates an in-memory auto-project, nameddhrystone. The Process tab is then updated with the project details, shown in Figure 2-5on page 2-14.<strong>ARM</strong> DUI 0153G Copyright © 2002-2005 <strong>ARM</strong> Limited. All rights reserved. 2-13
Working with ImagesImage nameWhat is loadedAuto-project detailsLocation ofsettingsThis is an in-memory auto-projectFigure 2-5 Auto-projects in the Process Control pane<strong>RealView</strong> <strong>Debugger</strong> gives you the option to save the in-memory settings to a file to usenext time the image is loaded or as the basis of a new user-defined project.Viewing project settingsYou can view the settings for the in-memory auto-project in the same way as for auser-defined project:1. Right-click on either the Project entry or the Settings entry, to display theProject context menu.2. Select Project Properties... to display the Project Properties window where youcan view the project settings. These are derived from the image details or createdusing defaults by <strong>RealView</strong> <strong>Debugger</strong>.3. Select File → Close Window to close the Project Properties window withoutmaking any changes.NoteDo not leave the Project Properties window open when you are working with thedebugger. When searching for source files, <strong>RealView</strong> <strong>Debugger</strong> updates the projectproperties as necessary. This fails if the window is already open (see Searching forsource files on page 3-19 for details).2-14 Copyright © 2002-2005 <strong>ARM</strong> Limited. All rights reserved. <strong>ARM</strong> DUI 0153G
Working with ImagesChanging project settingsYou can change load settings for an image where you do not have a user-defined projectby defining actions in the auto-project and then the saving the file for use next time theimage loads. You can specify commands to execute when the project opens and/orcloses, or runtime controls that define the image environment.NoteChanging auto-project settings might not take effect until the next time the image isloaded and executed. Reload an image to implement any new settings.You can change settings for the in-memory auto-project in the same way as for auser-defined project:1. Right-click on the Project entry, to display the Project context menu.2. Select Project Properties... to display the Project Properties window.3. Expand the PROJECT group to see the project settings, shown in Figure 2-6.Figure 2-6 Changing auto-project settingsHere you can see the Command_Open_Close group and other project settings.4. Expand the SETTINGS group to see the image settings.Figure 2-6 shows the Image_load group and other image settings, such asbreakpoints and runtime controls.5. Right-click on the Image_load group and select Explore to see the group contentsin the right pane.6. Right-click on the Set_pc entry and select never from the options.<strong>ARM</strong> DUI 0153G Copyright © 2002-2005 <strong>ARM</strong> Limited. All rights reserved. 2-15
Working with Images7. Select File → Save and Close to save your changes and close the ProjectProperties window.To return the setting to the default:1. Display the Project Properties window.2. Right-click on the entry to display the context menu.3. Select Reset to Default to restore the setting.4. Select File → Save and Close to save your changes and close the ProjectProperties window. The changes are saved to the file dhrystone.axf.apr.NoteThere are full descriptions of the entries in the Project Properties window, with detailsof the available options, in the <strong>RealView</strong> <strong>Debugger</strong> online help topic Changing ProjectProperties.Saving project settings from the Process Control paneYou can save the default project settings for an auto-project from the Process Controlpane, so that the settings are used when you next load the image:1. In the Process Control pane Process tab, right-click on the Project entry.2. Select Save from the Project context menu to save the setting to the filedhrystone.axf.apr.NoteThis option is not available if an auto-project file already exists.Deleting a saved auto-project fileYou can delete a saved auto-project so that the file is removed from your disk:1. Right-click on the Project entry, to display the Project context menu.2. Select Delete Auto-Project File to remove the saved file.2-16 Copyright © 2002-2005 <strong>ARM</strong> Limited. All rights reserved. <strong>ARM</strong> DUI 0153G
Working with ImagesClosing auto-projectsTo close an auto-project, right-click on the Project entry in the Process tab andselect Close from the Project context menu. If you close the auto-project associatedwith a loaded image, this immediately unloads the image and removes all image detailsfrom the debugger. If you close an auto-project, <strong>RealView</strong> <strong>Debugger</strong> executes any closecommands associated with the project.NoteYou can also use the Project menu from the Code window main menu to closeauto-projects.See the chapter that describes working with multiple projects in <strong>RealView</strong> <strong>Debugger</strong>v1.8 Project Management <strong>User</strong> <strong>Guide</strong> for more details on working with auto-projects.2.2.4 Working with user-defined projectsWith a user-defined project open, right-click on the Project entry to display the Projectcontext menu.This menu enables you to view details of your project, make changes to project settings,and to perform selected components of the build model following changes to projectfiles.See the description of the Project menu in the chapter that describes working withprojects in <strong>RealView</strong> <strong>Debugger</strong> v1.8 Project Management <strong>User</strong> <strong>Guide</strong> for full details onthese options.Closing user-defined projectsTo close a user-defined project where the associated image is loaded, right-click on theProject entry in the Process tab and select Close from the Project context menu.<strong>RealView</strong> <strong>Debugger</strong> gives you the option to unload the image when the project closes.If you choose to unload the image, <strong>RealView</strong> <strong>Debugger</strong> completes the operation, closesthe project, and then executes any close operations associated with the project.If you do not unload the image, the debugger:1. Closes the user-defined project.2. Executes any close commands associated with the project.<strong>ARM</strong> DUI 0153G Copyright © 2002-2005 <strong>ARM</strong> Limited. All rights reserved. 2-17
Working with Images3. Either:• opens the saved auto-project file, where one exists for the image• creates an in-memory project where no saved auto-project exists.It is not necessary to reload the image following these actions.NoteYou can also use the Project menu from the Code window main menu to closeuser-defined projects in the same way.See the chapter that describes working with projects in <strong>RealView</strong> <strong>Debugger</strong> v1.8 ProjectManagement <strong>User</strong> <strong>Guide</strong> for more details on closing your projects.2-18 Copyright © 2002-2005 <strong>ARM</strong> Limited. All rights reserved. <strong>ARM</strong> DUI 0153G
Working with Images2.3 Working with symbolsAn executable image contains symbolic references, such as function and variablenames, in addition to the program code and data.If you select the Symbols Only check box, on the Load File to Target dialog box (seeFigure 2-1 on page 2-3), the symbolic references are loaded into the debugger withoutloading any code or data to the target. You might want to do this if the code and data arealready present on the debug target, for example in a ROM device or where you areworking with an RTOS-enabled target.You can choose to refresh the symbol data for a loaded image during your debuggingsession. There are two ways to do this for the current process, depending on the numberof images loaded:• select Target → Refresh Symbols from the Code window main menu• use the Process Control pane:— right-click on the Image entry to display the Image context menu— select Refresh Symbols from the available options.NoteWhen an image is loaded with symbols, the symbol table is recreated. Thisautomatically deletes any macros because these are stored in the symbol table.<strong>ARM</strong> DUI 0153G Copyright © 2002-2005 <strong>ARM</strong> Limited. All rights reserved. 2-19
Working with Images2.4 Working with multiple images<strong>RealView</strong> <strong>Debugger</strong> provides the option to load multiple images to the same debugtarget, that is where there is only a single connection. This enables you to load, forexample, both an executable image and an RTOS at the same time.To load two images to the same debug target:1. Load the first image, for example hello.axf, in any of the load methods. This canbe either a standalone image, or an image that is associated with a user-definedproject.2. Load a second image to the same target, for example demo.axf. The two imagesmust not overlap in memory. You must load the second image as follows:a. Select Target → Load Image... from the main menu to display the LoadFile to Target dialog box (see Using the Load File to Target dialog box onpage 2-3).b. Unselect the Replace Existing File(s) check box, to prevent this imagereplacing the first image.c. Unselect the Auto-Set PC check box, then unselect the Set PC to Entrypoint check box. This makes sure that the PC still points to the entry pointin the first image.NoteThe Set PC to Entry point check box must be selected only for the imagethat contains the entry point, which might not be the first image you load.d. Click Open.3. Select View → Process Control from the default Code window main menu todisplay the Process Control pane.4. Expand the display to see the process details, shown in Figure 2-7.Figure 2-7 Multiple images in the Process Control pane2-20 Copyright © 2002-2005 <strong>ARM</strong> Limited. All rights reserved. <strong>ARM</strong> DUI 0153G
Working with ImagesIn this example, <strong>RealView</strong> <strong>Debugger</strong>:• creates an in-memory auto-project for hello.axf• binds hello.axf.apr to the current connection (using default binding)• creates an in-memory auto-project for demo.axf• does not bind demo.axf.apr, because there is no connection available• updates the Code window title bar to show the active project (hello).For information on projects and project binding see <strong>RealView</strong> <strong>Debugger</strong> v1.8 ProjectManagement <strong>User</strong> <strong>Guide</strong>.Because neither image is currently executing, the Process entry shows the currentlocation of the PC, which was auto-set when the first image was loaded. You can movethe PC manually to start debugging or reload the image that you want to test. Forinformation on changing the PC see:• Chapter 3 Controlling Execution for details on setting scope.• Chapter 6 Working with Debug Views for details on changing register entries.Note<strong>RealView</strong> <strong>Debugger</strong> can only keep track of the entry point for a single image. Therefore,if you are working with multiple images, you must set a manual breakpoint at the entrypoint of any other images you have loaded. This ensures that <strong>RealView</strong> <strong>Debugger</strong> is ableto debug these images in the usual way.See the chapter that describes multiprocessing in <strong>RealView</strong> <strong>Debugger</strong> v1.8 Extensions<strong>User</strong> <strong>Guide</strong> for more details on working with the Process Control pane inmultiprocessor debugging mode.<strong>ARM</strong> DUI 0153G Copyright © 2002-2005 <strong>ARM</strong> Limited. All rights reserved. 2-21
Working with Images2.5 Unloading and reloading imagesThis section describes how to unload and reload images without ending your debuggingsession. It contains the following sections:• Resetting your target processor• Unloading an image• Replacing the currently loaded image on page 2-23• Reloading an image on page 2-24.2.5.1 Resetting your target processorWhere supported by your debug target, you might want to reset your target processorduring a debugging session. The reset might be hard or soft depending on the processortype. See your processor hardware documentation for details.If the processor chosen for reset has an image loaded then this might be unloaded onreset. The image can be reloaded as described in Reloading an image on page 2-24.To reset a processor:1. Select View → Process Control from the default Code window main menu todisplay the Process Control pane.2. Right-click on the Process entry to display the Process context menu.3. Select Reset Target Processor to perform the reset.NoteYou cannot reset a target processor through a Multi-ICE connection using this method.You must use the Multi-ICE Server to perform a processor reset. See the Multi-ICE<strong>User</strong> <strong>Guide</strong> for more details.2.5.2 Unloading an imageUse the Process Control pane if you do want to unload an image explicitly:1. Right-click on the Image entry to display the Image context menu.2. Select Unload from the available options.This is the same as clicking on the Load check box to unload the image.2-22 Copyright © 2002-2005 <strong>ARM</strong> Limited. All rights reserved. <strong>ARM</strong> DUI 0153G
Working with ImagesIf there are any source file tabs currently displayed in the File Editor pane, the Src tabis brought to the top automatically when you unload because there is no known context.The open files remain available for editing, if required. See Code views on page 3-3 formore details on using these tabs.Unloading an image does not affect target memory. It unloads the symbol table (and anymacros) and removes debug information from <strong>RealView</strong> <strong>Debugger</strong>. However, the imagename is retained for reloading and the associated auto-project, or user-defined projectused to load the image, is maintained.NoteUnloading an image does not close the in-memory auto-project, associated with theimage, or save any changes to the auto-project. This enables you to modify thesesettings, and save, ready for the next time you load (or reload) this image. However, ifyou close the auto-project explicitly, <strong>RealView</strong> <strong>Debugger</strong> performs an image unload.Deleting image detailsTo remove all details about an image after you have unloaded it, right-click on the Imageentry in the Process Control pane and select Delete Entry from the context menu. Ifthere is an auto-project associated with the image, this closes. If you opened auser-defined project to load the image, this does not close.Disconnecting with an image loadedIf you disconnect with an image loaded, this removes debug information from <strong>RealView</strong><strong>Debugger</strong> and so clears pane contents from your Code window. This does not close theuser-defined project used to load the image, or any auto-project associated with theimage. You can reload the image if you reconnect.However, if you close the project explicitly, you must load the image again after youreconnect because all image details are removed.2.5.3 Replacing the currently loaded imageYou do not have to unload an image from a debug target before loading a new image forexecution. To load over an existing image, ensure that the Replace Existing File(s)check box is checked on the Load File to Target dialog box, shown in Figure 2-1 onpage 2-3. This automatically removes all details about the first image from <strong>RealView</strong><strong>Debugger</strong>.<strong>ARM</strong> DUI 0153G Copyright © 2002-2005 <strong>ARM</strong> Limited. All rights reserved. 2-23
Working with Images2.5.4 Reloading an imageDuring your debugging session you might have to edit your source code and thenrecompile. Following these changes, you must either:• load the previously unloaded image• reload the image.Reloading refreshes any window displays and updates debugger resources.To reload an image:• Select Target → Reload Image to Target from the Code window to reload anupdated image to your debug target.An image that has been unloaded cannot be reloaded using this option. Insteadyou must load the image again using Target → Load Image....• Click the Reload Image button on the Image toolbar.• Select the Load check box in the Process Control pane.This is the same as double-clicking on the Load entry.<strong>RealView</strong> <strong>Debugger</strong> uses auto-project settings to load an image and these areautomatically used when you reload the image, or when you select it from the RecentImages list.If you used the Load File to Target dialog box to enter a space-separated list ofarguments to the image or comma-separated list of sections, these are not used whenyou reload (see Using the Load File to Target dialog box on page 2-3 for details). Toreuse the arguments and sections either:• Select Target → Recent Images to reload the image from the Recent Images list.• Click the Set PC to Entry button on the Image toolbar to submit a RESTARTcommand.2-24 Copyright © 2002-2005 <strong>ARM</strong> Limited. All rights reserved. <strong>ARM</strong> DUI 0153G
Chapter 3Controlling ExecutionThere are several ways to control program execution from the <strong>RealView</strong> ® <strong>Debugger</strong>Code window. These are described in the following sections:• Submitting commands on page 3-2• Defining execution context on page 3-3• Using execution controls on page 3-7• Working with the Debug menu on page 3-11• Automating debugging operations on page 3-15• Searching for source files on page 3-19.<strong>ARM</strong> DUI 0153G Copyright © 2002-2005 <strong>ARM</strong> Limited. All rights reserved. 3-1
Controlling Execution3.1 Submitting commandsYou can submit commands to <strong>RealView</strong> <strong>Debugger</strong> to control debugging behavior inseveral ways, for example by choosing from the Debug menu, or by clicking on acontrol on the Debug toolbar, or by typing a command-line instruction at the prompt.If an application is currently executing, <strong>RealView</strong> <strong>Debugger</strong> uses a command queue tohandle those commands that cannot be executed immediately. Through this mechanism,commands build up on the queue and are then executed when resources becomeavailable. Commands are never executed out of order.If a command is currently executing and you request another action, the new commandis added to the queue and pends until it can be executed. A warning message isdisplayed, in the Output pane, to explain what is happening to the new command, forexample:> goCommand pended until execution stops. Use 'Cancel' to purge.If the application is still running, any additional commands you enter are then added tothe queue behind this pending command.The following notes apply to the command queue:• All commands are added to the queue if they cannot be executed immediately.• <strong>RealView</strong> <strong>Debugger</strong> appends unknown commands, and so possibly invalidcommands, to the command queue.• Breakpoints are set where possible, otherwise these commands also pend untilthey can be executed.• Known invalid commands, for example those that do not start with a letter, are notadded to the queue.Click the Cancel button on the Debug toolbar to clear, or purge, the most recent pendingcommand.3-2 Copyright © 2002-2005 <strong>ARM</strong> Limited. All rights reserved. <strong>ARM</strong> DUI 0153G
Controlling Execution3.2 Defining execution context<strong>RealView</strong> <strong>Debugger</strong> enables you to define the current execution context, and to changethis if required. You do this using:• Code views• Defining scope and context.3.2.1 Code viewsUse the File Editor pane to view source code during your debugging session. In theexample shown in Figure 2-3 on page 2-10, the File Editor pane contains three tabs:• the Dsm tab enables you to track program execution in the disassembly-levelview• the Src tab enables you to track program execution in the source-level view• the file tab dhry_1.c shows the name of the current source file in the editing, ornon-execution, view.Click on the relevant tab to toggle between the different code views.The Src tab acts like a button to display the current source if it is available. If the sourceis not available, <strong>RealView</strong> <strong>Debugger</strong> displays a No source message in the Src tabwindow.If you click on a tab, for example the Src tab, the source file containing the currentcontext is displayed. If the source file is not currently open, <strong>RealView</strong> <strong>Debugger</strong> opensthe file. If the statement where the PC is located is in view, a red box is drawn aroundthat statement to highlight it in the code view.3.2.2 Defining scope and context<strong>RealView</strong> <strong>Debugger</strong> uses scope to determine the value of a symbol. Scope shows how<strong>RealView</strong> <strong>Debugger</strong> accesses variables and finds symbols in expressions. The scopedetermines the execution context and defines how local variables are accessed. Anysymbol value available to a C or C++ program at the current PC is also available to<strong>RealView</strong> <strong>Debugger</strong>.When your program is executing, the PC stores the address of the current executionpoint. By default, the scope is set when the PC changes. Loading an image sets the PCat the entry point using autoscope, that is the PC defines the scope. Autoscope is alsoused in an assembly language routine when you step into code that has no sourceinformation. In this case, <strong>RealView</strong> <strong>Debugger</strong> shows the last calling function that hadvalid source in the Src tab.<strong>ARM</strong> DUI 0153G Copyright © 2002-2005 <strong>ARM</strong> Limited. All rights reserved. 3-3
Controlling Execution<strong>RealView</strong> <strong>Debugger</strong> uses a red box to highlight the location of the PC where this isvisible in the selected code view. The PC is only visible in an execution tab, that is theSrc or Dsm tab. However, if you force scope to a different location then this is identifiedby a filled blue arrow and the red box highlights the current context. This might not bethe true location of the PC. See Forcing scope for details.When <strong>RealView</strong> <strong>Debugger</strong> first loads an image, and assuming that you do not forcescope, the File Editor pane contains tabs showing program execution (described in Codeviews on page 3-3):• the Src tab shows the current context, that is the location of the PC at the entrypoint• the Dsm tab displays disassembled code with intermixed C/C++ source lines and,if available, the location of the PC.Locating the Program CounterYou can locate the PC using the following methods:• Select Debug → Show Line at PC to display the current location of the PC in theOutput pane. The line of code at the PC is also shown in the current view of theFile Editor pane.• Right-click on the background in the current view of the File Editor pane, andselect Scope to PC form the context menu. The line of code at the PC is shownin the current view of the File Editor pane, and the current context of the PC isdisplayed in the Output pane.• Select Debug → Show Context of PC to display the current context of the PC inthe Output pane.• Right-click on the background in the current view of the File Editor pane, andselect Scope Context form the context menu. The current context of the PC isdisplayed in the Output pane.Forcing scopeScope is forced when it is not set by the PC. To force the scope:1. Connect to your target and load an image, for example dhrystone.axf.2. Select Edit → Advanced → Show Line Numbers to display line numbers.This is not necessary but might help you to follow the examples.3. Click on the Src tab to view the source file dhry_1.c.3-4 Copyright © 2002-2005 <strong>ARM</strong> Limited. All rights reserved. <strong>ARM</strong> DUI 0153G
Controlling ExecutionThe PC is at the entry point at line 78, marked with a red box.4. Right-click at a location (line or address) in your execution view, for example line149 in the source file dhry_1.c.5. Select Scope To Here from the context menu.The forced scope is identified by a filled blue pointer at the chosen location. Thismoves the red box to highlight the current context.6. Select Debug → Show Context of PC to see the location of the PC in the Outputpane.7. Click High-level Step Into to step into the program on the Debug toolbar.8. Select Debug → Show Context of PC to see the location of the PC.To reset the PC to the entry point, either:• Select Debug → Set PC to Entry Point from the Code window main menu.• Click Set PC to Entry on the Image toolbar.If you reset the PC to the entry point, this issues a RESTART command but does not resetthe values of variables, reset the Stack Pointer (SP), or clear breakpoints.NoteYou can also scope to various parts of your application with the Data Navigator pane.See Using the Data Navigator pane on page 8-5 for details on how to use this pane.Setting disassembly formatWhen working in disassembly view, you can temporarily choose the display format foryour code view:1. Connect to your target and load an image, for example dhrystone.axf.2. Click on the Dsm tab.3. Right-click on whitespace inside the File Editor window to see the DisassemblyView context menu.4. Select Set Disassembly Format... from the context menu to see the DisassemblyMode selection box, shown in Figure 3-1 on page 3-6.<strong>ARM</strong> DUI 0153G Copyright © 2002-2005 <strong>ARM</strong> Limited. All rights reserved. 3-5
Controlling ExecutionFigure 3-1 Disassembly Mode selection boxUse this selection box to specify how disassembled code is displayed, If youchoose Auto-mode, the default format, <strong>RealView</strong> <strong>Debugger</strong> displays the code in aformat specified by the image contents.5. Select the required format and click OK to confirm your choice. Click Cancel toclose the selection box without changing the display format.You can use workspace settings to specify the format used for disassembly. For details,see the description of the DEBUGGER group (Disassembler settings) in Appendix AWorkspace Settings Reference.3-6 Copyright © 2002-2005 <strong>ARM</strong> Limited. All rights reserved. <strong>ARM</strong> DUI 0153G
Controlling Execution3.3 Using execution controlsThe Execution group, on the Debug toolbar, contains buttons to control the executionof the image loaded to your debug target. This section describes how to access executioncontrols:• Using the Execution group• Using shortcuts on page 3-9.NoteIn the following examples, loading the image dhrystone.axf places the PC at the entrypoint and not at the start of main(). <strong>RealView</strong> <strong>Debugger</strong> indicates the current context byhighlighting the location of the PC with a red box. Any subsequent stepping instructionsare based on this starting point.3.3.1 Using the Execution groupThe Execution group contains:RunClick this button to start from the current location of the PC and run untilthe program:• ends• encounters an error condition• reaches a breakpoint• reaches a halt condition.This option can also be used to resume program execution after stopping.Stop ExecutionClick this button to stop the program currently executing on the targetprocessor.If you are using semihosting with <strong>RealView</strong> <strong>ARM</strong>ulator ® ISS, you cannotuse the Stop Execution button during the semihosting input.High-level Step IntoClick this button to step by lines of source code until the PC is located inanother function or context. Normally, click this button to step up by onecall level, but, depending on the function stepped into, it might cause theprogram to execute until it reaches source code.If the source line makesa function call, <strong>RealView</strong> <strong>Debugger</strong> steps into the function, unless thereis no source code available for this function.<strong>ARM</strong> DUI 0153G Copyright © 2002-2005 <strong>ARM</strong> Limited. All rights reserved. 3-7
Controlling ExecutionTo see an example using this option:1. Connect to your target and load an image, for exampledhrystone.axf.2. Click on the Src tab to view the source file dhry_1.c.3. Select Edit → Advanced → Show Line Numbers to display linenumbers.This is not necessary but might help you to follow the examples.4. Display line 78.5. Set a default breakpoint by double-clicking on the line number inthe left margin.6. View the Output pane message:bi \DHRY_1\#78:27. Click Run and the program begins execution and runs up to thebreakpoint.The Output pane shows where execution stops.8. Click High-level Step Into once. A red box shows the location ofthe PC at line 91.9. Click High-level Step Into several times to move through the linesof source code.In this example, <strong>RealView</strong> <strong>Debugger</strong> completes two high-level steps atthe start. Therefore, the first high-level step takes the PC from the entrypoint to main(), and the second steps to after the function prolog.NoteYou can get to main() using Run (as described in this example) or a singlestep. The single step executes (from the high-level code) up to main().High-level Step OverClick this button to step by lines of source code over function calls.If the source line makes a call to a function, <strong>RealView</strong> <strong>Debugger</strong> executesthe function completely before stopping, assuming that there is nostopping condition in the function call, for example a breakpoint.Low-level Step IntoClick this button to step by instructions into functions. <strong>RealView</strong><strong>Debugger</strong> executes the assembly language instruction at the currentlocation of the PC.3-8 Copyright © 2002-2005 <strong>ARM</strong> Limited. All rights reserved. <strong>ARM</strong> DUI 0153G
Controlling ExecutionLow-level Step OverClick this button to step by instructions over function calls. <strong>RealView</strong><strong>Debugger</strong> executes the assembly instruction at the current location of thePC.If the assembly instruction makes a call to a function, <strong>RealView</strong><strong>Debugger</strong> executes the function completely before stopping, assumingthat there is no stopping condition in the function call, for example abreakpoint.Run until ReturnClick this button to start from the current PC in the current function andto run until it returns to the calling function.Run to CursorClick this button to start from the current location of the PC and to rununtil it reaches a temporary breakpoint, defined by the cursor position.NoteIn source code, repeated uses of low-level step commands might be necessary tocomplete execution if the source line contains multiple <strong>ARM</strong> ® instructions. Low-levelstep instructions, Low-level Step Into or Low-level Step Over, complete one assemblyinstruction at a time. This means that a call to a subroutine is treated as one instructionif you execute a step over.3.3.2 Using shortcutsThe controls in the Debug toolbar are independent of the current code view, that isclicking a button carries out the specified action regardless of whether you are insource-level view (the Src tab) or disassembly-level view (the Dsm tab). The Status lineat the bottom of the Code window gives a description of the action available from abutton.<strong>ARM</strong> DUI 0153G Copyright © 2002-2005 <strong>ARM</strong> Limited. All rights reserved. 3-9
Controlling ExecutionKeyboard shortcuts are available, shown in the Debug menu, depending on the currentcode view. These are summarized in Table 3-1.Code view Function key ActionTable 3-1 Keyboard shortcutsSource F10 Step by line over functionsSource F11 Step by line into functionsDisassembly F10 Step by instruction over functionsDisassembly F11 Step by instruction into functions3-10 Copyright © 2002-2005 <strong>ARM</strong> Limited. All rights reserved. <strong>ARM</strong> DUI 0153G
Controlling Execution3.4 Working with the Debug menuDebugging your application programs relies on being able to control the execution ofyour code on the debug target. You must then be able to examine the contents ofmemory, registers, or variables, possibly continue execution one instruction at a time,or specify other actions to examine in detail the execution history. The Code windowmain menu includes the Debug menu, which provides a starting point for manydebugging operations.3.4.1 Using the Debug menuThe Debug menu offers the options:RunWith an image loaded to the target processor, select this option to run theprogram, starting from the current location of the PC. This issues the GOcommand (see <strong>RealView</strong> <strong>Debugger</strong> v1.8 Command Line Reference <strong>Guide</strong>for details).Stop ExecutionSelect this option to stop the program currently executing on the targetprocessor.Set PC to Entry PointSets the PC to the entry point of the image. This issues the RESTARTcommand (see <strong>RealView</strong> <strong>Debugger</strong> v1.8 Command Line Reference <strong>Guide</strong>for details). This means that you can run the image again, without havingto do an image reload. Use this if you want to preserve:• any breakpoints and tracepoints that you have set• any sections or arguments that you loaded with the image.Reset Target ProcessorPerforms a processor reset operation on the current connection. Thisissues the RESET command (see <strong>RealView</strong> <strong>Debugger</strong> v1.8 Command LineReference <strong>Guide</strong> for details).The reset might be hard or soft depending on the processor type, see yourprocessor hardware documentation for details.Simulating a processor reset does not reset variables to their defaultsbecause memory is not re-initialized. The PC is reset.<strong>ARM</strong> DUI 0153G Copyright © 2002-2005 <strong>ARM</strong> Limited. All rights reserved. 3-11
Controlling ExecutionNoteThis option is not supported for Multi-ICE connections. You must use theMulti-ICE Server to perform a processor reset. See the Multi-ICE <strong>User</strong><strong>Guide</strong> for more details.Step IntoSteps execution, by lines of source code or assembler instructions, intofunctions. This behavior depends on the current code view, that iswhether you have selected the Src tab or the Dsm tab. This issues the STEPcommand (see <strong>RealView</strong> <strong>Debugger</strong> v1.8 Command Line Reference <strong>Guide</strong>for details).Step Over (next)Steps execution, by lines of source code or assembler instructions, overfunctions. This behavior depends on the current code view, that iswhether you have selected the Src tab or the Dsm tab. This issues theSTEPOVER command (see <strong>RealView</strong> <strong>Debugger</strong> v1.8 Command LineReference <strong>Guide</strong> for details).Run until ReturnSelect this option to run from the current PC until control returns from thecurrent function. This issues the GO @1 command (see <strong>RealView</strong> <strong>Debugger</strong>v1.8 Command Line Reference <strong>Guide</strong> for details of the GO command).Selecting this option stops execution at the assembler instructionimmediately after the return, and not the next statement. If you select theSrc tab, this has the effect that the red box indicating the position of thePC might be still located at the function call.Run to CursorWith an image loaded, you can scroll down the source or disassemblylisting and position the cursor on a specific line. Select Run to Cursor toexecute the program up to the temporary breakpoint at the cursor,assuming that no halting condition occurs first. This issues either a GOsource_line or GO address command depending on the current code view(see <strong>RealView</strong> <strong>Debugger</strong> v1.8 Command Line Reference <strong>Guide</strong> for detailsof the GO command).If you select the Src tab, the line marked by the cursor is enclosed in a redbox indicating the position of the PC.Click Run, or use a Step control, to resume execution.3-12 Copyright © 2002-2005 <strong>ARM</strong> Limited. All rights reserved. <strong>ARM</strong> DUI 0153G
Controlling ExecutionStep Until Condition...Displays a prompt where you can specify a condition, in the form of anexpression. When the condition is met, that is the condition is nonzero,execution halts.Click OK to run in single steps from the current location of the PC.<strong>RealView</strong> <strong>Debugger</strong> checks the condition after each step.Using this option causes execution to slow down and might result inerrors because of timing issues.BreakpointsThis provides access to the Breakpoints menu to use breakpoints in yourcode. You can set unconditional software breakpoints, conditionalsoftware breakpoints from the Conditional submenu, and hardwarebreakpoints from the Hardware submenu. You must use a debug targetthat supports hardware breakpoints. See Chapter 4 Working withBreakpoints for more details on using these menu options.TracepointsThis enables you to set tracepoints so that trace data can be captured.See the chapter that describes tracing in <strong>RealView</strong> <strong>Debugger</strong> v1.8Extensions <strong>User</strong> <strong>Guide</strong> for full details.Memory/Register OperationsThis enables you to examine memory and register contents duringexecution and to edit these interactively. In this way you have completecontrol over the way your application program runs. See Chapter 7Reading and Writing Memory, Registers, and Flash for more details onusing these menu options.Show Line at PCSelect this option to report the current module and procedure scope. Thisissues the SCOPE command (see <strong>RealView</strong> <strong>Debugger</strong> v1.8 Command LineReference <strong>Guide</strong> for details).Show Context of PCSelect this option to report the current context showing the current root,module, procedure, and line. This issues the CONTEXT command (see<strong>RealView</strong> <strong>Debugger</strong> v1.8 Command Line Reference <strong>Guide</strong> for details).Toggle Source/DisassemblySelect this option to toggle between the source-level view and thedisassembly-level view in the File Editor pane.<strong>ARM</strong> DUI 0153G Copyright © 2002-2005 <strong>ARM</strong> Limited. All rights reserved. 3-13
Controlling ExecutionSet Source Search Path...Use this to display the Project Properties window, where you can set thepath to enable <strong>RealView</strong> <strong>Debugger</strong> to find sources where the compiler orassembler does not pass source paths (see Searching for source files onpage 3-19 for details).3-14 Copyright © 2002-2005 <strong>ARM</strong> Limited. All rights reserved. <strong>ARM</strong> DUI 0153G
Controlling Execution3.5 Automating debugging operationsThe Tools menu includes options that enable you to automate debugger operations. Youcan use include files that contain CLI commands to perform the various debuggingoperations. You can create these files manually using a text editor, or by using thelogging facilities of <strong>RealView</strong> <strong>Debugger</strong>:• Creating log and journal files• Using include files on page 3-18.3.5.1 Creating log and journal files<strong>RealView</strong> <strong>Debugger</strong> writes log and journal output to a file saved in a specified location.If the file does not exist, <strong>RealView</strong> <strong>Debugger</strong> creates it. Where a file exists, <strong>RealView</strong><strong>Debugger</strong> gives you the option to append entries to the file, or to overwrite the currentcontents.Types of log and journal files<strong>RealView</strong> <strong>Debugger</strong> enables you to create the following files:Log filesDuring your debugging session, you can create a log file containing:• all the commands you enter• commands that are generated by the <strong>RealView</strong> <strong>Debugger</strong> GUI.You can then use this file as the basis of a command file or a macro. Bydefault, log files have the extension .log or .inc, but you can use anyextension for writing.STDIO files The STDIOlog log file enables you to keep a record of messages from thetarget, that is your application. This might be useful for controllingdebugging by running scripts without using the <strong>RealView</strong> <strong>Debugger</strong> userinterface. By default, these files have the extension .log, but you can useany extension for writing.Journal files A session journal file that contains all information including:• commands you enter• commands that are generated by the <strong>RealView</strong> <strong>Debugger</strong> GUI• any messages displayed in the Output pane• messages from your application.By default, journal files have the extension .jou, but you can use anyextension for writing.<strong>ARM</strong> DUI 0153G Copyright © 2002-2005 <strong>ARM</strong> Limited. All rights reserved. 3-15
Controlling ExecutionCreating a log file for use as an include fileTo create an log file for use as an include file, or to append to an existing log file:1. Select Tools → Logs and Journal → Log File... to display the Select File to Logto dialog box where the file can be located.2. Specify the pathname of the new log file, or locate a file created previously, forexample \home\my_user_name\my_log.log.3. Click Save to confirm the settings and close the dialog box.4. If the specified log file already exists, <strong>RealView</strong> <strong>Debugger</strong> displays the File Existsprompt.This gives you the option to append or replace. Click:• Yes to append new commands to those already saved in the file• No to replace, or overwrite, any commands already saved in the file• Cancel to close the prompt and discontinue the log file access.Output is now recorded automatically in the specified file, unless you choose to cancellogging.<strong>RealView</strong> <strong>Debugger</strong> shows that it is recording using the status display area at the bottomof the Code window, shown in Figure 3-2.Figure 3-2 Output files recordingClosing log and journal filesIf you are recording a log, or journal file and you try to start a new recording, <strong>RealView</strong><strong>Debugger</strong> gives you the option to close the current file so that a new file can be used.To close a log or journal file, select Tools → Logs and Journal → CloseLogs/Journals.... This displays a list selection box, shown in Figure 3-3 on page 3-17,where you can specify which file, or files, to close.3-16 Copyright © 2002-2005 <strong>ARM</strong> Limited. All rights reserved. <strong>ARM</strong> DUI 0153G
Controlling ExecutionFigure 3-3 Close log and journal files selection boxEach entry has an associated check box that is ticked by default. Select a check box tounselect a file. The list selection box contains:OKCancelHelpClick this button to close selected files and then close the selection box.Click this button to leave all files open and then close the selection box.Using Cancel ignores the status of any check boxes in the list.Click this button to display the online help for this selection box.Use the File Editor pane, or a text editor of your choosing, to view the contents of yourlog and journal files. You can then edit the commands shown in a log file to create aninclude file for use as a command file or as a macro.Creating log and journal files at start-upYou can start <strong>RealView</strong> <strong>Debugger</strong> and open a log or journal file for writing. Do this fromMS-DOS, or from a Command Prompt window, or create a desktop shortcut, forexample:rvdebug.exe -stdiolog "C:\rvd\test_files\STDIO_tst_file.log”rvdebug.exe -jou "C:\rvd\test_files\Jou_tst_file.jou”rvdebug.exe -log "C:\rvd\test_files\Log_tst_file.log”If the file does not exist, <strong>RealView</strong> <strong>Debugger</strong> creates it. Where the file exists, <strong>RealView</strong><strong>Debugger</strong> overwrites the current contents, without displaying a warning message.When <strong>RealView</strong> <strong>Debugger</strong> starts to write to the log file, it records the filename as thefirst entry, for example:;;;;LOG FILE: C:\rvd\test_files\my_log.log<strong>ARM</strong> DUI 0153G Copyright © 2002-2005 <strong>ARM</strong> Limited. All rights reserved. 3-17
Controlling Execution3.5.2 Using include files<strong>RealView</strong> <strong>Debugger</strong> enables you to use include files to enter commands and so carryout debugging tasks without user intervention. The commands are actioned as thoughthey are being entered from the keyboard.The following sections describe how to manage your debugging session using includefiles that are created using the logging facility, or scripts you create yourself:• Output buffering• Including files.Output bufferingIn the current release of <strong>RealView</strong> <strong>Debugger</strong>, output to the log files and journal files isbuffered. This means that all lines are not immediately flushed to the specified file. Tochange this, so that output to a file is unbuffered, set the JOULOG_UNBUF environmentvariable to any value.Including filesUse a text editor to create a file of commands that can then be submitted to <strong>RealView</strong><strong>Debugger</strong> to control a debugging session. To use an include file:1. Select Tools → Include Commands from File..., from the Code window, todisplay the Select File to Include Commands from dialog box.2. Locate the file where your debugger commands are stored. By default, <strong>RealView</strong><strong>Debugger</strong> looks for a .inc or a .log file.3. Click Open to load the file and execute the commands stored there.You can also start <strong>RealView</strong> <strong>Debugger</strong> with an include file, for example:rvdebug.exe -inc "C:\rvd\test_files\my_cmds_file.inc”3-18 Copyright © 2002-2005 <strong>ARM</strong> Limited. All rights reserved. <strong>ARM</strong> DUI 0153G
Controlling Execution3.6 Searching for source filesBy default <strong>RealView</strong> <strong>Debugger</strong> searches for application source file paths according toinformation contained in the image. If no paths are provided in the image, <strong>RealView</strong><strong>Debugger</strong> uses the list of directories specified in the project settings. If this fails, orwhere no search path has been specified, <strong>RealView</strong> <strong>Debugger</strong> looks in the currentworking directory for the source file or files.If you have loaded an image to a target, or where you have opened a user-definedproject, you can specify search paths using the Project Properties window. Any searchthat you define is then saved with the project settings and additionally used to locatesource files.This section includes:• Example of locating source files• Autoconfiguring search rules on page 3-20• Manually configuring search rules on page 3-21• Source path mappings on page 3-22.3.6.1 Example of locating source filesIn the following example, the image has been built in one directory and then moved toanother location for debugging. This means that <strong>RealView</strong> <strong>Debugger</strong> cannot locatesource files directly from information contained in the image:1. Ensure that the Project Properties window is not open. When searching for sourcefiles, <strong>RealView</strong> <strong>Debugger</strong> updates the project properties as necessary. This fails ifthe window is already open.2. Close any files that are open in the File Editor so that they are not found, andincluded, in the search mechanism.3. Connect to your target and load an image, for example dhry_thr_demo.axf.<strong>RealView</strong> <strong>Debugger</strong> creates an in-memory auto-project to use for this session,that is dhry_thr_demo.axf.apr.4. <strong>RealView</strong> <strong>Debugger</strong> cannot locate a source file and so displays the source searchprompt, shown in Figure 3-4 on page 3-20.<strong>ARM</strong> DUI 0153G Copyright © 2002-2005 <strong>ARM</strong> Limited. All rights reserved. 3-19
Controlling ExecutionFigure 3-4 Source search promptIf you close the prompt, for example by clicking Cancel, <strong>RealView</strong> <strong>Debugger</strong>warns you that it cannot locate the source file for the new image. The projectproperties are unchanged.You can change the search rules that <strong>RealView</strong> <strong>Debugger</strong> uses as described in thefollowing sections:• Autoconfiguring search rules• Manually configuring search rules on page 3-21.3.6.2 Autoconfiguring search rulesUse the source search prompt, shown in Figure 3-4, to autoconfigure the search rules:1. Either:• Edit the pathname shown in the prompt.• Click the directory button and use to locate the required file.2. Click Retry.If <strong>RealView</strong> <strong>Debugger</strong> fails to locate the file, the source search prompt remains for youto try again. If <strong>RealView</strong> <strong>Debugger</strong> succeeds, the source search prompt closesautomatically.NoteIf the required file is already listed when you click the directory button, select it toupdate the project properties. The source search prompt then closes automatically.Pathnames that you add this way automatically update the project properties for theactive project. Where your project is an in-memory auto-project, <strong>RealView</strong> <strong>Debugger</strong>also saves the project settings file, for example dhry_thr_demo.axf.apr, in the samelocation as the original image.3-20 Copyright © 2002-2005 <strong>ARM</strong> Limited. All rights reserved. <strong>ARM</strong> DUI 0153G
Controlling ExecutionNoteAbsolute pathnames are used to define the new search rules when you configure themin this way. However, if you modify the source search path yourself, pathnames becomerelative (see Manually configuring search rules for details).3.6.3 Manually configuring search rulesIf you have an open project, you can specify search paths using the Project Propertieswindow. Any search that you define is then saved with the project settings andadditionally used to locate source files.To configure the search rules manually:1. Select Project → Project Properties... to display the Project Properties window,shown in Figure 3-5.Figure 3-5 Search rules in the Project Properties windowFor more details on other entries in this window see Source path mappings onpage 3-22.2. Right-click on Source_search and use Edit as Directory Name... to specify thesearch path to locate the missing source file.3. Click File → Save and Close to confirm your choice and close the ProjectProperties window.Do not leave the Project Properties window open when you are working with thedebugger. When searching for source files, <strong>RealView</strong> <strong>Debugger</strong> updates theproject properties as necessary. This fails if the window is already open.<strong>ARM</strong> DUI 0153G Copyright © 2002-2005 <strong>ARM</strong> Limited. All rights reserved. 3-21
Controlling ExecutionNoteRelative pathnames are used to define the new search rules when you configure them inthis way.3.6.4 Source path mappingsWhen you use the directory button to locate the source file, using the prompt shown inFigure 3-4 on page 3-20, <strong>RealView</strong> <strong>Debugger</strong> creates a mapping between the originalfile and the new location. This mapping is then applied to subsequent file searches sothat the debugger can locate files automatically that have the same mapping.Pathname remappings are stored in the project settings so that they can be used in thenext session.NoteWhere your project is an in-memory auto-project, <strong>RealView</strong> <strong>Debugger</strong> automaticallysaves the auto-project if you set up a new pathname mapping.See the chapter that describes customizing projects in <strong>RealView</strong> <strong>Debugger</strong> v1.8 ProjectManagement <strong>User</strong> <strong>Guide</strong> for full details on working with these entries.3-22 Copyright © 2002-2005 <strong>ARM</strong> Limited. All rights reserved. <strong>ARM</strong> DUI 0153G
Chapter 4Working with BreakpointsThis chapter explains the different types of breakpoints supported by <strong>RealView</strong> ®<strong>Debugger</strong>, describes the options for setting breakpoints, and explains how to managebreakpoints during your debugging session. It includes the following sections:• Breakpoints in <strong>RealView</strong> <strong>Debugger</strong> on page 4-2• Setting default breakpoints on page 4-15• Generic breakpoint operations on page 4-20• Setting unconditional breakpoints explicitly on page 4-21• Setting hardware breakpoints explicitly on page 4-24• Specifying processor exceptions (global breakpoints) on page 4-33• Setting conditional breakpoints on page 4-34• Using the Set Address/Data Breakpoint dialog box on page 4-41• Attaching macros to breakpoints on page 4-56• Controlling the behavior of breakpoints on page 4-59• Using the Break/Tracepoints pane on page 4-63• Disabling and clearing breakpoints on page 4-72• Setting breakpoints from saved lists on page 4-74.<strong>ARM</strong> DUI 0153G Copyright © 2002-2005 <strong>ARM</strong> Limited. All rights reserved. 4-1
Working with Breakpoints4.1 Breakpoints in <strong>RealView</strong> <strong>Debugger</strong>Breakpoints are specified locations where execution must stop. The breakpoint can betriggered by:• execution reaching the specified address• data reads or writes at a specified address or address range• breakpoint qualifiers passing specified test criteria• data values at the specified location, in the current context, becoming equal to aparticular value or range.When a breakpoint triggers, <strong>RealView</strong> <strong>Debugger</strong> can carry out higher level requests. Forexample you can:• attach macros to breakpoints• output messages• update windows or files• change the behavior of your application program.You can also continue execution of your application program after <strong>RealView</strong> <strong>Debugger</strong>completes the specified operations.This section describes:• Breakpoint types• Qualifying breakpoint line number references with module names on page 4-7• Specifying address ranges on page 4-7• Specifying the entry point to a function on page 4-8• Breakpoints and memory map locations on page 4-9• Viewing breakpoints in your code view on page 4-10• Halted System Debug and Running System Debug on page 4-12• Using hardware breakpoints on page 4-13• Breakpoints and image restarts on page 4-14• Using breakpoints with <strong>RealView</strong> ICE on page 4-14.4.1.1 Breakpoint types<strong>RealView</strong> <strong>Debugger</strong> enables you to use different types of breakpoint when you aredebugging your image, described in:• Software and hardware breakpoints on page 4-3• Unconditional and conditional breakpoints on page 4-4• Default breakpoints in the GUI on page 4-54-2 Copyright © 2002-2005 <strong>ARM</strong> Limited. All rights reserved. <strong>ARM</strong> DUI 0153G
Working with Breakpoints• Recording the triggering of a breakpoint on page 4-6.The type of breakpoint you can set depends on the:• memory map, if enabled• qualifiers assigned to the breakpoint• hardware support provided by your target processor• target vehicle used to maintain the connection.<strong>RealView</strong> <strong>Debugger</strong> uses breakpoints to temporarily halt execution as you step throughyour application. For more details about stepping through code, see Using executioncontrols on page 3-7.Software and hardware breakpoints<strong>RealView</strong> <strong>Debugger</strong> enables you to set software or hardware breakpoints, depending onthe target and the chosen memory location (see Breakpoints and memory map locationson page 4-9):SoftwareThese breakpoints are controlled by <strong>RealView</strong> <strong>Debugger</strong> directly. Whenyou set a software breakpoint <strong>RealView</strong> <strong>Debugger</strong> modifies theexecutable instructions held in RAM. Therefore, you can only setsoftware breakpoints for code stored in RAM.You can set as many software breakpoints as you require.NoteIf you enable a Memory Management Unit (MMU) that is configured toset the region of memory containing a breakpoint to read-only, then thebreakpoint cannot be removed. In this case, you must make sure you clearthe breakpoints before enabling the MMU.HardwareHardware breakpoints use advanced hardware support on your targetprocessor, or as implemented by your simulator software. Thecomplexity and number of breakpoints you can set depends on:• hardware support provided by your target processor• target vehicle used to maintain the connection.Hardware breakpoints are controlled by the EmbeddedICE ® module ofyour target, which can be physical hardware or a software model.Note<strong>RealView</strong> <strong>Debugger</strong> reserves one breakpoint unit for internal use and sothis might not be available to you. You are warned if you try to set ahardware breakpoint when the limit is reached.<strong>ARM</strong> DUI 0153G Copyright © 2002-2005 <strong>ARM</strong> Limited. All rights reserved. 4-3
Working with BreakpointsAll <strong>ARM</strong> ® architecture-based processors provide basic hardwarebreakpoint support. This enables you to test address-specific data values.Where advanced hardware support is available on your target processor,or as implemented by your simulator software (for example RVISS), youcan set more complex hardware breakpoints. These breakpoints might bedata-dependent or take advantage of range functionality. For example,some processors enable you to chain two breakpoints together, so that thebreak triggers only when the conditions of both breakpoints are met.Check your hardware characteristics, and your vendor-supplieddocumentation, to determine the level of support available for hardwarebreakpoints. Also, see Viewing your hardware breakpoint support onpage 4-13.NoteFor RVISS, only the <strong>RealView</strong> Connection Broker interface supportshardware breakpoints.Unconditional and conditional breakpointsSoftware and hardware breakpoints are classified depending on the qualifiers that youassign to the breakpoint:UnconditionalA breakpoint is unconditional when no condition qualifier is assigned tothe breakpoint. However, you can:• Assign one or more actions to an unconditional breakpoint. Whenthe breakpoint is triggered, the specified action is performed (seeSetting unconditional breakpoints in other ways on page 4-22).• Choose whether it is a software or hardware breakpoint, dependingon the memory region (see Breakpoints and memory map locationson page 4-9).For an unconditional breakpoint, the program always stops if executionreaches a specified location.Default breakpointsYou can set an unconditional breakpoint that has no actionsassigned to it, and without explicitly choosing whether it is asoftware or hardware breakpoint. This is called a defaultbreakpoint, and either <strong>RealView</strong> <strong>Debugger</strong> or your target4-4 Copyright © 2002-2005 <strong>ARM</strong> Limited. All rights reserved. <strong>ARM</strong> DUI 0153G
Working with Breakpointshardware determines whether a software or hardwarebreakpoint is set (see Setting default breakpoints onpage 4-15).Conditional A breakpoint is conditional when a condition qualifier is assigned to thebreakpoint. The conditions that must be satisfied can be defined based ondata values, the result of a macro, or on counters.The program stops if execution reaches a specified location and one ormore of the predefined conditions are met (see Setting conditionalbreakpoints on page 4-34).If you want to use multiple conditions, see Controlling the behavior ofbreakpoints on page 4-59 for details on how the order of conditionalqualifiers affects the behavior of a breakpoint.NoteAlthough hardware breakpoints can have conditions controlled inhardware, they are not conditional in <strong>RealView</strong> <strong>Debugger</strong>. Onlybreakpoints that have condition qualifiers assigned are identified asconditional by <strong>RealView</strong> <strong>Debugger</strong>.Default breakpoints in the GUIA default breakpoint is set by <strong>RealView</strong> <strong>Debugger</strong> when you do not explicitly choose aspecific type of breakpoint. For example, a default breakpoint is set when youdouble-click in the margin of the Dsm tab or a source code tab of the File Editor pane.A default breakpoint does not have any condition qualifiers or actions, and so is alwaysan unconditional breakpoint. However, the chosen memory location where you set thebreakpoint determines whether it is a software or hardware breakpoint (see Breakpointsand memory map locations on page 4-9).The command used by <strong>RealView</strong> <strong>Debugger</strong> to set a default breakpoint depends on thetype:• To set a default software breakpoint, <strong>RealView</strong> <strong>Debugger</strong> uses theBREAKINSTRUCTION command. For example, to set a default breakpoint at the RAMaddress 0x00008008, <strong>RealView</strong> <strong>Debugger</strong> issues the command:binstr (I A)0x00008008• To set a default hardware breakpoint, <strong>RealView</strong> <strong>Debugger</strong> uses theBREAKEXECUTION command. For example, if you set a default breakpoint at theIntegrator /AP Flash address 0x24000008, <strong>RealView</strong> <strong>Debugger</strong> issues thecommand:<strong>ARM</strong> DUI 0153G Copyright © 2002-2005 <strong>ARM</strong> Limited. All rights reserved. 4-5
Working with Breakpointsbexec (I A)0x24000008NoteIn some instances, <strong>RealView</strong> <strong>Debugger</strong> might attempt to set a software breakpoint, butyour target hardware might set a hardware breakpoint instead. In this case, thebreakpoint information in the Break/Tracepoints pane might show Exec in thebreakpoint title, but the bi command (BREAKINSTRUCTION) for the command used to setthe breakpoint.If you attempt to set a default breakpoint in a data or literals area of code within the Dsmtab, the breakpoint is set and <strong>RealView</strong> <strong>Debugger</strong> issues the warning:Warning: Breakpoint being set in data/literals of code.For more details about these commands, see the <strong>RealView</strong> <strong>Debugger</strong> v1.8 CommandLine Reference <strong>Guide</strong>.For detailed instructions on setting default breakpoints, see Setting default breakpointson page 4-15.NoteDefault breakpoints are not added to the breakpoint history (see Setting breakpointsfrom saved lists on page 4-74).Recording the triggering of a breakpointWhen a breakpoint triggers and program execution stops, <strong>RealView</strong> <strong>Debugger</strong> recordsthis by displaying messages that identify the type and location of the breakpoint, forexample:Stopped at 0x00008498 due to SW Instruction BreakpointStopped at 0x00008498: DHRY_1\main Line 153If you specify that execution is to continue after the breakpoint is triggered, then thesemessages are not displayed.If you want program execution to continue when a breakpoint is triggered, and still beinformed when this occurs, then:1. Assign a macro to the breakpoint that outputs appropriate messages and returns avalue of zero.2. Assign the continue command qualifier to the breakpoint.See Controlling the behavior of breakpoints on page 4-59 for more details.4-6 Copyright © 2002-2005 <strong>ARM</strong> Limited. All rights reserved. <strong>ARM</strong> DUI 0153G
Working with Breakpoints4.1.2 Qualifying breakpoint line number references with module namesIf you want to set a breakpoint in a source file that contains the line of code pointed toby the PC, you can specify only a line number in the file. For example, using theBREAKINSTRUCTION command you can set a breakpoint at column 2 of line 92 in thedhry_1.c source file with:breakinstruction #92:2However, if you want to set a breakpoint in another source file associated with theloaded image, you must qualify the line number reference with the module name.Module naming conventionsFor sources with the .c or .cpp extension, the module name is the source filenamewithout the extension. If the extension is not .c or .cpp, the extension is preserved, andthe dot is replaced with an underscore. All module names are converted to uppercase by<strong>RealView</strong> <strong>Debugger</strong>. Therefore, you must specify module names in uppercase. Forexample, sample_arm.c is converted to SAMPLE_<strong>ARM</strong>, and sample_arm.s is converted toSAMPLE_<strong>ARM</strong>_S.If two modules have the same name then <strong>RealView</strong> <strong>Debugger</strong> appends an underscorefollowed by a number to the second module, for example SAMPLE_<strong>ARM</strong>_1. Additionalmodules are numbered sequentially, for example, if there is a third module this becomesSAMPLE_<strong>ARM</strong>_2.Following this convention avoids any confusion with the C dot operator indicating astructure reference.For example, to set a breakpoint at line 48 in the file dhry_2.c for the imagedhrystone.axf, enter:breakinstruction \DHRY_2\#48:14.1.3 Specifying address rangesHardware breakpoints enable you to specify a range of addresses. You specify anaddress range using either of the following formats:start_addr..end_addrStart address and an absolute end address, for example:0x10000..0x20000start_addr..+lengthStart address and length of the address region, for example:<strong>ARM</strong> DUI 0153G Copyright © 2002-2005 <strong>ARM</strong> Limited. All rights reserved. 4-7
Working with Breakpoints0x10000..+0x10000In both cases, the start and end values are inclusive.You can also use symbol names, such as function names, as the start address. Forexample:main..+1000 Arr_2_Glob..+644.1.4 Specifying the entry point to a functionYou can set a breakpoint at the entry point of a function with the @entry symbol. Thisenables you to set a breakpoint on a function without having to open the source filecontaining that function, and without having to scroll down the Dsm tab to find it.To set a breakpoint on the entry to a function, specify function\@entry. This identifiesthe first location in the function after the code that sets up the function parameters. Ingeneral, function\@entry refers to either:• the first executable line of code in that function• the first auto local that is initialized in that function.If no lines exist that set up any parameters for the function (for example, an embeddedassembler function), then the following error message is displayed:Error: E0039: Line number not found.As an example, if you have a function func_1(value) you might want to set a breakpointthat triggers only when the argument value has a specific value on entry to the function:bi,when:{value==2} func_1\@entryNoteThis is different to specifying a function name without the @entry qualifier. Forexample, in the dhrystone.axf example image:• specifying main sets a breakpoint at 0x000083D0, the first address in the function(line 78 in dhry_1.c)• specifying main\@entry sets a breakpoint at 0x000083D8, which is the first line ofexecutable code (line 91 in dhry_1.c).4-8 Copyright © 2002-2005 <strong>ARM</strong> Limited. All rights reserved. <strong>ARM</strong> DUI 0153G
Working with Breakpoints4.1.5 Breakpoints and memory map locationsWith memory mapping enabled, <strong>RealView</strong> <strong>Debugger</strong> sets a breakpoint based on theaccess rule for the memory at the chosen location. Table 4-1 shows the different typesof location that you can define in a memory map with <strong>RealView</strong> <strong>Debugger</strong>, and the typeof breakpoint that <strong>RealView</strong> <strong>Debugger</strong> sets by default.Table 4-1 Breakpoint types for different memory map locationsLocationRAMROMFlashWrite-only Memory (WOM)No Memory (NOM)AutoBreakpoint type setSoftwareHardwareHardware<strong>RealView</strong> <strong>Debugger</strong>prompts youHardwareHardwareIf you have to, you can set a hardware breakpoint in RAM. To do this, you must use oneof the methods described in Setting hardware breakpoints explicitly on page 4-24.<strong>RealView</strong> <strong>Debugger</strong> cannot determine the type of default breakpoint to set in WOMmemory, and displays the Set Address/Data Breakpoint dialog box (see Displaying theSet Address/Data Breakpoint dialog box on page 4-41). This dialog box is alsodisplayed if an error occurs when you attempt to set a breakpoint.If you attempt to set a software breakpoint at an address in Flash, ROM, NOM, or Automemory, a hardware breakpoint is set instead. If the target vehicle informs <strong>RealView</strong><strong>Debugger</strong> that a hardware breakpoint is being used, <strong>RealView</strong> <strong>Debugger</strong> warns you thatthis has happened:Warning: Failed to set Software Break - used Hardware Break instead (read-onlymemory?).For more details about memory mapping, see Chapter 5 Memory Mapping.<strong>ARM</strong> DUI 0153G Copyright © 2002-2005 <strong>ARM</strong> Limited. All rights reserved. 4-9
Working with Breakpoints4.1.6 Viewing breakpoints in your code viewBreakpoints are marked in the source-level and disassembly-level view in the graymargin, at the left side of the window. Standard software and hardware breakpoints areidentified by a disc icon, which is color-coded to reflect the type (see Breakpoint typeson page 4-2) and status of the breakpoint:RedYellowWhiteA red icon shows that you have set an unconditional breakpoint, and thatthe breakpoint is enabled.A yellow icon shows that you have set a conditional breakpoint, and thatthe breakpoint is enabled. The conditions are software conditions that arecontrolled by <strong>RealView</strong> <strong>Debugger</strong>. Although hardware breakpoints canhave conditions that are controlled in hardware, only when the softwareconditions are assigned are these breakpoints conditional in <strong>RealView</strong><strong>Debugger</strong>.A white icon shows that you have disabled an existing breakpoint. Whenyou re-enable the breakpoint, the icon changes back to the color it hadbefore the breakpoint was disabled.This color coding is also reflected in the Break/Tracepoints pane.NoteHardware access, read, and write breakpoints are not shown in the File Editor pane,because there is no specific line or context to display them.If you try to set a breakpoint on a non-executable line, <strong>RealView</strong> <strong>Debugger</strong> looks for thefirst executable line immediately following and places the breakpoint there. If the linespreceding the breakpointed instruction are comments, declarations, or othernon-executable code, they are marked with black, downward pointing arrows. Linesmarked in this way are regarded as part of the breakpoint.Multiple breakpoints units on a single lineIf you have set multiple breakpoint units on a source line containing multiple statementsor on inline functions, then disabling the first breakpoint unit changes the marker disc,shown in Figure 4-1 on page 4-11. If you disable the second breakpoint unit on the line,the marker remains.4-10 Copyright © 2002-2005 <strong>ARM</strong> Limited. All rights reserved. <strong>ARM</strong> DUI 0153G
Working with BreakpointsFigure 4-1 Working with multiple breakpoint unitsSee Using the Break/Tracepoints pane on page 4-63 for details on viewing breakpointsin the Break/Tracepoints pane.You cannot place two breakpoints of the same type at the same line or on lines markedby downward pointing arrows. For example, you cannot set two software breakpointson the same line.Clearing breakpoints quicklyWith a breakpoint visible in your current code view, you can clear it quickly bydouble-clicking on the marker icon in the margin. This removes the breakpoint you set.NoteWhere you have set multiple breakpoint units, clearing a breakpoint this way removesonly the first breakpoint unit.<strong>ARM</strong> DUI 0153G Copyright © 2002-2005 <strong>ARM</strong> Limited. All rights reserved. 4-11
Working with BreakpointsOther types of breakpointsIf you have set thread breakpoints, these are shown as different types of marker usingicons as shown in Table 4-2. See Halted System Debug and Running System Debug onpage 4-12, and <strong>RealView</strong> <strong>Debugger</strong> v1.8 Extensions <strong>User</strong> <strong>Guide</strong> for details of usingthese features.Table 4-2 Other breakpoint/tracepoint iconsIconBreakpoint/Tracepoint typeHSD breakpointRSD Thread breakpointRSD System breakpoint4.1.7 Halted System Debug and Running System Debug<strong>RealView</strong> <strong>Debugger</strong> supports different debugging modes:Halted System DebugHalted System Debug (HSD) means that you can only debug a targetwhen it is not running. This means that you must stop your debug targetbefore carrying out any analysis of your system. This debugging modeplaces no demands on the application running on the target.HSD is always available as part of the <strong>RealView</strong> <strong>Debugger</strong> base product.Running System DebugRunning System Debug (RSD) means that you can debug a target when itis running. This means that you do not have to stop your debug targetbefore carrying out any analysis of your system.RSD is only available where supported by your debug target. It relies onhaving <strong>RealView</strong> <strong>Debugger</strong> RTOS extensions installed and is notprovided as part of the base product.RSD gives access to the application using a Debug Agent (DA) thatresides on the target and is typically considered to be part of the RTOS.The Debug Agent is scheduled along with other tasks in the system.Where RSD is supported, <strong>RealView</strong> <strong>Debugger</strong> enables you to switch seamlesslybetween RSD and HSD mode using GUI controls or CLI commands.4-12 Copyright © 2002-2005 <strong>ARM</strong> Limited. All rights reserved. <strong>ARM</strong> DUI 0153G
Working with BreakpointsFor full details on using RTOS extensions and running in RSD mode, see the chapterthat describes RTOS support in <strong>RealView</strong> <strong>Debugger</strong> v1.8 Extensions <strong>User</strong> <strong>Guide</strong>.4.1.8 Using hardware breakpointsSetting a software breakpoint requires that the debugger changes executableinstructions, so this is only possible for code stored in RAM. Where instructions are inFlash or ROM, you must set hardware breakpoints.The number of hardware breakpoints available depends on your debug target. If<strong>RealView</strong> <strong>Debugger</strong> cannot set breakpoints, a warning message is displayed and rapidinstruction step is used for high-level stepping. Again, a warning message is displayedto explain the type of step being used.Be aware of the following when working with hardware breakpoints with <strong>RealView</strong><strong>ARM</strong>ulator ® ISS (RVISS):• Watchpoints are available. These are called hardware breakpoints in <strong>RealView</strong><strong>Debugger</strong>. You can access them through the Debug → Breakpoints →Hardware menu. These data access breakpoints are implemented using amemory hook.• Hardware breakpoints can use address ranges (see Specifying address ranges onpage 4-7), data values, and data value range tests. They can also include size tests,mode tests, and pass counts.• Hardware breakpoints can be chained to form complex tests.To use hardware breakpoints, your debug target must include support for suchbreakpoints. Even where this support is available, your target might be limited in thenumber it can support at one time. <strong>RealView</strong> <strong>Debugger</strong> menu options related tohardware breakpoints are grayed out if your target cannot support them or if no moreare available.Viewing your hardware breakpoint supportTo see your hardware support for breakpoints, select the following option from the Codewindow main menu:Debug → Breakpoints → Hardware → Show Break Capabilities of HW...This displays an information box describing the support available for your targetprocessor, shown in Figure 4-2.<strong>ARM</strong> DUI 0153G Copyright © 2002-2005 <strong>ARM</strong> Limited. All rights reserved. 4-13
Working with BreakpointsFigure 4-2 Example hardware break characteristicsWhat is shown in this details display depends on the target processor and the targetvehicle used to make the connection. Figure 4-2 shows the details for an <strong>ARM</strong>940Tusing Multi-ICE ® .Note<strong>RealView</strong> <strong>Debugger</strong> reserves one breakpoint unit for internal use and so this might notbe available to you. You are warned if you try to set a hardware breakpoint when thelimit is reached.4.1.9 Breakpoints and image restartsWhen your image stops executing, either by manual intervention or by terminatingnaturally, the PC no longer points to the image entry point. If you want to restart theimage again from the image entry point, you can use one of the following methods:• unload the image, then load it again (two-step operation)• reload the image (single-step operation)• set the PC to the image entry point.However, if you have set any breakpoints or tracepoints, the first method causes themto be cleared. If you want to preserve any existing breakpoints and tracepoints, then useeither of the other methods. See Chapter 3 Controlling Execution for more details.4.1.10 Using breakpoints with <strong>RealView</strong> ICEIf you are using <strong>RealView</strong> ICE, <strong>RealView</strong> <strong>Debugger</strong> sets breakpoints differently. Forfull details on debugging with <strong>RealView</strong> ICE, see <strong>RealView</strong> ICE <strong>User</strong> <strong>Guide</strong>.4-14 Copyright © 2002-2005 <strong>ARM</strong> Limited. All rights reserved. <strong>ARM</strong> DUI 0153G
Working with Breakpoints4.2 Setting default breakpointsYou can set a default breakpoint directly from the Code window (see Defaultbreakpoints in the GUI on page 4-5). The methods you can use to do this depend onyour current code view. A default breakpoint is a useful way to set a quick test pointduring a debugging session.The type of default breakpoint set, either software or hardware, is determined by thechosen memory location (see Breakpoints and memory map locations on page 4-9).NoteDefault breakpoints are not added to the breakpoint history (see Setting breakpointsfrom saved lists on page 4-74).This section describes:• Default breakpoints in source-level view on page 4-16• Default breakpoints in disassembly-level view on page 4-17• Setting breakpoints on branch instructions on page 4-18• Setting default breakpoints in other ways on page 4-19.In these examples, Text Coloring is enabled by default. To turn on line numbering,select the following option from the Code window main menu:Edit → Advanced → Show Line NumbersNoteThis menu option is effective only for the current debugging session. If you want toshow line numbers by default when you start <strong>RealView</strong> <strong>Debugger</strong>, change theLine_number setting in the workspace settings (see Edit on page A-12).<strong>ARM</strong> DUI 0153G Copyright © 2002-2005 <strong>ARM</strong> Limited. All rights reserved. 4-15
Working with Breakpoints4.2.1 Default breakpoints in source-level viewDouble-click in the margin, that is the gray area to the left of a line, to set a defaultbreakpoint quickly, shown in Figure 4-3. You can also double-click on the line numberif this is visible.Figure 4-3 Setting an unconditional breakpoint on a lineThis example sets a default software breakpoint marked by a red disc in the margin.Setting a breakpoint on a multi-statement lineIf you want to set a default breakpoint on a multi-statement line, for example on a for...loop, right-click on the statement to display either the Variable or Symbol contextmenu, and select Set Break on Statement.Setting a breakpoint on a symbolIf you want to set a breakpoint on a symbol, right-click on the symbol (for example, afunction name) to display the Symbol context menu, and select Set Break On. You canview the currently defined symbols with the PRINTSYMBOL command, described in the<strong>RealView</strong> <strong>Debugger</strong> v1.8 Command Line Reference <strong>Guide</strong>.NoteThe options you can use on the Variable context menu and Symbol context menudepend on which part of the statement you right-click.4-16 Copyright © 2002-2005 <strong>ARM</strong> Limited. All rights reserved. <strong>ARM</strong> DUI 0153G
Working with BreakpointsSetting a breakpoint in the body of a functionYou can also use this option to set a breakpoint in the body of a function byright-clicking on the call to the function. For example:1. Locate line 156 in dhry_1.c.2. Right-click on the function name Func_2.3. Select Set Break On from the Symbol context menu, to set the breakpoint.4. Right-click on the function name Func_2 again.5. Select Scope To from the Symbol context menu.<strong>RealView</strong> <strong>Debugger</strong> opens the source dhry_2 at the function Func_2, and shows thebreakpoint set at line 143.Effects of setting a breakpointSetting a breakpoint updates the Break/Tracepoints pane, if it is visible, and the Outputpane shows the breakpoint command, for example:bi \DHRY_1\ #146:3Setting breakpoints in source-level view inserts a software instruction breakpoint bydefault. This is set using a BREAKINSTRUCTION command. <strong>RealView</strong> <strong>Debugger</strong> attempts toset a software breakpoint where the code is in RAM.If your code is in ROM or Flash, <strong>RealView</strong> <strong>Debugger</strong> sets a hardware breakpoint whereone is available. This is set using a BREAKEXECUTION command. An error message isdisplayed if no such breakpoint is available.See Using the Break/Tracepoints pane on page 4-63 for details on viewing breakpointsin the Break/Tracepoints pane.NoteFor details of the BREAKINSTRUCTION and BREAKEXECUTION commands see <strong>RealView</strong><strong>Debugger</strong> v1.8 Command Line Reference <strong>Guide</strong>.4.2.2 Default breakpoints in disassembly-level viewTo set a default breakpoint quickly, double-click on the margin to the left of the requiredinstruction in the Dsm tab.<strong>ARM</strong> DUI 0153G Copyright © 2002-2005 <strong>ARM</strong> Limited. All rights reserved. 4-17
Working with Breakpoints4.2.3 Setting breakpoints on branch instructionsTo set a default breakpoint on the destination of a branch instruction:1. Locate the required branch instruction in the Dsm tab.2. Right-click on the destination address specified in the branch instruction todisplay the Instruction context menu.NoteIf you right-click on the background, the File Editor context menu is displayed.You must right-click on the text of the instruction, or its address, to display theInstruction context menu. Also, the options you can use on the Instructioncontext menu depend on which part of the instruction you right-click.3. Select Set Instr Break from the Instruction context menu.The breakpoint is set on the instruction at the specified branch address, shown inFigure 4-4.Figure 4-4 Setting an unconditional breakpoint on an instruction4. The Break/Tracepoints pane is updated with the new breakpoint (if visible) andthe Output pane shows the breakpoint command:bi 0x81c4NoteIf the location where the breakpoint is set is not currently visible, right-click on thebranch address and select Scope To from the Symbol context menu to view the location.As with the source-level view, <strong>RealView</strong> <strong>Debugger</strong> sets a software or hardwarebreakpoint depending on where your program is stored and what breakpoints areavailable.See Using the Break/Tracepoints pane on page 4-63 for details on viewing breakpointsin the Break/Tracepoints pane.4-18 Copyright © 2002-2005 <strong>ARM</strong> Limited. All rights reserved. <strong>ARM</strong> DUI 0153G
Working with Breakpoints4.2.4 Setting default breakpoints in other ways<strong>RealView</strong> <strong>Debugger</strong> includes other ways to set default breakpoints and manipulateexisting ones:• Use one of the generic breakpoint operations described in Generic breakpointoperations on page 4-20.• Use drag-and-drop to create a breakpoint in the Break/Tracepoints pane based ona program item. For example, highlight a source code function in the File Editorpane and then drag it (using your mouse) and drop it into the Break/Tracepointspane (see Using the Break/Tracepoints pane on page 4-63 for details).• Right-click in the left margin of the File Editor pane, and select Set Break fromthe context menu.• Right-click on a function in the Functions tab of the Data Navigator pane, andselect Break from the context menu. See Using the Data Navigator pane onpage 8-5 for more details on working with the Data Navigator pane.<strong>ARM</strong> DUI 0153G Copyright © 2002-2005 <strong>ARM</strong> Limited. All rights reserved. 4-19
Working with Breakpoints4.3 Generic breakpoint operationsThe Debug → Breakpoints menu enables you to complete certain breakpointoperations that are common to all breakpoints:Toggle Break at CursorToggles a breakpoint at the address defined by the position of the cursorin your code view:• If no breakpoint exists at the address, a new default breakpoint iscreated (see Default breakpoints in the GUI on page 4-5).• If a breakpoint already exists at the address, it is cleared.Enable/Disable Break at CursorEnables or disables a breakpoint at the address defined by the position ofthe cursor in your code view:• If an enabled breakpoint already exists at the address, it is disabled.• If a disabled breakpoint already exists at the address, it is enabled.• If no breakpoint exists at the address, a new default breakpoint iscreated (see Default breakpoints in the GUI on page 4-5).Clear All Break/TracepointsClears all breakpoints, and tracepoints, that you have set on the currenttarget.See Disabling and clearing breakpoints on page 4-72 for more details of disabling andclearing breakpoints.4-20 Copyright © 2002-2005 <strong>ARM</strong> Limited. All rights reserved. <strong>ARM</strong> DUI 0153G
Working with Breakpoints4.4 Setting unconditional breakpoints explicitlyYou can set an unconditional breakpoint explicitly using one of the following methods:• use the Simple Break if X dialog box (see Using the Simple Break if X dialog box)• use the Set Address/Data Breakpoint dialog box without assigning any qualifiers(see Using the Set Address/Data Breakpoint dialog box on page 4-41).4.4.1 Using the Simple Break if X dialog boxThe Simple Break if X dialog box enables you to set an unconditional software orhardware breakpoint, depending on the memory location.To display this dialog box, shown in Figure 4-5, use one of the following methods:• Select the following option from the Code window main menu:Debug → Breakpoints → Conditional → Break if X...• Right-click on the margin, an instruction, or line of source code in the File Editorpane, and select Set BreakIf... from the context menu. Then select Break if X...from the List Selection dialog box, and click OK.• Using the Break/Tracepoints pane, either:— select Set BreakIf... from the Pane menu— right-click on the pane background, and select Set BreakIf... from thecontext menu.Then select Break if X... from the List Selection dialog box, and click OK.Figure 4-5 Simple Break if X dialog boxThe Breakpoint Type controls the type of memory, program, or data, and the type ofaccess that stops execution. In this case, this shows SW Instr as the given type. Thisfield is set to read-only where this is the only type of breakpoint supported by yourdebug target.If your target supports hardware breakpoints, click on the drop-down arrow to displaya list of the available types.<strong>ARM</strong> DUI 0153G Copyright © 2002-2005 <strong>ARM</strong> Limited. All rights reserved. 4-21
Working with BreakpointsSpecify the location to break on. This can be:• a specific line number in the source code, with or without a module name prefix(see Qualifying breakpoint line number references with module names onpage 4-7)• a specific address or address range (see Specifying address ranges on page 4-7)• a function entry (see Specifying the entry point to a function on page 4-8).You can enter a location directly in the field, or click the drop-down arrow to the rightof the field to choose a location from a list browser (see List browser dialog boxes onpage 8-2), select from your personal Favorites List (see Favorites categories used by<strong>RealView</strong> <strong>Debugger</strong> features on page 8-32), or select from a list of previously-usedexpressions.4.4.2 Setting unconditional breakpoints in other ways<strong>RealView</strong> <strong>Debugger</strong> includes other ways for you to explicitly set new unconditionalbreakpoints and manipulate existing ones:• Setting a breakpoint at a memory location• Setting a breakpoint at the address of a symbol• Setting a breakpoint on a chosen function or variable on page 4-23• Assigning an action to an unconditional breakpoint on page 4-23.Setting a breakpoint at a memory locationSet a breakpoint on a memory location in the Memory pane. The type of breakpointoffered depends on the type of memory at the chosen location, for example RAM,ROM, or Flash.See the Operating on memory contents on page 6-25 for details.Setting a breakpoint at the address of a symbolSet a hardware breakpoint at an address of a symbol using the Set Break At... optionon the Stack pane context menu, but do not assign a qualifier to the breakpoint. Thisdisplays the Set Address/Data Breakpoint dialog box (see Using the Set Address/DataBreakpoint dialog box on page 4-41).However, this is not recommended if execution runs past the end of a function returncall because as soon as you exit the function the stack value is no longer meaningful.Use the Watch pane to track a specific symbol continuously because this recomputes thestack location dynamically and so tracks each invocation of the function.4-22 Copyright © 2002-2005 <strong>ARM</strong> Limited. All rights reserved. <strong>ARM</strong> DUI 0153G
Working with BreakpointsYou can use local variables within the conditional part of a breakpoint because the stackvalue is computed correctly each time the breakpoint condition is evaluated.Setting a breakpoint on a chosen function or variableYou can use the Data Navigator pane to set an unconditional breakpoint on a chosenfunction or variable, defined as a location in the image. See Using the Data Navigatorpane on page 8-5 for details.Assigning an action to an unconditional breakpointYou can assign one or more actions to an unconditional breakpoint. To do this, you mustuse the Set Address/Data Breakpoint dialog box to create a new unconditionalbreakpoint or to edit an existing unconditional breakpoint (see Using the SetAddress/Data Breakpoint dialog box on page 4-41).<strong>ARM</strong> DUI 0153G Copyright © 2002-2005 <strong>ARM</strong> Limited. All rights reserved. 4-23
Working with Breakpoints4.5 Setting hardware breakpoints explicitlyUse hardware breakpoints to set execution or data breaks, or where your code is storedin ROM or Flash (see Breakpoints and memory map locations on page 4-9). Thefacilities available depend on the current debug target, that is both the target processorand the target vehicle.To set hardware breakpoints, you must be connected to a debug target that supportsthese features, such as an <strong>ARM</strong> processor with EmbeddedICE logic (for example, an<strong>ARM</strong>966E-S), or simulator software that supports this feature (for example, <strong>RealView</strong>Simulator Broker connections to RVISS).Menu options related to hardware breakpoints are grayed out if your target cannotsupport them. Similarly, <strong>RealView</strong> <strong>Debugger</strong> displays a message if you select an optionfrom a drop-down list box that is not supported by your debug target. Check yourhardware characteristics (see Viewing your hardware breakpoint support on page 4-13),and your vendor-supplied documentation, to determine the level of support forhardware breakpoints.This section includes:• Using the HW Break if in Range dialog box• Using the HW While in function/range, Break if X dialog box on page 4-26• Using the HW Break if X, then if Y dialog box on page 4-27• Using the HW Break on Data Value match dialog box on page 4-29• Chaining breakpoints on page 4-30.NoteThe methods described in this section create unconditional hardware breakpoints. To setconditional hardware breakpoints, see Setting conditional hardware breakpoints onpage 4-38.4.5.1 Using the HW Break if in Range dialog boxThe HW Break if in Range dialog box enables you to set, or modify, a hardwarebreakpoint at the specified location. A single breakpoint instance is created. Thebreakpoint is triggered if the PC is within the given address range and, optionally, datamatches a specified value.Displaying the dialog boxTo display the HW Break if in Range dialog box, shown in Figure 4-6 on page 4-25,select the following option from the Code window main menu:4-24 Copyright © 2002-2005 <strong>ARM</strong> Limited. All rights reserved. <strong>ARM</strong> DUI 0153G
Working with BreakpointsDebug → Breakpoints → Hardware → HW Break if in Range...Figure 4-6 HW Break if in Range dialog boxHW Break if in Range dialog box interface componentsThe HW Break if in Range dialog box (see Figure 4-6) contains the following fields:Enter Address Range to Break onChoose the type of hardware breakpoint that you want to set. The optionsare:• HW Access• HW Read• HW Write• HW Instr.Specify the location to break on. This can be:• a specific line number in the source code, with or without a modulename prefix (see Qualifying breakpoint line number referenceswith module names on page 4-7)• a specific address or address range (see Specifying address rangeson page 4-7)• a function entry (see Specifying the entry point to a function onpage 4-8).And if Data Value matchesSelect this check box if you also want to test a data value to trigger thebreakpoint. Enter the data value to test in the data field.You can enter values directly in these fields, or click the drop-down arrow to the rightof these fields to choose from a list browser (see List browser dialog boxes on page 8-2),select from your personal Favorites List (see Favorites categories used by <strong>RealView</strong><strong>Debugger</strong> features on page 8-32), or select from a list of previously-used expressions.<strong>ARM</strong> DUI 0153G Copyright © 2002-2005 <strong>ARM</strong> Limited. All rights reserved. 4-25
Working with Breakpoints4.5.2 Using the HW While in function/range, Break if X dialog boxThe HW While in function/range, Break if X dialog box enables you to specify ahardware breakpoint that uses two chained breakpoint units (see Chaining breakpointson page 4-30 for more information).Displaying the dialog boxTo display the HW While in function/range, Break if X dialog box, shown in Figure 4-7,select the following option from the Code window main menu:Debug → Breakpoints → Hardware → HW While in function/range, Break if X...Figure 4-7 HW While in func/range, Break if X dialog boxHW While in function/range, Break if X interface componentsThe HW While in function/range, Break if X dialog box (see Figure 4-7) contains thefollowing fields:Enter Function name or RangeSpecify the function or location to test for the first breakpoint unit. Thiscan be:• a specific line number in the source code, with or without a modulename prefix (see Qualifying breakpoint line number referenceswith module names on page 4-7)• a specific address or address range (see Specifying address rangeson page 4-7)• a function entry (see Specifying the entry point to a function onpage 4-8).The breakpoint unit triggers if the PC equals the corresponding address,or falls within the specified address range.4-26 Copyright © 2002-2005 <strong>ARM</strong> Limited. All rights reserved. <strong>ARM</strong> DUI 0153G
Working with BreakpointsEnter Data address expressionChoose the type of hardware breakpoint that you want to set. The optionsare:• HW Access• HW Read• HW Write.Enter the data address expression that must be accessed to trigger thebreakpoint, for example:@dtmf\DTMF\int0_handlerAnd if Data Value matchesSelect this check box if you want to test a data value to trigger thebreakpoint. Enter the data value to test in the data field.You can enter values directly in these fields, or click the drop-down arrow to the rightof these fields to choose from a list browser (see List browser dialog boxes on page 8-2),select from your personal Favorites List (see Favorites categories used by <strong>RealView</strong><strong>Debugger</strong> features on page 8-32), or select from a list of previously-used expressions.4.5.3 Using the HW Break if X, then if Y dialog boxThe HW Break if X, then if Y dialog box enables you to specify a hardware breakpointthat uses two chained breakpoint units (see Chaining breakpoints on page 4-30 for moreinformation). The breakpoint is set at the specified memory location or address range(see Specifying address ranges on page 4-7) depending on the values read.Displaying the HW Break if X, then if Y dialog boxTo display the HW Break if X, then if Y dialog box, shown in Figure 4-8, select thefollowing option from the Code window main menu:Debug → Breakpoints → Hardware → HW Break if X, then if Y...Figure 4-8 HW break if X, then if Y dialog box<strong>ARM</strong> DUI 0153G Copyright © 2002-2005 <strong>ARM</strong> Limited. All rights reserved. 4-27
Working with BreakpointsHW Break if X, then if Y dialog box interface componentsThe HW Break if X, then if Y dialog box (see Figure 4-8 on page 4-27) contains thefollowing fields:Enter Address Expression to MatchChoose the type of hardware breakpoint that you want to set for the firstbreakpoint unit. The options are:• HW Access• HW Read• HW Write• HW Instr.Specify the location to test for the first breakpoint unit (X). Thebreakpoint unit triggers if the PC equals the corresponding address, orfalls within the specified address range.Enter ‘Then’ address expression to MatchChoose the type of hardware breakpoint that you want to set for thesecond breakpoint unit. The options are:• HW Access• HW Read• HW Write• HW Instr.Specify the location to test for the second breakpoint unit (Y). Thebreakpoint unit triggers if the PC equals the corresponding address, orfalls within the specified address range.The location where the breakpoint is to be set can be:• a specific line number in the source code, with or without a module name prefix(see Qualifying breakpoint line number references with module names onpage 4-7)• a specific address or address range (see Specifying address ranges on page 4-7)• a function entry (see Specifying the entry point to a function on page 4-8).You can enter the location directly into these fields, or click the drop-down arrow to theright of these fields to choose a location from a list browser (see List browser dialogboxes on page 8-2), select from your personal Favorites List (see Favorites categoriesused by <strong>RealView</strong> <strong>Debugger</strong> features on page 8-32), or select from a list ofpreviously-used expressions.4-28 Copyright © 2002-2005 <strong>ARM</strong> Limited. All rights reserved. <strong>ARM</strong> DUI 0153G
Working with Breakpoints4.5.4 Using the HW Break on Data Value match dialog boxThe HW Break on Data Value match dialog box enables you to specify the range of datavalues to test for the breakpoint. For example the low value, and the high value, or youcan use a mask. The breakpoint triggers if the PC falls within the specified range. Asingle breakpoint instance is created with this dialog box.Displaying the HW Break on Data Value match dialog boxTo display the HW Break on Data Value match dialog box, shown in Figure 4-9, use oneof the following methods:• Select the following option from the Code window main menu:Debug → Breakpoints → Hardware → HW Break on Data Value match...• Using the Break/Tracepoints pane, either:— select Set BreakIf... from the Pane menu— right-click on the pane background, and select Set BreakIf... from thecontext menu.Then select HW Break on Data Value match... from the List Selection dialogbox, and click OK.Figure 4-9 HW Break on Data Value match dialog boxHW Break on Data Value match dialog box interface componentsThe HW Break on Data Value match dialog box (see Figure 4-9) contains the followingfields:Data value to matchChoose the type of hardware breakpoint that you want to set for thematch. This can be one of the following:• Enter Data Value Access to Match• Enter Data Value Read to Match<strong>ARM</strong> DUI 0153G Copyright © 2002-2005 <strong>ARM</strong> Limited. All rights reserved. 4-29
Working with Breakpoints• Enter Data Value Write to Match.Enter the data value to test against in the data field.Data value modifierChoose a data value modifier, if your hardware supports it. This can beone of the following:Enter None (no range)Test against the first data value only. This is the default.Enter End ValueTest for values in the range from the first data value and thesecond data value specified, inclusive.Enter Value LengthTest for values in the range from the first data value and thefirst data value plus the length specified, inclusive. Forexample, if the first data value is 0x10, and the length is 0xF,then the range is from 0x10 to 0x1F, inclusive.Enter Value MaskSpecify a value mask if you are interested only in certain bitsof the value. For example, if you have a data field occupyingfive bits (0x1F), then set a mask of 0x5 if only bits 0 and 2 areof interest.You can enter values directly in these fields, or click the drop-down arrow to the rightof these fields to choose from a list browser (see List browser dialog boxes on page 8-2),select from your personal Favorites List (see Favorites categories used by <strong>RealView</strong><strong>Debugger</strong> features on page 8-32), or select from a list of previously-used expressions.4.5.5 Chaining breakpointsYou can create complex conditional breakpoints by chaining individual breakpointstogether. Only hardware breakpoints can be chained together. You can create chainedbreakpoints in the following ways:• Using the following dialog boxes:— HW While in function/range, Break if X dialog box (see Using the HWWhile in function/range, Break if X dialog box on page 4-26)— HW Break if X, then if Y dialog box (see Using the HW Break if X, then ifY dialog box on page 4-27).• Using break command qualifiers, see:— Chaining breakpoints with command qualifiers on page 4-314-30 Copyright © 2002-2005 <strong>ARM</strong> Limited. All rights reserved. <strong>ARM</strong> DUI 0153G
Working with Breakpoints— Converting existing individual breakpoints to chained breakpoints.Chaining breakpoints with command qualifiersYou use the hw_and command qualifier to create chained breakpoints. For the firstbreakpoint in the chain, include the hw_and:next or hw_and:”then-next” commandqualifiers. For each subsequent breakpoint in the chain, include the hw_and:”then-prev”or hw_and:prev command qualifiers.For more details on the break commands, see the <strong>RealView</strong> <strong>Debugger</strong> v1.8 CommandLine Reference <strong>Guide</strong>.Converting existing individual breakpoints to chained breakpointsIf you have created individual breakpoints, and you want to chain them together, youmust use CLI commands to create new breakpoints based on the existing breakpoints.You must create new breakpoints because you cannot use the modify qualifier with thehw_and qualifier. However, you can modify a chained breakpoint with any other qualifierand also change the address expression.To create chained breakpoints based on existing breakpoints:1. Display the Break/Tracepoints pane.2. Expand the breakpoint instances to determine the CLI command that was used tocreate each breakpoint.3. Make a note of the commands used to create each breakpoint. Alternatively:• copy the commands from the output in the Cmd tab, and save them in a textfile• copy the commands from the log or journal file, if you have one.4. Clear the original breakpoints that you are using to create the chainedbreakpoints.5. Determine the order in which the breakpoints are to be chained.6. For each breakpoint command you enter, include the hw_and qualifier to set up thechained breakpoints as follows:a. For the first breakpoint in the chain, include the hw_and:next orhw_and:”then-next” command qualifiers.b. For each subsequent breakpoint in the chain, include the hw_and:prev orhw_and:”then-prev” command qualifiers.<strong>ARM</strong> DUI 0153G Copyright © 2002-2005 <strong>ARM</strong> Limited. All rights reserved. 4-31
Working with BreakpointsFor more details on the break commands, see the <strong>RealView</strong> <strong>Debugger</strong> v1.8 CommandLine Reference <strong>Guide</strong>.4-32 Copyright © 2002-2005 <strong>ARM</strong> Limited. All rights reserved. <strong>ARM</strong> DUI 0153G
Working with Breakpoints4.6 Specifying processor exceptions (global breakpoints)If supported by your debug target, <strong>RealView</strong> <strong>Debugger</strong> maintains a list of processorexceptions that automatically trigger a breakpoint in any application program. These areglobal breakpoints, that is they apply to processor exceptions and not addresses. Duringyour debugging session you can examine this list and select, or deselect, events that haltthe processor.4.6.1 Displaying the List Selection dialog boxTo display the List Selection dialog box, shown in Figure 4-10, use one of the followingmethods:• Select the following option from the Code window main menu:Debug → Processor Exceptions...• Using the Break/Tracepoints pane, either:— select Processor Exceptions... from the Pane menu— right-click on the pane background, and select Processor Exceptions...from the context menu.Figure 4-10 Processor Exceptions List Selection dialog box4.6.2 List Selection dialog box interface componentsThe List Selection dialog box (see Figure 4-10) shows processor exceptions that stopexecution. An exception is enabled when the associated check box contains a tick:1. Click on a check box to enable, or disable, a chosen exception.2. Click OK to make the chosen exceptions active.<strong>ARM</strong> DUI 0153G Copyright © 2002-2005 <strong>ARM</strong> Limited. All rights reserved. 4-33
Working with Breakpoints4.7 Setting conditional breakpointsConditional breakpoints have condition qualifiers assigned to test for conditions thatmust be satisfied to trigger the breakpoint. For example, you can:• test a variable for a given value• execute a function a set number of times• run a macro.This section includes:• Considerations when using conditional breakpoints• Using the Simple Break if X, N times dialog box on page 4-35• Using the Simple Break if X, when Y is True dialog box on page 4-37• Setting conditional hardware breakpoints on page 4-38• Setting conditional breakpoints in other ways on page 4-39.4.7.1 Considerations when using conditional breakpointsConditional breakpoints can be very intrusive because <strong>RealView</strong> <strong>Debugger</strong> takescontrol when the breakpoint triggers. The specified qualifiers are checked and then, ifapplicable, control is returned to the application. See Controlling the behavior ofbreakpoints on page 4-59 for details on how the order of conditional qualifiers affectsthe behavior of a breakpoint.When a conditional breakpoint triggers, there might be a discrepancy between the realstate of your target and what is shown in the Code window. For example, the State fieldmight show that the target has stopped when it is running. This is because the state ofthe target, as reported by <strong>RealView</strong> <strong>Debugger</strong>, is a snapshot of the target status at thetime that the breakpoint triggered. Depending on the tasks on the system, the target statemight have changed. Therefore, when you are using conditional breakpoints, rememberthat the state of the target depends on several factors, including:• the speed of your debug target and the processor, or processors, it contains• those instructions currently being executed on the target• how much processing is required on the host to resolve the conditionalbreakpoint.NoteIf you are using RTOS extensions and running in RSD mode, see the chapter thatdescribes RTOS support in <strong>RealView</strong> <strong>Debugger</strong> v1.8 Extensions <strong>User</strong> <strong>Guide</strong> for moredetails on working with breakpoints.4-34 Copyright © 2002-2005 <strong>ARM</strong> Limited. All rights reserved. <strong>ARM</strong> DUI 0153G
Working with Breakpoints4.7.2 Using the Simple Break if X, N times dialog boxThe Simple Break if X, N times dialog box, shown in Figure 4-11, enables you to set aconditional breakpoint that specifies how many times execution must arrive at thespecified address before the breakpoint triggers. This dialog box provides a quick wayof assigning the SW Pass Count qualifier to a breakpoint (see Specifying Qualifiers onpage 4-52).Figure 4-11 Simple Break if X, N times dialog boxDisplaying the Simple Break if X, N times dialog boxTo display the Simple Break if X, N times dialog box (see Figure 4-11) use one of thefollowing methods:• Select the following option from the Code window main menu:Debug → Breakpoints → Conditional → Break if X, N times...• Right-click on the margin, an instruction, or line of source code in the File Editorpane, and select Set BreakIf... from the context menu. Then select Break if X, Ntimes... from the List Selection dialog box, and click OK.• Using the Break/Tracepoints pane, either:— select Set BreakIf... from the Pane menu— right-click on the pane background, and select Set BreakIf... from thecontext menu.Then select Break if X, N times... from the List Selection dialog box, and clickOK.• Right-click on a value shown in the Watch pane, or on a variable shown in the CallStack pane, and select BreakIf... from the context menu. Then select Break if X,N times... from the List Selection dialog box, and click OK.<strong>ARM</strong> DUI 0153G Copyright © 2002-2005 <strong>ARM</strong> Limited. All rights reserved. 4-35
Working with BreakpointsSimple Break if X, N times dialog box interface componentsThe Simple Break if X, N times dialog box (see Figure 4-11 on page 4-35) contains thefollowing fields:Enter Address Expression to Break onChoose the type of breakpoint that you want to set. The options are:• SW Instr• HW Instr• HW Access• HW Read• HW Write.Specify the location where the breakpoint is to be set. This can be:• a specific line number in the source code, with or without a modulename prefix (see Qualifying breakpoint line number referenceswith module names on page 4-7)• a specific address or address range (see Specifying address rangeson page 4-7)• a function entry (see Specifying the entry point to a function onpage 4-8).The breakpoint unit triggers if the PC equals the corresponding address,or falls within the specified address range. For example, Proc_4.Alternatively, you can click the drop-down arrow to the right of thesefields to choose the location from a list browser (see List browser dialogboxes on page 8-2), select from your personal Favorites List (seeFavorites categories used by <strong>RealView</strong> <strong>Debugger</strong> features on page 8-32),or select from a list of previously-used expressions.AfterThe number of times execution must arrive at the specified address totrigger the breakpoint, for example, when Proc_4 has been executed 150times.NoteIf you are using a debug target that supports it, the pass count can be made in hardware.4-36 Copyright © 2002-2005 <strong>ARM</strong> Limited. All rights reserved. <strong>ARM</strong> DUI 0153G
Working with Breakpoints4.7.3 Using the Simple Break if X, when Y is True dialog boxThe Simple Break if X, when Y is True dialog box, shown in Figure 4-12, enables youto set a conditional breakpoint that specifies an expression (given in C format). Theresult must be True when execution arrives at the specified address for the breakpointto be triggered. This dialog box provides a quick way of assigning the WhenExpression True qualifier to a breakpoint (see Specifying Qualifiers on page 4-52).Figure 4-12 Simple Break if X, when Y is True dialog boxDisplaying the Simple Break if X, when Y is True dialog boxTo display the Simple Break if X, when Y is True dialog box (see Figure 4-12) use oneof the following methods:• Select the following option from the Code window main menu:Debug → Breakpoints → Conditional → Break if X, when Y is True...• Right-click on the margin, an instruction, or line of source code in the File Editorpane, and select Set BreakIf... from the context menu. Then select Break if X,when Y is True... from the List Selection dialog box, and click OK.• Using the Break/Tracepoints pane, either:— select Set BreakIf... from the Pane menu— right-click on the pane background, and select Set BreakIf... from thecontext menu.Then select Break if X, when Y is True... from the List Selection dialog box, andclick OK.• Right-click on a value shown in the Watch pane, or on a variable shown in the CallStack pane, and select BreakIf... from the context menu. Then select Break if X,when Y is True... from the List Selection dialog box, and click OK.<strong>ARM</strong> DUI 0153G Copyright © 2002-2005 <strong>ARM</strong> Limited. All rights reserved. 4-37
Working with BreakpointsSimple Break if X, when Y is True dialog box interface componentsThe Simple Break if X, when Y is True dialog box (see Figure 4-12 on page 4-37)contains the following fields:Enter Address Expression to Break onChoose the type of breakpoint that you want to set. The options are:• SW Instr• HW Instr• HW Access• HW Read• HW Write.Specify the location where the breakpoint is to be set. This can be:• a specific line number in the source code, with or without a modulename prefix (see Qualifying breakpoint line number referenceswith module names on page 4-7)• a specific address or address range (see Specifying address rangeson page 4-7)• a function entry (see Specifying the entry point to a function onpage 4-8).The breakpoint unit triggers if the PC equals the corresponding address,or falls within the specified address range. For example, Proc_3.When expression is TrueThe expression to test. This must give a True or False value as the result,or example, Run_Index==10.You can enter values directly in these fields, or you can click the drop-down arrow tothe right of the fields to choose from a list browser (see List browser dialog boxes onpage 8-2), select from your personal Favorites List (see Favorites categories used by<strong>RealView</strong> <strong>Debugger</strong> features on page 8-32), or select from a list of previously-usedexpressions.4.7.4 Setting conditional hardware breakpointsAlthough hardware breakpoints can have conditions that are controlled in hardware,they are not conditional breakpoints in <strong>RealView</strong> <strong>Debugger</strong>. <strong>RealView</strong> <strong>Debugger</strong>recognizes a breakpoint as conditional only when a condition qualifier is assigned to thebreakpoint. Condition qualifiers are software conditions that are controlled by<strong>RealView</strong> <strong>Debugger</strong>.4-38 Copyright © 2002-2005 <strong>ARM</strong> Limited. All rights reserved. <strong>ARM</strong> DUI 0153G
Working with BreakpointsIf you have created a hardware breakpoint using one of the methods described in Settinghardware breakpoints explicitly on page 4-24, then you must edit the breakpoint toassign one or more condition qualifiers to it. To do this, right-click on the breakpointentry in the Break/Tracepoints pane, and select Edit Break/Tracepoint... from thecontext menu. The Set Address/Data Breakpoint dialog box is displayed, where you canassign condition qualifiers to the breakpoint.For details on using the Set Address/Data Breakpoint dialog box, see Using the SetAddress/Data Breakpoint dialog box on page 4-41.4.7.5 Setting conditional breakpoints in other ways<strong>RealView</strong> <strong>Debugger</strong> includes other ways to set conditional breakpoints and manipulateexisting ones:• Use drag-and-drop to create a breakpoint in the Break/Tracepoints pane based ona program item, for example highlight a source code function in the File Editorpane and then drag it (using your mouse) and drop it into the Break/Tracepointspane (see Using the Break/Tracepoints pane on page 4-63 for details).• Set a breakpoint on a memory location in the Memory pane. The type ofbreakpoint offered depends on the type of memory at the chosen location, forexample RAM, ROM, or Flash. See Operating on memory contents on page 6-25for more details.• Set a hardware breakpoint at an address of a symbol using the Set Break At...option on the Stack pane context menu, and assign a qualifier to the breakpoint.This displays the Set Address/Data Breakpoint dialog box (see Using the SetAddress/Data Breakpoint dialog box on page 4-41).However, this is not recommended if execution runs past the end of a functionreturn call because as soon as you exit the function the stack value is no longermeaningful.Use the Watch pane to track a specific symbol continuously because thisrecomputes the stack location dynamically and so tracks each invocation of thefunction.You can use local variables within the conditional part of a breakpoint because thestack value is computed correctly each time the breakpoint condition is evaluated.See Operating on stack contents on page 6-33 for more details on using the Stackpane.• Right-click on a value shown in the Watch pane, or on a variable shown in the CallStack pane, then select Break at... from the context menu. This displays the SetAddress/Data Breakpoint dialog box (see Using the Set Address/Data Breakpointdialog box on page 4-41).<strong>ARM</strong> DUI 0153G Copyright © 2002-2005 <strong>ARM</strong> Limited. All rights reserved. 4-39
Working with BreakpointsSee Managing watches on page 6-42 for more details on using the Watch pane.See Using the call stack on page 6-36 for more details on using the Call Stackpane.• You can use the Data Navigator pane to set a conditional breakpoint on a chosenfunction, defined as a location in the image. See Using the Data Navigator paneon page 8-5 for more details.4-40 Copyright © 2002-2005 <strong>ARM</strong> Limited. All rights reserved. <strong>ARM</strong> DUI 0153G
Working with Breakpoints4.8 Using the Set Address/Data Breakpoint dialog boxThe Set Address/Data Breakpoint dialog box provides comprehensive facilities toenable you to specify new breakpoints of any type in full (see Breakpoint types onpage 4-2). You can also use it to edit existing breakpoints.This section describes how to use the Set Address/Data Breakpoint dialog box, andincludes:• Displaying the Set Address/Data Breakpoint dialog box• Editing an existing breakpoint on page 4-42• Set Address/Data Breakpoint dialog box interface components on page 4-42• Setting software breakpoints on page 4-45• Setting hardware breakpoints on page 4-46• HW Support settings for RVISS on page 4-47• HW Support settings for target hardware on page 4-48• HW Support settings for a DSP-based debug target on page 4-49• Using ranges and masks with hardware breakpoints on page 4-50• Specifying Qualifiers on page 4-52• Specifying Actions on page 4-53• Managing the qualifier and action lists on page 4-55.4.8.1 Displaying the Set Address/Data Breakpoint dialog boxTo display the Set Address/Data Breakpoint dialog box, shown in Figure 4-13 onpage 4-42, use one of the following methods:• Select Debug → Breakpoints → Set/Edit Breakpoint... from the Code windowmain menu.• Using the Break/Tracepoints pane, either:— select Set/Edit Breakpoint... from the Pane menu— right-click on the pane background, and select Set/Edit Breakpoint... fromthe context menu.• Right-click on the margin, an instruction, or line of source code in the File Editorpane, and select Set Break... from the context menu.• Right-click on an memory location in the memory pane, and select Set BreakAt... from the context menu.• Right-click on a value shown in the Watch pane, or on a variable shown in the CallStack pane, then select Break at... from the context menu.<strong>ARM</strong> DUI 0153G Copyright © 2002-2005 <strong>ARM</strong> Limited. All rights reserved. 4-41
Working with BreakpointsFigure 4-13 Set Address/Data Breakpoint dialog box4.8.2 Editing an existing breakpointIf you want to edit an existing breakpoint, right-click on the breakpoint entry in theBreak/Tracepoints pane, and select Edit Break/Tracepoint... from the context menu.The Set Address/Data Breakpoint dialog box is displayed, and is populated with thecurrent breakpoint attributes.This is useful, for example, if you have previously set a default breakpoint, and youwant to assign a condition qualifier or action to that breakpoint.4.8.3 Set Address/Data Breakpoint dialog box interface componentsThe main interface components of the Set Address/Data Breakpoint dialog box (seeFigure 4-13) are:LocationSpecifies the memory location where the new breakpoint is set. This canbe:• a specific line number in the source code, with or without a modulename prefix (see Qualifying breakpoint line number referenceswith module names on page 4-7)• a specific address or address range (see Specifying address rangeson page 4-7)4-42 Copyright © 2002-2005 <strong>ARM</strong> Limited. All rights reserved. <strong>ARM</strong> DUI 0153G
Working with Breakpoints• a function entry (see Specifying the entry point to a function onpage 4-8).You can enter the location directly in the field, or click the drop-downarrow to the right of this field to choose a location from a list browser (seeList browser dialog boxes on page 8-2), select from your personalFavorites List (see Favorites categories used by <strong>RealView</strong> <strong>Debugger</strong>features on page 8-32), or select from a list of previously-usedexpressions. The options shown here depend on your debug target andconnection.Where supported by your target hardware, use the options from theright-arrow menu to qualify the location (see Using ranges and maskswith hardware breakpoints on page 4-50 for details).This field is enabled if you select a suitable Breakpoint Type and yourcurrent target supports the chosen type.Value MatchEnter the data value that triggers the breakpoint. Alternatively, click thedrop-down arrow to the right of this field to choose from a list browser(see List browser dialog boxes on page 8-2), select from your personalFavorites List (see Favorites categories used by <strong>RealView</strong> <strong>Debugger</strong>features on page 8-32), or select from a list of previously-usedexpressions.If you use this with data breakpoints, this compares the data value that isread or written.Where supported by your target hardware, use the options from theright-arrow menu to qualify the value match (see Using ranges and maskswith hardware breakpoints on page 4-50 for details).This field is enabled if you select a suitable Breakpoint Type and yourcurrent target supports the chosen type.ClassA read-only field to show the type of breakpoint you set.By default, <strong>RealView</strong> <strong>Debugger</strong> sets a Standard Breakpoint but thecontents of this field change depending on your debugging environmentand target configuration. For example, the Class field might show ThreadBreakpoint.See the chapters that describe tracing and RTOS support in <strong>RealView</strong><strong>Debugger</strong> v1.8 Extensions <strong>User</strong> <strong>Guide</strong> for more details on breakpointclasses, and how to work with different types of breakpoint or tracepoint.<strong>ARM</strong> DUI 0153G Copyright © 2002-2005 <strong>ARM</strong> Limited. All rights reserved. 4-43
Working with BreakpointsBreakpoint TypeEnables you to select the type of breakpoint to set. On first opening thedialog box, the list shows the breakpoint types that are supported by yourdebug target.If you select a Breakpoint Type, the contents of other groups in this dialogbox might change. For example, if your current target supports hardwarebreakpoints, and you select a hardware breakpoint type, the HW Supportgroup is populated with one or more options.For details, see:• Setting software breakpoints on page 4-45• Setting hardware breakpoints on page 4-46.HW SupportIf your current target supports breakpoint tests in hardware, and youselect a hardware Breakpoint Type, this group is populated with a list ofcurrently available tests.For details on using these controls, see:• HW Support settings for RVISS on page 4-47• HW Support settings for target hardware on page 4-48.• HW Support settings for a DSP-based debug target on page 4-49.QualifiersWhen setting a conditional breakpoint, you specify the condition thatmust be satisfied to trigger the breakpoint. Qualifiers are the tests that<strong>RealView</strong> <strong>Debugger</strong> carries out to trigger the breakpoint. If you specifymore than one qualifier, then all those specified must be met before thebreakpoint triggers. Click New to display the New Qualifiers menu,where you can define the test criteria. This menu contains the followingoptions:• SW Pass Count...• When Expression True...• When Expression False...• <strong>User</strong> Macro...• C++ Object...• Favorites...Any qualifiers you have set previously are listed below the Favorites...option.See Specifying Qualifiers on page 4-52 for details on using thesecontrols.4-44 Copyright © 2002-2005 <strong>ARM</strong> Limited. All rights reserved. <strong>ARM</strong> DUI 0153G
Working with BreakpointsActionsOKCancelHelpWhen a breakpoint triggers the usual action is to stop execution but youcan specify one or more debugger actions that must be performed whenexecution stops. In addition, <strong>RealView</strong> <strong>Debugger</strong> can carry out thespecified action and then execution can continue. This is useful whendebugging complex applications without direct user intervention.Click New to display the New Actions menu. This menu contains thefollowing options:• Update Window...• Update All Windows• Update Sample...• Breakpoint Timer• Message Output...• Favorites...Any actions you have set previously are listed below the Favorites...option.See Specifying Actions on page 4-53 for details on using these controls.Click OK to confirm the new breakpoint properties and close the dialogbox.Click Cancel to close the dialog box and abandon the breakpoint setting.Click Help to get online help on the controls in this dialog box.NoteDepending on the Breakpoint Type you select, the Location or Value Match fields mightbe unavailable. In this case, the field is grayed out. Also, in this example, the Class fieldis read-only and the drop-down arrow is unavailable.4.8.4 Setting software breakpointsTo set a software breakpoint, select SW Instr as the Breakpoint Type. You can addqualifiers and actions as required. For more details, see:• Specifying Qualifiers on page 4-52• Specifying Actions on page 4-53.<strong>ARM</strong> DUI 0153G Copyright © 2002-2005 <strong>ARM</strong> Limited. All rights reserved. 4-45
Working with Breakpoints4.8.5 Setting hardware breakpointsSelect a hardware Breakpoint Type to display entries specific to the hardware supportfor breakpoints available on the current target:HW InstrHW ReadHW WriteSets or modifies an instruction address breakpoint. This type ofbreakpoint enables you to perform hardware tests or to compare datavalues.Sets or modifies a read breakpoint at the specified memory location oraddress range (see Specifying address ranges on page 4-7). Thebreakpoint is triggered if the application reads from any part of thespecified memory range. Where supported by your debug target, you canalso add data tests.Sets or modifies a write breakpoint at the specified memory location oraddress range (see Specifying address ranges on page 4-7). Thebreakpoint is triggered if the application writes to any part of thespecified memory range.HW Access Sets or modifies an access breakpoint at the specified memory location oraddress range (see Specifying address ranges on page 4-7). Thebreakpoint is triggered when a memory address is accessed. This type ofbreakpoint enables you to perform hardware tests or to compare datavalues.HW Data Value ReadSets or modifies a breakpoint that is triggered if a specified data value isread from any address, and then detected by the debug hardware on thetarget processor.HW Data Value WriteSets or modifies a breakpoint that is triggered if a specified data value iswritten to any address, and then detected by the debug hardware on thetarget processor.HW Data Value AccessSets or modifies a breakpoint that is triggered if a specified data value isaccessed at any address, and then detected by the debug hardware on thetarget processor.For each of these types, use the HW Support group to specify how the match isconfigured, see:• HW Support settings for RVISS on page 4-47• HW Support settings for target hardware on page 4-484-46 Copyright © 2002-2005 <strong>ARM</strong> Limited. All rights reserved. <strong>ARM</strong> DUI 0153G
Working with Breakpoints• HW Support settings for a DSP-based debug target on page 4-49.To set up the hardware breakpoint you must enter:Location:Specifies the memory location where the new breakpoint is set.Where supported by your target hardware, use the options from theright-arrow menu to qualify the location (see Using ranges and maskswith hardware breakpoints on page 4-50 for details).Value Match:Enter the data value that triggers the breakpoint.If you use this with data breakpoints, this compares the data value that isread or written. When used with an instruction hardware breakpoint, thiscan test the value of an instruction. That is, it can be used to find aninstruction in a given range.Where supported by your target hardware, use the options from theright-arrow menu to qualify the value match (see Using ranges and maskswith hardware breakpoints on page 4-50 for details).NoteDepending on the Breakpoint Type you select, the Location or Value Match fields mightbe unavailable. In this case, the field is grayed out. Also, in this example, the Class fieldis read-only and the drop-down arrow is unavailable.You can add qualifiers and actions as required. For more details, see:• Specifying Qualifiers on page 4-52• Specifying Actions on page 4-53.4.8.6 HW Support settings for RVISSIf you are using the <strong>RealView</strong> Simulator Broker interface to RVISS, hardwarebreakpoints have a single HW Support group option, HWPassCount, shown inFigure 4-14. This is initially set to Off, but you can set this to an integer value.Figure 4-14 HW Support group using RVISS<strong>ARM</strong> DUI 0153G Copyright © 2002-2005 <strong>ARM</strong> Limited. All rights reserved. 4-47
Working with BreakpointsThe HWPassCount enables you to specify the number of times the test point is passedbefore the breakpoint triggers. To change the hardware pass count, click Edit Value toedit how the test is defined, shown in Figure 4-15.Figure 4-15 Changing the hardware pass countClick Set to confirm the count and close the prompt box. The HW Support display listshows the new test.Highlight the test and click Reset to restore the default settings.4.8.7 HW Support settings for target hardwareWhere your debug target supports breakpoint tests in hardware, they can be managedand edited using this group. If enabled, the display lists currently available tests, forexample for an <strong>ARM</strong> architecture-based target:DataSizeModeExternSupports testing MAS signals from the core. This enables you to test thesize of data bus activity.Supports testing nTrans signals from the core. This enables you to testthe data not translate signal to differentiate access between a <strong>User</strong> modeand a privileged mode.Supports hardware breakpoints that are dependent on some externalcondition.The current test is shown in round brackets, for example Ignore or Any.To change a selected test, highlight the test, for example Match=Mode:(Ignore), and thenclick Edit Value to change how the test is defined, shown in Figure 4-16 on page 4-49.4-48 Copyright © 2002-2005 <strong>ARM</strong> Limited. All rights reserved. <strong>ARM</strong> DUI 0153G
Working with BreakpointsFigure 4-16 Configuring hardware testsClick OK to confirm the new test and close the list selection box. The HW Supportdisplay list shows the new test.Highlight a test and click Reset to restore the default settings.4.8.8 HW Support settings for a DSP-based debug targetThe options available from the Set Address/Data Breakpoint dialog box change if, forexample, you are using a DSP-based debug target.If you are working with a CEVA, Inc. DSP based debug target, the HW Support groupoffers a single option, shown in Figure 4-17. The HWPassCount enables you to specify thenumber of times the test point is passed before the breakpoint triggers.Figure 4-17 HW Support group using a DSPTo change the hardware pass count, click Edit Value to edit how the test is defined,shown in Figure 4-18 on page 4-50.<strong>ARM</strong> DUI 0153G Copyright © 2002-2005 <strong>ARM</strong> Limited. All rights reserved. 4-49
Working with BreakpointsFigure 4-18 Changing the hardware pass count in a DSPClick Set to confirm the count and close the prompt box. The HW Support display listshows the new test.Highlight the test and click Reset to restore the default settings.Where supported by your target hardware, you can qualify the location and value matchentries using options available from the right-arrow menu (see Using ranges and maskswith hardware breakpoints for details).4.8.9 Using ranges and masks with hardware breakpointsWhere supported by your target hardware, you can qualify the location and value matchentries using options available from the right-arrow menu.Click the right-arrow at the side of the Location data field to display the Address Rangeand Mask menu. Use options from this menu to specify an expression range or mask agroup of instructions:• Address Range (HW Breaks only)• Address Range by Length (HW Breaks only)• Address Mask (HW Breaks only)• NOT Address Compare (HW Breaks only)• Autocomplete Range.Click the right-arrow at the side of the Value Match data field to display the ValueRange and Mask menu. Use options from this menu to test a range of values or maska range of data values:• Value Range (HW Breaks only)• Value Range by Length (HW Breaks only)• Value Mask (HW Breaks only)• NOT Value Compare (HW Breaks only)• Autocomplete Range.4-50 Copyright © 2002-2005 <strong>ARM</strong> Limited. All rights reserved. <strong>ARM</strong> DUI 0153G
Working with BreakpointsNoteThese menu options are only available where supported by your debug target and if youhave specified a hardware Breakpoint Type.Choose from the available options to set up your hardware breakpoint:Address/Value RangeEnter the start address, or data value, for the breakpoint then click thisoption to specify a range, for example the address range 0x800FF..0x80A00(see Specifying address ranges on page 4-7). The separators .. areautomatically inserted for you.Address/Value Range by LengthEnter the start address, or data value, for the breakpoint then click thisoption to specify a range by length, for example the address range0x800FF..+0x1111 (see Specifying address ranges on page 4-7). Theseparators ..+ are automatically inserted for you.Address/Value MaskEnter the address, or data value, for the breakpoint then click this optionto specify a mask. <strong>RealView</strong> <strong>Debugger</strong> inserts the mask for you, forexample 0x800FF $MASK$=0xFFFF. Change this mask as required.The mask is a bitwise-AND mask applied to the specified address, or datavalue, for example given the location 0x0111 and a mask 0x1001 the resultis 0x0001.The breakpoint triggers when the address, or data value, matches thegiven value after masking.NOT Address/Value CompareEnter the address, or data value, for the breakpoint then click this optionto specify a NOT operation, for example $NOT$ 0x800FF.Similarly, use this option to specify a range of addresses, or data values,to ignore, for example $NOT$ 0x0500..+0x0100.Autocomplete RangeEnter a symbol and then click this option to compute the end-of-rangeaddress based on the symbol size. For example, if you enter a functionthen the autocompleted range is from the start to the end of the function.Similarly, enter a global variable to see the end-of-range addressautocompleted as the variable storage address plus variable size.<strong>ARM</strong> DUI 0153G Copyright © 2002-2005 <strong>ARM</strong> Limited. All rights reserved. 4-51
Working with BreakpointsNoteMany combinations of range, or mask, options are permitted. However, mixing rangeand mask generates a warning message to say that this is not permitted.4.8.10 Specifying QualifiersTo set a conditional breakpoint, you must assign a condition qualifier. To do this, clickthe New button in the Qualifiers group, shown in Figure 4-19, to display the NewQualifiers menu. You can use this to specify qualifiers when you first create abreakpoint, or to add qualifiers to edit an existing breakpoint.Figure 4-19 Assigning qualifiers to breakpointsThe order of the qualifiers, in the Qualifiers group display list, defines the order they aretested to trigger the breakpoint. If a condition is False, then subsequent conditions arenot tested. See Controlling the behavior of breakpoints on page 4-59 for details on howthe order of conditional qualifiers affects the behavior of a breakpoint.The New Qualifiers menuThis menu enables you to select the qualifier that controls execution, that is to definethe condition that must be satisfied to trigger the breakpoint:SW Pass Count...Use this to specify the number of times execution must arrive at thespecified address before execution stops.The equivalent CLI command qualifier is passcount:count.When Expression True...Enables you to specify an expression that must evaluate to True to stopexecution.The equivalent CLI command qualifier is when:{condition}.4-52 Copyright © 2002-2005 <strong>ARM</strong> Limited. All rights reserved. <strong>ARM</strong> DUI 0153G
Working with Breakpoints4.8.11 Specifying ActionsWhen Expression False...Use this to specify an expression that must evaluate to False to stopexecution.The equivalent CLI command qualifier is when_not:{condition}.<strong>User</strong> Macro...Enables you to specify a macro that runs when execution stops. Thisbrings up a dialog box where you supply the macro name and anyarguments required to run it. See Attaching macros to breakpoints onpage 4-56 for an example. Also, see Controlling the behavior ofbreakpoints on page 4-59 for details on how the macro return valueaffects the behavior of a breakpoint.The equivalent CLI command qualifier is macro:{MacroCall(arg1,arg2)}.C++ Object...Use this to specify a C++ this object to test. The Call Stack pane containsa This tab where you can view such objects.The equivalent CLI command qualifier is obj:(n).Favorites... Select this option to display your personal Favorites List of breakpointqualifiers (see Favorites categories used by <strong>RealView</strong> <strong>Debugger</strong> featureson page 8-32). From here you can specify the required qualifier.See Setting breakpoints from your breakpoint Favorites List on page 4-76for details of creating breakpoint favorites and adding qualifiers to thelist.You can assign actions to your breakpoint. To do this, click the New button in theActions group, shown in Figure 4-20, to display the New Actions menu. You can usethis to specify breakpoint actions when you first create a breakpoint, or to add actionsto edit an existing breakpoint.Figure 4-20 Assigning actions to breakpoints<strong>ARM</strong> DUI 0153G Copyright © 2002-2005 <strong>ARM</strong> Limited. All rights reserved. 4-53
Working with BreakpointsThe order of the actions, in the Actions group display list, defines the order they arecarried out when the breakpoint triggers.Actions do not execute until all condition qualifiers, if any, complete successfully. If nocondition qualifiers are specified, the actions are always performed. See Controlling thebehavior of breakpoints on page 4-59 for details on how actions are performed for abreakpoint when used with condition qualifiers.The New Actions menuThe New Actions menu enables you to specify one or more actions to be performedwhen a breakpoint triggers, and any condition qualifiers, if any, complete successfully:Update Window...Displays a list selection box where you can choose which debuggerwindows are updated when execution stops. The list includes all windowsand panes available from the default desktop. You can also redirectdebugger output to a user window and this can be updated whenexecution stops.You can only use this selection box to specify one window at a time. Ifyou want to update several windows, repeat the operation to set up awindows list. The list order specifies the update order.The equivalent CLI command qualifier is update:{“name”}.Update All WindowsUpdates all desktop windows when the breakpoint triggers.The equivalent CLI command qualifier is update:{“all”}.Update Sample...Updates registered samples when execution stops. This is used as part ofthe graphing and visualization functions in <strong>RealView</strong> <strong>Debugger</strong>.NoteThis menu option is not available for visualization functions in thisrelease. This option is available when a sampling variant is available, forexample logging from breaks.Breakpoint TimerThis option is enabled if your debug target supports cycle timing inhardware. The timer measures execution time from the point where thebreakpoint triggers.The equivalent CLI command qualifier is timed.4-54 Copyright © 2002-2005 <strong>ARM</strong> Limited. All rights reserved. <strong>ARM</strong> DUI 0153G
Working with BreakpointsMessage Output...Displays a dialog box where you can enter a short text string for displaywhen the breakpoint triggers.By default this message appears in the Output pane but you can specify athe ID of a user defined window or an open file. For example, if you havea user defined window with an ID of 250, then $250$Stop at convert procsends the message Stop at convert proc to that window (see Attachingmacros to breakpoints on page 4-56 for an example).The equivalent CLI command qualifier is message:{"$windowid |fileid$message"}.Favorites... Select this option to display your personal Favorites List of breakpointactions (see Favorites categories used by <strong>RealView</strong> <strong>Debugger</strong> features onpage 8-32). From here you can specify the required action.If you have used actions previously, these are displayed at the bottom of the NewActions menu.Setting the continuation stateUse the Stop and Continue options to specify whether the program is to continue orstop executing when the breakpoint is triggered. The default state is to stop execution.Any specified action qualifiers are still performed, depending on the results of anycondition qualifiers.The Continue option is equivalent to the continue command qualifier of the breakpointCLI commands. The Stop option does not have an equivalent command qualifier.See Controlling the behavior of breakpoints on page 4-59 for details on how thecontinuation state affects the behavior of a breakpoint.4.8.12 Managing the qualifier and action listsTo manage the Qualifiers and Actions display lists:• re-order the list by highlighting a qualifier or action, and use the up or downbutton to reposition the specified entry in the list• highlight a qualifier or action, and click Del to delete the specified entry• highlight a qualifier or action, and click Edit to update it so changing thebehavior.Qualifiers, actions, and the continuation state, are set up using the Set Address/DataBreakpoint dialog box, shown in Figure 4-13 on page 4-42.<strong>ARM</strong> DUI 0153G Copyright © 2002-2005 <strong>ARM</strong> Limited. All rights reserved. 4-55
Working with Breakpoints4.9 Attaching macros to breakpoints<strong>RealView</strong> <strong>Debugger</strong> includes a macro facility that enables you to create macroscontaining complex procedures. You can execute these macros directly through the<strong>RealView</strong> <strong>Debugger</strong> CLI, or you can attach a macro to a breakpoint so that it is executedwhen the breakpoint triggers. When you attach a macro to a breakpoint, the macro canreturn an integer value that determines whether program execution continues or stops.See Controlling the behavior of breakpoints on page 4-59 for details on how the macroreturn value affects the behavior of a breakpoint.<strong>RealView</strong> <strong>Debugger</strong> recognizes several predefined macros containing commonly usedfunctions. These macros can also be attached to breakpoints. However, if you areattaching a macro that you create yourself, for example the tutorial() macro created inUsing macros on page 9-8, then this must be defined as a symbol in the debugger.Macro syntax is defined in the <strong>RealView</strong> <strong>Debugger</strong> v1.8 Command Line Reference<strong>Guide</strong>.NoteExecution-type commands are not valid within a breakpoint macro. See Using macroswith breakpoints on page 9-6 for full details.This section includes:• Defining a user-created macro as a symbol• Attaching a macro to a breakpoint on page 4-57.4.9.1 Defining a user-created macro as a symbolTo define a user-created macro as a symbol, so that you can attach it to a breakpoint:1. Make sure the macro is defined in an include file, for example tutorial.inc.2. Select Tools → Include Commands from File... to display the Select File toInclude Commands from dialog box.3. Locate and highlight the macro file. That is, tutorial.inc in this example.4. Click Open to load the macro file into the debugger. The debugger defines themacro as a symbol with the same name as the macro, for example tutorial.4-56 Copyright © 2002-2005 <strong>ARM</strong> Limited. All rights reserved. <strong>ARM</strong> DUI 0153G
Working with Breakpoints4.9.2 Attaching a macro to a breakpointYou can attach a predefined macro, or a macro you have created yourself, to abreakpoint. If you want to attach a macro you have created yourself, you must first loadthe macro definition into the debugger as described in Defining a user-created macro asa symbol on page 4-56.To attach a macro to a breakpoint:1. Display the Set Address/Data Breakpoint dialog box using one of the methodsdescribed in Displaying the Set Address/Data Breakpoint dialog box onpage 4-41.2. Enter the location of the breakpoint, for example 0x8704.3. Click the New button in the Qualifiers group to display the New Qualifiers menu.4. Select the option <strong>User</strong> Macro... to display the data entry prompt, shown inFigure 4-21.Figure 4-21 Breakpoint macro entry prompt5. Enter the macro name and arguments, if any.The predefined macro shown in Figure 4-21 displays a message box to haltexecution if the Yes key is pressed.6. Click Set to confirm your entry.7. The Set Address/Data Breakpoint dialog box now contains the macro in theQualifiers group for the conditional breakpoint, shown in Figure 4-22.Figure 4-22 Set breakpoint with macro attached<strong>ARM</strong> DUI 0153G Copyright © 2002-2005 <strong>ARM</strong> Limited. All rights reserved. 4-57
Working with Breakpoints8. Click OK to confirm the breakpoint settings and close the dialog box.9. Click Run to execute the program and trigger the breakpoint.4-58 Copyright © 2002-2005 <strong>ARM</strong> Limited. All rights reserved. <strong>ARM</strong> DUI 0153G
Working with Breakpoints4.10 Controlling the behavior of breakpointsYou can control the behavior of a breakpoint by assigning one or more conditionqualifiers and actions to that breakpoint. The order that you add the condition qualifiersand actions determines the order they are processed by <strong>RealView</strong> <strong>Debugger</strong>. However,actions are performed only when the result of all specified condition qualifiers is True,even if you specify any actions before a condition qualifier.This section includes:• Demonstrating breakpoint behavior with the Dhrystone example project• Using a macro as an argument to a break command on page 4-61.4.10.1 Demonstrating breakpoint behavior with the Dhrystone example projectTo demonstrate the behavior of a breakpoint using the Dhrystone example project:1. Load the dhrystone.prj project file, and rebuild the image if necessary.2. Connect to a debug target.3. Load the dhystone.axf image.4. Set a software breakpoint in dhry_1.c,at column 2 of line 153. Although you canuse the <strong>RealView</strong> <strong>Debugger</strong> GUI to set breakpoints, it is easier to understand theinteraction of qualifiers and actions using CLI commands (see the chapter thatdescribes the CLI commands in the <strong>RealView</strong> <strong>Debugger</strong> v1.8 Command LineReference <strong>Guide</strong>).Use the following command:breakinstruction,qualifiers (I A)\DHRY_1\#153:2For qualifiers use the following (see the command qualifiers in Table 4-3 onpage 4-60, for each command qualifier variation):• A macro to view a symbol, for example:define /R int viewSymbol(){$printsymbol DHRY_1\clock_t$;return (0); // 0 - stop execution at the breakpoint// >=1 - continue execution}.See Chapter 9 Working with Macros for more details on defining and usingmacros. Also, see Using a macro as an argument to a break command onpage 4-61.• A pass count specifying five passes before the breakpoint is to be triggered.• An action qualifier that prints the message Actions performed.<strong>ARM</strong> DUI 0153G Copyright © 2002-2005 <strong>ARM</strong> Limited. All rights reserved. 4-59
Working with Breakpoints5. Run the image, enter 10 when prompted for the number of runs.6. If you are using the <strong>RealView</strong> <strong>Debugger</strong> GUI, click the Cmd tab in the Outputpane to view the results.7. Repeat steps 3 to 6 for each command qualifier variation, and change the macroreturn value as indicated.Table 4-3 summarizes the breakpoint behavior for various combinations of thecommand qualifiers.Table 4-3 Breakpoint behavior with multiple condition qualifiers and actionsCommand qualifiersMacroreturnvalueExecutemacroPrintmessageRecord thebreakpointdetails,message:{"Actions performed"},passcount:5 After five passes After five passes,passcount:5,message:{"Actions performed"} After five passes After five passes,message:{"Actions performed"},passcount:5,continue,passcount:5,message:{"Actions performed"},continueAfter five passesAfter five passesNeverNever,macro:{viewSymbol()},passcount:5,message:{"Actions performed"},passcount:5,macro:{viewSymbol()},message:{"Actions performed"},macro:{viewSymbol()},passcount:5,message:{"Actions performed"},continue,passcount:5,macro:{viewSymbol()},message:{"Actions performed"},continue0 (stop) After every pass After five passes After five passes0 (stop) After five passes After five passes After five passes0 (stop) After every pass After five passes Never0 (stop) After five passes After five passes Never,macro:{viewSymbol()},passcount:5,message:{"Actions performed"},passcount:5,macro:{viewSymbol()},message:{"Actions performed"},macro:{viewSymbol()},passcount:5,message:{"Actions performed"},continue,passcount:5,macro:{viewSymbol()},message:{"Actions performed"},continuenonzero(continue)nonzero(continue)nonzero(continue)nonzero(continue)After every pass Never NeverAfter five passes Never NeverAfter every pass Never NeverAfter five passes Never NeverMessages similar to the following are displayed when a breakpoint is recorded:4-60 Copyright © 2002-2005 <strong>ARM</strong> Limited. All rights reserved. <strong>ARM</strong> DUI 0153G
Working with BreakpointsStopped at 0x000084C4 due to SW Instruction BreakpointStopped at 0x000084C4: DHRY_1\main Line 153From Table 4-3 on page 4-60 you can see that:• The details of the breakpoint are never recorded when the breakpoint continues.That is when the return value of a macro is nonzero, or if a continue action isassigned.• When the return value of a macro is nonzero, any actions are never performed, sothe Actions performed message is never printed. In addition, any conditionqualifiers that are specified after the macro that returns nonzero are never tested.Therefore, when using macros with breakpoints, make sure that you position themacros appropriately, especially if any return a nonzero value.• The frequency that a macro is executed depends on whether it appears before orafter other qualifiers.NoteThe continue action qualifier and a macro nonzero value result in different behavior.Although both inhibit the display of the breakpoint details, actions are never performedwhen a macro returns a nonzero value.4.10.2 Using a macro as an argument to a break commandYou can optionally specify a macro as an argument at the end of a break command. Anymacro that is specified in this way is treated as being specified last in the commandqualifier list. For example:breakinstruction,passcount:5,message:{"Actions performed"} (I A)\DHRY_1\#153:2;viewSymbol()This command gives the same behavior where the command qualifiers are in thefollowing order (see Table 4-3 on page 4-60):,passcount:5,macro:{viewSymbol()},message:{"Actions performed"}Because a macro argument is treated last in the command qualifier list, if you alsospecify a macro as a command qualifier, then execution of the macro argument dependson the result returned by the macro qualifier. For example, you might define a secondmacro, such as:define /R int viewValue(){$printf "Int_1_Loc: %d", Int_1_Loc$;return (0); // 0 - stop execution at the breakpoint<strong>ARM</strong> DUI 0153G Copyright © 2002-2005 <strong>ARM</strong> Limited. All rights reserved. 4-61
Working with Breakpoints}.// >=1 - continue executionSpecify this macro as a command argument, and the viewSymbol() macro as a commandqualifier, for example:breakinstruction,passcount:5,macro:{viewSymbol()},message:{"Actions performed"}(I A)\DHRY_1\#153:2 ;viewValue()The viewValue() macro runs only if viewSymbol() returns a value of zero. In addition, ifviewValue() returns a nonzero value, then the Actions performed message is notdisplayed, and the breakpoint details are not recorded.4-62 Copyright © 2002-2005 <strong>ARM</strong> Limited. All rights reserved. <strong>ARM</strong> DUI 0153G
Working with Breakpoints4.11 Using the Break/Tracepoints paneThe Break/Tracepoints pane provides a central point to manage all breakpointoperations. It enables you to:• view all breakpoints currently set and their status (enabled or disabled)• specify the command used to create a breakpoint• edit an existing breakpoint specification, for example you might want to changethe location, update the qualifiers, or change debugging actions when thebreakpoint triggers• copy the attributes of an existing breakpoint to create a new breakpoint at anotherlocation• create new breakpoints as an alternative to using the Debug menu• access the Break/Tracepoints and Pane menus to manage your breakpointoperations.NoteThe Break/Tracepoints pane also enables you to manage tracepoints during Trace andAnalysis operations, and to work with thread breakpoints when running in RSD mode.For full details see <strong>RealView</strong> <strong>Debugger</strong> v1.8 Extensions <strong>User</strong> <strong>Guide</strong>.This section describes:• Displaying the Break/Tracepoints pane on page 4-64• Viewing breakpoints in the Break/Tracepoints pane on page 4-65• Using the Break/Tracepoints Entry context menu on page 4-66• Using the Break/Tracepoints Entry context menu on page 4-66• Working in the Break/Tracepoints pane on page 4-68• Using the Pane menu on page 4-70.<strong>ARM</strong> DUI 0153G Copyright © 2002-2005 <strong>ARM</strong> Limited. All rights reserved. 4-63
Working with Breakpoints4.11.1 Displaying the Break/Tracepoints paneSelect View → Break/Tracepoints from the Code window main menu to display theBreak/Tracepoints pane, shown in Figure 4-23.Figure 4-23 Break/Tracepoints paneIf any breakpoints are set already, these are displayed in the new pane. To expand thetree and see the breakpoint details either:• Click on the plus sign associated with a particular breakpoint entry.• Double-click anywhere along the breakpoint entry (not on the check box).The Break/Tracepoints pane also displays any other breakpoints you set, for exampletracepoints or thread breakpoints.If no breakpoints are set then the Break/Tracepoints pane is empty. As you create andset new breakpoints (or tracepoints), the pane is automatically updated to display eachnew breakpoint.4-64 Copyright © 2002-2005 <strong>ARM</strong> Limited. All rights reserved. <strong>ARM</strong> DUI 0153G
Working with Breakpoints4.11.2 Viewing breakpoints in the Break/Tracepoints paneThe Break/Tracepoints pane shows entries in a tree view giving the Type and Value ofeach breakpoint you set, shown in the example in Figure 4-24.Instruction breakpoint on code in RAMTwo breakpoint units,for a software breakpointon a multi-statement lineEach breakpoint is identified by a:Hardware breakpoint on code in ROMFigure 4-24 Breakpoints in the Break/Tracepoints pane• colored icon to show the breakpoint type (see Viewing breakpoints in your codeview on page 4-10 for details)• check box to show if the breakpoint is enabled or disabled. You can click on thecheck box to change the state of the chosen breakpoint or breakpoint unit.In Figure 4-24, an area of memory on the debug target has been designated ROM andso a BREAKEXECUTION command is used to set a hardware breakpoint. When the hardwarebreakpoint limit is reached for this debug target no more breakpoints can be set on codein this area, and a warning message is displayed.NoteFor details on the BREAKINSTRUCTION and BREAKEXECUTION commands see <strong>RealView</strong><strong>Debugger</strong> v1.8 Command Line Reference <strong>Guide</strong>.In the example in Figure 4-25 on page 4-66, different types of hardware breakpointshave been set, and disabled, during the session.<strong>ARM</strong> DUI 0153G Copyright © 2002-2005 <strong>ARM</strong> Limited. All rights reserved. 4-65
Working with BreakpointsFigure 4-25 Hardware breakpoints in the Break/Tracepoints pane4.11.3 Using the Break/Tracepoints Entry context menuIf you have a breakpoint set, right-click anywhere along the breakpoint entry to displaythe Break/Tracepoints Entry context menu.The Break/Tracepoints Entry context menu includes the following options to edit andmanage your breakpoints:Edit Break/Tracepoint...For breakpoints, displays the Set Address/Data Breakpoint dialog box,where you can edit the breakpoint details (see Editing a breakpoint onpage 4-69).For tracepoints, displays the Set/Edit tracepoint dialog box, where youcan edit the tracepoint details (see the chapter that describes tracing with<strong>RealView</strong> <strong>Debugger</strong> in the <strong>RealView</strong> <strong>Debugger</strong> v1.8 Extensions <strong>User</strong><strong>Guide</strong>).Copy Break/Tracepoint...For breakpoints, displays the Set Address/Data Breakpoint dialog boxwith details of the original breakpoint (see Copying an existingbreakpoint on page 4-69).For tracepoints, displays the Set/Edit tracepoint dialog box with details ofthe original tracepoint (see the chapter that describes tracing with<strong>RealView</strong> <strong>Debugger</strong> in the <strong>RealView</strong> <strong>Debugger</strong> v1.8 Extensions <strong>User</strong><strong>Guide</strong>).ClearRemoves the breakpoint or tracepoint selected in the Break/Tracepointspane.4-66 Copyright © 2002-2005 <strong>ARM</strong> Limited. All rights reserved. <strong>ARM</strong> DUI 0153G
Working with BreakpointsDisableThis option changes the status of a selected breakpoint or tracepoint.Select Disable to disable a breakpoint or tracepoint you have set. Thischanges to Enable so that you can enable a breakpoint or tracepoint thathas been disabled.Select, or unselect, the check box in the Break/Tracepoints pane tochange the status in the same way.Reset PassCounters/Then-EnablesResets the counters that are used to register the number of times that theprogram passes a breakpoint before it is triggered. If the breakpoint isenabled, then it stops being triggered until the count value is reachedagain.Details...Displays an information box giving details of the selected breakpoint ortracepoint.Break/Tracepoint Favorites...Displays the Favorites Chooser/Editor where you can edit or deleteentries, or select from your favorites to set a breakpoint or tracepoint (seeFavorites categories used by <strong>RealView</strong> <strong>Debugger</strong> features on page 8-32).Show Code The cursor moves to the location of the breakpoint or tracepoint in theappropriate code view:• an open blue pointer marks the location in source-level view• a filled blue pointer marks the location in disassembly-level view ifthere is no source.4.11.4 Using the Break/Tracepoints context menuRight-click anywhere on the background of the Break/Tracepoints pane to display theBreak/Tracepoints context menu. This context menu includes the following options toedit and manage your breakpoints:Set Break from Function/Label listDisplays the Function Breakpoint/Profile Selector dialog box (see Settingbreakpoints from saved lists on page 4-74).Set/Edit Breakpoint...Displays the Set Address/Data Breakpoint dialog box (see Using the SetAddress/Data Breakpoint dialog box on page 4-41).<strong>ARM</strong> DUI 0153G Copyright © 2002-2005 <strong>ARM</strong> Limited. All rights reserved. 4-67
Working with BreakpointsSet BreakIf...Displays a List Selection dialog box containing a list of the breakpointsyou can set. Each option displays a dialog box to set the breakpoint, asdescribed in:• Setting unconditional breakpoints explicitly on page 4-21• Setting hardware breakpoints explicitly on page 4-24• Setting conditional breakpoints on page 4-34.Set Tracepoint...Displays the Set/Edit Tracepoint dialog box (see the chapter thatdescribes tracing with <strong>RealView</strong> <strong>Debugger</strong> in the <strong>RealView</strong> <strong>Debugger</strong>v1.8 Extensions <strong>User</strong> <strong>Guide</strong>).Processor Exceptions...Displays a List Selection dialog box containing a list of processorexceptions that you can enable or disable.Break/Tracepoint History...Displays a List Select dialog containing a list of breakpoints ortracepoints that you have previously set (see Setting breakpoints fromsaved lists on page 4-74).Break/Tracepoint Favorites...Displays a List Select dialog containing a list of breakpoint or tracepointfavorites that you have previously defined (see Favorites categories usedby <strong>RealView</strong> <strong>Debugger</strong> features on page 8-32 and Setting breakpointsfrom saved lists on page 4-74).Show Break Capabilities of HW...Displays information about the hardware breakpoint support on thecurrent debug target.Clear All Break/TracepointsClears all breakpoints and tracepoints defined for the current debugtarget.4.11.5 Working in the Break/Tracepoints paneIf you have a breakpoint set, you can use the Break/Tracepoints pane to edit or copy abreakpoint, as described in:• Editing a breakpoint on page 4-69• Copying an existing breakpoint on page 4-69.4-68 Copyright © 2002-2005 <strong>ARM</strong> Limited. All rights reserved. <strong>ARM</strong> DUI 0153G
Working with BreakpointsYou can also use the Break/Tracepoints pane to edit or copy other breakpoints you set,for example tracepoints or thread breakpoints.Editing a breakpointTo edit a breakpoint:1. Right-click on a breakpoint in the list to display the Break/Tracepoints Entrymenu (see Using the Break/Tracepoints Entry context menu on page 4-66).2. Select Edit Break/Tracepoint... from the context menu to display the SetAddress/Data Breakpoint dialog box where you can edit the breakpoint orbreakpoint unit (see Using the Set Address/Data Breakpoint dialog box onpage 4-41).When you edit a breakpoint, the breakpoint command includes the modify commandqualifier (see the <strong>RealView</strong> <strong>Debugger</strong> v1.8 Command Line Reference <strong>Guide</strong>for moredetails).Copying an existing breakpointTo copy an existing breakpoint and create a new breakpoint:1. Right-click on a breakpoint in the list to display the Break/Tracepoints Entrymenu (see Using the Break/Tracepoints Entry context menu on page 4-66).2. Select Copy Break/Tracepoint... from the context menu to display the SetAddress/Data Breakpoint dialog box, populated with the relevant informationabout the chosen breakpoint (see Using the Set Address/Data Breakpoint dialogbox on page 4-41).3. Change the breakpoint location, to create the new breakpoint.<strong>ARM</strong> DUI 0153G Copyright © 2002-2005 <strong>ARM</strong> Limited. All rights reserved. 4-69
Working with Breakpoints4.11.6 Using the Pane menuClick on the drop-down arrow on the Break/Tracepoints pane toolbar to display thePane menu. This menu includes options that are also available from the Debug menu.The relationship between the two menus is summarized in Table 4-4.Table 4-4 Breakpoint menu mappingsBreak/Tracepoints pane, Pane menuSet Break from Function/Label listSet/Edit Breakpoint...Set BreakIf...Set Tracepoint... aProcessor Exceptions...Break/Tracepoint History...Break/Tracepoint Favorites...Show Break Capabilities of HW...Clear All Break/TracepointsCode window, Debug menuBreakpoints → Set Break/Tracepoint fromList → Set from Function/Label list...Breakpoints → Set/Edit Breakpoint...Breakpoints → Conditional andBreakpoints → HardwareTracepoints → Set Tracepoint...Processor Exceptions...Breakpoints → Set Break/Tracepoint fromList → Break/Tracepoint History...Breakpoints → Set Break/Tracepoint fromList → Break/Tracepoint Favorites...Breakpoints → Hardware → Show BreakCapabilities of HW...Breakpoints → Clear AllBreak/Tracepointsa. See the chapter that describes tracing with <strong>RealView</strong> <strong>Debugger</strong> in the <strong>RealView</strong> <strong>Debugger</strong> v1.8Extensions <strong>User</strong> <strong>Guide</strong> for details on setting tracepoints.If you select the option Set BreakIf... from the Pane menu, a breakpoint type selectionbox is displayed containing all the breakpoints supported by your debug target. Eachentry displays a dialog box to set the breakpoint, as described in:• Setting unconditional breakpoints explicitly on page 4-21• Setting hardware breakpoints explicitly on page 4-24• Setting conditional breakpoints on page 4-34.You can also access some of the options from the Pane menu by right-clicking on ablank area inside the Break/Tracepoints pane. This enables you to create newbreakpoints, select from your personal favorites or history list, or to see your hardwaresupport.4-70 Copyright © 2002-2005 <strong>ARM</strong> Limited. All rights reserved. <strong>ARM</strong> DUI 0153G
Working with BreakpointsNoteThe Break/Tracepoints pane also lists any tracepoints you have set. For full details onsetting and using tracepoints, see the chapter that describes tracing in <strong>RealView</strong><strong>Debugger</strong> v1.8 Extensions <strong>User</strong> <strong>Guide</strong>.<strong>ARM</strong> DUI 0153G Copyright © 2002-2005 <strong>ARM</strong> Limited. All rights reserved. 4-71
Working with Breakpoints4.12 Disabling and clearing breakpointsYou can temporarily disable breakpoints. This does not delete the breakpoint but meansthat you can enable it quickly for re-use in your current debugging session.If you disable a breakpoint, you can still view it in the Src or Dsm tab where it is shownas a white disc. Any accompanying downward pointing arrows are colored light gray.When you clear a breakpoint it is removed from the breakpoint list. To removebreakpoints from your Favorites List, use the Favorites Chooser/Editor dialog box, seeSetting breakpoints from your breakpoint Favorites List on page 4-76 for details of howto do this.This section describes:• Disabling breakpoints• Clearing breakpoints on page 4-73• Clearing all breakpoints on page 4-73.4.12.1 Disabling breakpointsYou can enable and disable breakpoints from the Code window:• In the Src tab:1. Right-click in the left margin, or on the line number, of a line marked witha red breakpoint icon, or on the icon itself.2. Select Disable Break from the context menu.• In the Break/Tracepoints pane, select the check box to unselect it so disabling thebreakpoint.• Right-click on the breakpoint in the Break/Tracepoints pane to display theBreak/Tracepoints menu. Select Disable from the menu.• Position the cursor at the breakpoint that you want to disable. Select Debug →Breakpoints → Enable/Disable Break at Cursor from the main menu.You can use these methods to:• enable a disabled breakpoint, marked by a white icon• enable, or disable, a conditional breakpoint, marked by a yellow icon• enable, or disable, tracepoints and thread breakpoints.4-72 Copyright © 2002-2005 <strong>ARM</strong> Limited. All rights reserved. <strong>ARM</strong> DUI 0153G
Working with Breakpoints4.12.2 Clearing breakpointsYou can clear breakpoints from the Code window in different ways:• In the Src tab, double-click on the line number of a line marked with a redbreakpoint icon or on the icon itself.• Right-click on the breakpoint in the Break/Tracepoints pane to display theBreak/Tracepoints menu. Select Clear from the menu.• Position the cursor at the breakpoint that you want to disable. Select Debug →Breakpoints → Toggle Break at Cursor from the main menu.You can use these methods to clear any type of breakpoint, for example a conditionalbreakpoint (marked by a yellow icon), or a tracepoint, or a thread breakpoint.NoteIf supported by your debug target, a RESET command can be used to carry out a processorreset. If you are using RVISS, a RESET command does not clear breakpoints ortracepoints.4.12.3 Clearing all breakpointsYou can clear all the breakpoints (and tracepoints) set on a selected debug target in oneoperation from the Code window, either:• Select Debug → Breakpoints → Clear All Break/Tracepoints from the mainmenu.• Click on the Pane menu in the Break/Tracepoints pane and select Clear AllBreak/Tracepoints.<strong>ARM</strong> DUI 0153G Copyright © 2002-2005 <strong>ARM</strong> Limited. All rights reserved. 4-73
Working with Breakpoints4.13 Setting breakpoints from saved listsThis section describes how to set breakpoints from various lists held by <strong>RealView</strong><strong>Debugger</strong>. If you use specific breakpoint definitions on a regular basis, then you canalso define your own breakpoint lists. This section includes:• Setting breakpoints from the Function/Label list• Setting breakpoints from the breakpoint history lists on page 4-75• Setting breakpoints from your breakpoint Favorites List on page 4-76.NoteThe lists described in this section can also be used for tracepoints. See the chapter thatdescribes tracing with <strong>RealView</strong> <strong>Debugger</strong> in the <strong>RealView</strong> <strong>Debugger</strong> v1.8 Extensions<strong>User</strong> <strong>Guide</strong> for details on working with tracepoints.4.13.1 Setting breakpoints from the Function/Label listYou can set a breakpoint on any number of the function names and labels in your image.The list of function names and labels in your image is available on the FunctionBreakpoint/Profile Selector dialog box. To display this dialog box, use one of thefollowing methods:• Select the following option from the Code window main menu:Debug → Breakpoints → Set Break/Tracepoint from List → Set fromFunction/Label list...• Select the following option from the Pane menu of the Break/Tracepoints pane:Set Break from Function/Label list...• Right-click on the background of the Break/Tracepoints pane, and select thefollowing option from the context menu:Set Break from Function/Label listSetting a breakpointTo use the Function Breakpoint/Profile Selector dialog box to set a breakpoint on achosen function:1. Click on the check box for those functions where you want to set a breakpoint.2. Click Set to set a breakpoint on the chosen functions.Because the browser is used only to make a selection, there are no controls fordebugging operations.4-74 Copyright © 2002-2005 <strong>ARM</strong> Limited. All rights reserved. <strong>ARM</strong> DUI 0153G
Working with BreakpointsThe Function Breakpoint/Profile Selector dialog box does not provide a record ofbreakpoints already set, that is, when you next open this dialog box existing breakpointsare not checked.4.13.2 Setting breakpoints from the breakpoint history listsYour personal history file, exphist.sav, is saved in your <strong>RealView</strong> <strong>Debugger</strong> homedirectory and is updated when you close down at the end of your session. It contains asnapshot of the current breakpoints across all your debug targets. The items in this listinclude breakpoints you have set during the current debugging session, and breakpointsyou have set from previous debugging sessions.To see the current breakpoint history, use one of the following methods:• Select the following option from the Code window main menu:Debug → Breakpoints → Set Break/Tracepoint from List... →Break/Tracepoint History...• Select the following option from the Pane menu of the Break/Tracepoints pane:Break/Tracepoint History...• Right-click on the background of the Break/Tracepoints pane, and select thefollowing option from the context menu:Break/Tracepoint History...Breakpoints are only added to the history list if they are set using breakpoint dialogboxes, for example the Set Address/Data Breakpoint or the Simple Break if X dialogbox. If you set a breakpoint in another way, for example using a CLI command, this isnot added to the list. To force this type of breakpoint to be added to the history list:1. Set the required breakpoint using the appropriate CLI command, for example:bi \DHRY_1\#153:12. Select View → Break/Tracepoints from the Code window main menu to displaythe Break/Tracepoints pane, shown in Figure 4-23 on page 4-64.3. Right-click anywhere along the required breakpoint entry (not on the check box)to display the Break/Tracepoints Entry context menu (see Using theBreak/Tracepoints Entry context menu on page 4-66).4. Select Edit Break/Tracepoint... to display the Set Address/Data Breakpointdialog box.5. Click OK to close the dialog box without changing the breakpoint details.<strong>ARM</strong> DUI 0153G Copyright © 2002-2005 <strong>ARM</strong> Limited. All rights reserved. 4-75
Working with BreakpointsSee Setting breakpoints from your breakpoint Favorites List for details of creatingbreakpoint favorites and adding existing breakpoints to your personal Favorites List.NoteIf you are using <strong>RealView</strong> <strong>Debugger</strong> on non-Windows platforms, the history file is onlycreated if you create and save a favorite, for example a breakpoint or watchpoint. SeeAppendix B <strong>RealView</strong> <strong>Debugger</strong> on Sun Solaris and Red Hat Linux for details.4.13.3 Setting breakpoints from your breakpoint Favorites ListWhen you first start to use <strong>RealView</strong> <strong>Debugger</strong> on Windows, your personal FavoritesList is empty. You can create breakpoints and add them directly to this list or you canadd breakpoints that you have been using in the current debugging session.<strong>RealView</strong> <strong>Debugger</strong> keeps a record of all breakpoints that you set during yourdebugging session as part of your history file. By default, at the end of your debuggingsession, these processor-specific lists are saved in the file exphist.sav in your <strong>RealView</strong><strong>Debugger</strong> home directory. This file also keeps a record of your favorites, for exampleBreak Qualifiers, Break Actions, and Break/Tracepoints.NoteYou must connect to a target to enable <strong>RealView</strong> <strong>Debugger</strong> favorites.You create and edit breakpoint favorites using the Favorites Chooser/Editor dialog box.This section describes how to use this dialog box, and contains:• Displaying the Favorites Chooser/Editor dialog box• Creating a new breakpoint favorite on page 4-77• Saving existing breakpoints as favorites on page 4-77.Displaying the Favorites Chooser/Editor dialog boxUse one of the following methods to display the Favorites Chooser/Editor dialog box:• Select the following option from the Code window main menu:Debug → Breakpoints → Set Break/Tracepoint from List →Break/Tracepoint Favorites...• Select the following option from the Pane menu of the Break/Tracepoints pane:Break/Tracepoint Favorites...• Right-click on the background of the Break/Tracepoints pane, and select thefollowing option from the context menu:4-76 Copyright © 2002-2005 <strong>ARM</strong> Limited. All rights reserved. <strong>ARM</strong> DUI 0153G
Working with BreakpointsBreak/Tracepoint Favorites...For full details on how to use the Favorites Chooser/Editor dialog box, see Using theFavorites Chooser/Editor dialog box on page 8-29.Creating a new breakpoint favoriteTo create a new breakpoint and add it to your Favorites List:1. Display the Favorites Chooser/Editor dialog box as described in Displaying theFavorites Chooser/Editor dialog box on page 4-76.2. Click New to display the New/Edit Favorite dialog box.3. Enter the CLI command to create the breakpoint and, optionally, a short textdescription to identify the breakpoint for future use.4. Click OK to confirm the entries and close the New/Edit Favorite dialog box.The Favorites Chooser/Editor dialog box is displayed with the newly-createdbreakpoint shown in the display list.5. Use the available controls to update the new breakpoint favorite (see FavoritesChooser/Editor dialog box interface components on page 8-30).Saving existing breakpoints as favoritesIf you have already set some breakpoints, <strong>RealView</strong> <strong>Debugger</strong> lets you choose which toadd to your Favorites List so that they are available to re-use in future debuggingsessions or with other build target configurations of your application program.To add existing breakpoints to your Favorites List:1. Select View → Break/Tracepoints to display the Break/Tracepoints pane.2. Highlight a breakpoint in the display list that you want to add to your FavoritesList.3. Right-click and select Break/Tracepoint Favorites... from theBreak/Tracepoints menu. This displays the Favorites Chooser/Editor dialog boxwith the breakpoint command included in the Add to List field.4. Click Add to List to add the specified breakpoint to your Favorites List. Thisdisplays the New/Edit Favorite dialog box.The Expression field contains the breakpoint details. The Description fieldenables you to enter a short text description to help you to identify the breakpoint.This text is optional.<strong>ARM</strong> DUI 0153G Copyright © 2002-2005 <strong>ARM</strong> Limited. All rights reserved. 4-77
Working with Breakpoints5. Click OK to confirm the breakpoint details and close the dialog box.The Favorites Chooser/Editor dialog box is updated to show the new breakpoint in thedisplay list. Because this breakpoint is already set, click Close to close the dialog box.If required, you can set another breakpoint from your Favorites List before closing thedialog box.The edited Favorites List is saved to your exphist.sav file, in your home directory, whenyou close <strong>RealView</strong> <strong>Debugger</strong>. For full details about the history file, see the chapter thatdescribes how to end your session in <strong>RealView</strong> <strong>Debugger</strong> v1.8 Essentials <strong>Guide</strong>.NoteIf you are using <strong>RealView</strong> <strong>Debugger</strong> on non-Windows platforms, the history file is onlycreated if you create and save a favorite, for example a breakpoint or watchpoint. SeeAppendix B <strong>RealView</strong> <strong>Debugger</strong> on Sun Solaris and Red Hat Linux for details.4-78 Copyright © 2002-2005 <strong>ARM</strong> Limited. All rights reserved. <strong>ARM</strong> DUI 0153G
Chapter 5Memory MappingThis chapter describes how to manage target memory in the <strong>RealView</strong> ® <strong>Debugger</strong>Process Control pane. It contains the following sections:• About memory mapping on page 5-2• Enabling and disabling memory mapping on page 5-4• Setting up a memory map on page 5-5• Viewing the memory map on page 5-7• Editing map entries on page 5-12• Setting top_of_memory and stack values on page 5-13• Generating linker command files for non-<strong>ARM</strong> targets on page 5-14.<strong>ARM</strong> DUI 0153G Copyright © 2002-2005 <strong>ARM</strong> Limited. All rights reserved. 5-1
Memory Mapping5.1 About memory mappingMemory mapping is disabled by default when you first connect to your debug target,that is all memory is treated as RAM. If you are working with a suitable target you canenable memory mapping and then configure the memory using the Map tab in theProcess Control pane. The memory map is usually configured in a BCD file that youassociate with the connection (see <strong>RealView</strong> <strong>Debugger</strong> v1.8 Target Configuration <strong>Guide</strong>for more details).This section includes:• Uses for memory mapping• Memory map considerations on page 5-3.5.1.1 Uses for memory mappingMemory mapping might be useful depending on the debug target you are using and theapplications you are developing:• If you are working with a simulator, or development board, to develop yourapplication program, mapping memory ensures that you are not trying to loadyour image into memory that does not exist on the real hardware.• If you are working with different types of memory, memory mapping enables youto load an image and specify the exact location of different sections of memory.• If your application contains pointers or stacks, or other uses outside declaredareas, it might not work correctly on the final hardware. Mapping memory as Automakes these errors visible.• You can declare and program Flash memory with appropriate support files.• Memory mapping can be used to generate linker information when developing ascatterloaded application. This is not supported by <strong>ARM</strong> ® architecture-basedtargets.• Memory mapping enables <strong>RealView</strong> <strong>Debugger</strong> to handle shared memory so thatreferences are updated when modified by a different processor. This also preventssoftware breakpoints in shared code memory.• If you are using a simulator that supports it, you can map memory to add waitstates to obtain better cycle accuracy when profiling or measuring performance.• Like register modeling, memory mapping provides a means for systemdevelopers to tell users about the memory configuration on boards, chips or insimulator models.5-2 Copyright © 2002-2005 <strong>ARM</strong> Limited. All rights reserved. <strong>ARM</strong> DUI 0153G
Memory Mapping5.1.2 Memory map considerationsWhen working with memory mapping, you must be aware of the following:• The top_of_memory value must be higher than the sum of the program base addressand program size. If set incorrectly, your program might crash because of stackcorruption or because your program overwrites its own code.• There is no requirement that the address specified by top_of_memory is at the truetop of memory. A C or assembler program can use memory at higher addresses.• If you are working with a scatterloaded application, you must define the locationof stack and heap in your code.• The default memory model for <strong>RealView</strong> <strong>ARM</strong>ulator ® ISS (RVISS) createsmemory pages as required through the whole address space, and, therefore, theRVISS configuration file can specify a value for top of stack that is in highmemory.• When an image is loaded to a debug target, the memory map is checked toconfirm that it is valid to load to the locations specified in the executable program.Memory is loaded and then read back to verify a successful load and to confirmthat genuine memory is present. Memory sections defined as Auto are alsoupdated to reflect the access type specified in the executable image.• By default, <strong>RealView</strong> <strong>Debugger</strong> tries to set a software breakpoint. However,where enabled, the memory map determines the type of breakpoint that you canset. For example, only hardware breakpoints can be set in Flash and ROM.• The memory map is used to define how memory contents are color coded whendisplayed in the Memory pane.<strong>ARM</strong> DUI 0153G Copyright © 2002-2005 <strong>ARM</strong> Limited. All rights reserved. 5-3
Memory Mapping5.2 Enabling and disabling memory mappingTo enable memory mapping before you load an image:1. Connect to a suitable target.2. Select View → Memory Map tab to display the Process Control pane and bringthe Map tab to the front. The pane is displayed as a floating pane.Alternatively, if you have an instance of the Process Control pane that is docked,select the Map tab in that pane.3. Right-click anywhere in the Map tab to display the Map context menu (see Usingthe Map tab context menu on page 5-10).4. Click on the option Toggle Memory Mapping so that it is checked.This enables memory mapping ready to load your image.5. To disable memory mapping, right-click anywhere in the Map tab to display theMap context menu.The context menu contains different options depending on the state of your debugtarget. For example, if you load an image the menu contains the option UpdateMap based on Image.6. Click on the option Toggle Memory Mapping so that it is unchecked.This disables memory mapping ready to load your image.See Using the Map tab context menu on page 5-10 for details on the other optionsavailable from this menu.NoteIf you have assigned a board-chip definition file to a target connection, and thatboard-chip definition defines a memory map, then memory mapping is automaticallyenabled when you connect to that target. See the chapter that describes configuringcustom targets in <strong>RealView</strong> <strong>Debugger</strong> v1.8 Target Configuration <strong>Guide</strong> for details ofconfiguring your target this way.5-4 Copyright © 2002-2005 <strong>ARM</strong> Limited. All rights reserved. <strong>ARM</strong> DUI 0153G
Memory Mapping5.3 Setting up a memory mapMapping memory, before you load an image for debugging, enables you to have fullaccess to all the memory on your debug target. You can do this:• as part of your target configuration settings• using an include file• interactively using the Map tab• by submitting the appropriate CLI commands.In this example, you are going to set up memory manually for the current session. Targetmemory settings defined in this way are only temporary and are lost when youdisconnect from the target. See the chapter that describes configuring custom targets in<strong>RealView</strong> <strong>Debugger</strong> v1.8 Target Configuration <strong>Guide</strong> for details of how to configure amemory map as part of your target configuration settings.With memory mapping enabled, set up your map in the Process Control pane:1. Right-click on the Start entry in the Map tab to display the Map context menu(see Using the Map tab context menu on page 5-10).2. Select Add or Copy Map Entry... to display the Add/Copy/Edit Memory Mapdialog box, shown in Figure 5-1.Figure 5-1 Add/Copy/Edit Memory Map dialog box<strong>ARM</strong> DUI 0153G Copyright © 2002-2005 <strong>ARM</strong> Limited. All rights reserved. 5-5
Memory MappingNoteIn <strong>RealView</strong> <strong>Debugger</strong>, memory mapping is defined by a start address and a blocksize by default, not by an end address. If you want to specify the end address, youmust unselect the End is inclusive Length (vs Addr.) check box.3. Edit the dialog box to change the default memory mapping as follows:a. Enter 0x0 in the Start Addr field.b. Enter 0x8000 in the End field to specify the block size.4. Enter Area before image in the Description field to describe this block.5. Click OK to confirm your changes and the Process Control Map tab is updated.6. Set up the second block of memory using these settings:a. Start address = 0x8000b. Length = 0x8000c. Description = Middle7. Click OK to confirm your changes and the Process Control Map tab is updated.8. Set up the third block of memory using these settings:a. Start address = 0x10000b. Length = 0xFFFF0000c. Description = Area after image9. By default, memory access is set to byte-size (8 bits) for <strong>ARM</strong> processors. Do notchange this.10. Click OK to confirm your changes and update the Process Control Map tab,shown in Figure 5-2.Figure 5-2 Memory mapped5-6 Copyright © 2002-2005 <strong>ARM</strong> Limited. All rights reserved. <strong>ARM</strong> DUI 0153G
Memory Mapping5.4 Viewing the memory mapThe Process Control pane provides a view of the memory mapping for the debug targetthat is running your application. This section describes how to use the map:• Working with the Map tab• Memory map configuration on page 5-8• Using the Map tab context menu on page 5-10.5.4.1 Working with the Map tabTo view the memory map:1. Connect to a suitable debug target.2. Enable memory mapping (see Enabling and disabling memory mapping onpage 5-4).3. Load an image, for example dhrystone.axf4. Select View → Memory Map tab to display the Process Control pane and bringthe Map tab to the front. The pane is displayed as a floating pane.Alternatively, if you have an instance of the Process Control pane that is docked,select the Map tab in that pane.5. Click on the plus signs to expand the entries, shown in Figure 5-3 on page 5-9.The Map tab displays a tree-like structure for each component of the memory mapshowing the start address, size, and access rule. A one-line text description can also beincluded. The way that memory is shown depends on your debug target because<strong>RealView</strong> <strong>Debugger</strong> populates this tab from:• built-in knowledge about the processor• target configuration information• the description in the target vehicle.For example, if you are working with an <strong>ARM</strong> architecture-based target, the first entryin the memory map shows Start (see Figure 5-3 on page 5-9) if the memory access ruleis defined as Any. If you are using a DSP-based target, the first entry in the map showsthe access rule for the type of memory at that location, for example Prog. Colored iconsare used to show the type of memory defined, see Display colors on page 5-8.With an image loaded, the Map tab is updated from details in the image itself. Thememory map is also automatically updated if any registers change that affect memorymapping.<strong>ARM</strong> DUI 0153G Copyright © 2002-2005 <strong>ARM</strong> Limited. All rights reserved. 5-7
Memory Mapping5.4.2 Memory map configurationThe memory map for a chosen processor is configured under the following headings:TypeAccessStartSizeAccess sizeFilledThe type of memory page, for example Prog, I/O, Data. Where no suchdefinition is given, the type is set to Any.Defines the access rules for the memory:RAM Memory is readable and writable.ROM Memory is read-only.WOM Memory is write-only.NOM No memory.Auto Memory is defined by the application currently loaded. If thereis no application loaded, this shows NOM.Prompt You are prompted to confirm that this type of memory ispermitted for the loaded application. If there is no applicationloaded, this shows NOM.Flash Memory is readable and, if a Flash programming method file(*.fme) is present, writable.The memory area is defined by the start address and the size. This definesthe start address of the memory area.Defines the size of the memory area.Defines the size of memory accesses.This shows if a range contains data loaded from an application program.Description A text description of the purpose of the memory supplied as part of theautomatic mapping. You can also supply this information yourself (seeSetting up a memory map on page 5-5).To see details about a map entry, right-click on the chosen entry and select Propertiesfrom the context menu. This displays a text description of the type of memory definedat this location.Display colorsWhen using the Map tab to view the memory map, <strong>RealView</strong> <strong>Debugger</strong> uses coloredicons to make the display easier to read and to highlight the different memorydefinitions, shown in the example in Figure 5-3 on page 5-9.5-8 Copyright © 2002-2005 <strong>ARM</strong> Limited. All rights reserved. <strong>ARM</strong> DUI 0153G
Memory MappingFigure 5-3 Colors in the memory mapIn this example, memory has been mapped, using a Board/Chip definition file, todeclare Flash. See the chapter that describes configuring custom targets in <strong>RealView</strong><strong>Debugger</strong> v1.8 Target Configuration <strong>Guide</strong> for details of configuring your target thisway.Colored icons enable you to identify the memory access defined:• white (open) indicates one of the following:— no memory type is defined— you have set the memory to Auto, that is, auto-define as RAM when imageloads into it— you have set the memory to Prompt, that is, prompt if image loads into it.• blue indicates RAM• yellow indicates ROM• green indicates Flash memory known to <strong>RealView</strong> <strong>Debugger</strong>• red indicates write-only memory (WOM)• red cross indicates no accessible memory (NOM) is defined.Also, see Display colors on page 5-8 for a description of the display colors in theMemory pane.<strong>ARM</strong> DUI 0153G Copyright © 2002-2005 <strong>ARM</strong> Limited. All rights reserved. 5-9
Memory Mapping5.4.3 Using the Map tab context menuThe Map tab context menu enables you to add new mappings or to update existing ones.The options are:Add or Copy Map Entry...Displays the Add/Copy/Edit Memory Map dialog box, shown inFigure 5-1 on page 5-5, where you can create a new map entry based onan existing entry.Edit Map Entry...Displays the Add/Copy/Edit Memory Map dialog box, shown inFigure 5-1 on page 5-5, where you can edit a map entry.Update Map based on ImageUpdates the memory map based on details held in the loaded image.Update Map based on ProcessorReads those registers that affect the memory maps. This is doneautomatically for built-in map registers but might be required if you areusing external map registers, defined in the target configuration settings.Select this option to force <strong>RealView</strong> <strong>Debugger</strong> to read the registers andso update the memory map.Save Map to Linker Command file...Writes the current map state to a new or existing linker command file.This inserts or edits the MEMORY definitions in the linker command file, andenables the proper loading of an application based on actual memorysettings. See Generating linker command files for non-<strong>ARM</strong> targets onpage 5-14 for full details of how to generate this file for targets other than<strong>ARM</strong> targets.Delete Map EntryDeletes the map entry under the pointer. There is no undo.Reset Map (Delete All)Redefines the memory map to the initial state based on processorinformation, target configuration information, and processor registers.There is no undo.Toggle Memory MappingEnables or disables memory mapping. When checked, memory mappingis enabled.5-10 Copyright © 2002-2005 <strong>ARM</strong> Limited. All rights reserved. <strong>ARM</strong> DUI 0153G
Memory MappingProperties...Displays information about the selected memory map entry.<strong>ARM</strong> DUI 0153G Copyright © 2002-2005 <strong>ARM</strong> Limited. All rights reserved. 5-11
Memory Mapping5.5 Editing map entriesYou can edit any memory map entry except for those that have default mapping. To edita memory map entry using the Map tab:1. Right-click on the map entry in the display list to display the context menu.2. Select the option Edit Map Entry... to display the Add/Copy/Edit Memory Mapdialog shown in Figure 5-1 on page 5-5.3. Use the Start Addr field to define the starting location for the mapping. Thisalready contains the start address for the chosen block, shown in the Map tab.4. Use the End field to define the block size for the mapping. By default, thisspecifies the size of the memory block to be defined. If you want to specify theend address, rather than the block size, unselect the check box End is inclusiveLength (vs. Addr) and then enter the address in the End field, for example0xFFFFFFF0.<strong>RealView</strong> <strong>Debugger</strong> automatically sets the size you specify. If the computed sizedoes not fall on a page boundary an error dialog is displayed and you mustresubmit the block size.Entering a value of 0x0 remaps all memory from the starting address.5. Highlight the access type in the display list, for example RAM.6. Enter the memory type to be allocated, for example Any.7. Enter a description of the new memory map settings, for example New test memoryentry.8. Click OK to confirm your new settings and to update the Map tab.<strong>RealView</strong> <strong>Debugger</strong> displays a warning if you have entered any values incorrectly, forexample a mismatch on start and end addresses. Correct these entries and click OK.When all entries are valid, the dialog box closes and <strong>RealView</strong> <strong>Debugger</strong> updates theMap tab.5.5.1 Updating map entries based on registersIf you are connected to a debug target that uses register-controlled remapping, forexample the <strong>ARM</strong> Integrator /AP board, the Map tab also displays the effects of anychanges made to these registers. In this case, right-click on the first entry and selectUpdate Map based on Processor from the Map context menu (see Using the Map tabcontext menu on page 5-10) to update the display based on these memory-mappedregisters.5-12 Copyright © 2002-2005 <strong>ARM</strong> Limited. All rights reserved. <strong>ARM</strong> DUI 0153G
Memory Mapping5.6 Setting top_of_memory and stack valuesIf defined, the top_of_memory variable specifies the highest address in memory that theC library can use for stack space. By default, a semihosting call returns top_of_memory.Stack and base are then set to be immediately below top_of_memory.<strong>RealView</strong> <strong>Debugger</strong> uses default settings for stack and base that are target-dependent.For both RVISS and <strong>ARM</strong> processors, the default setting for top_of_memory is 0x80000.When you first connect to an <strong>ARM</strong> architecture-based debug target, <strong>RealView</strong><strong>Debugger</strong> displays a warning message in the Cmd tab:Warning: No stack/heap or top of memory defined - setting top_of_memory to0x80000.To avoid this message, permanently set top_of_memory using the Connection Propertieswindow. Configure this for your debug target so that it is used whenever you connectwith <strong>RealView</strong> <strong>Debugger</strong>. See the chapter that describes configuring custom targets in<strong>RealView</strong> <strong>Debugger</strong> v1.8 Target Configuration <strong>Guide</strong> for details of how memory isconfigured in <strong>ARM</strong> architecture-based debug targets, and for an example of how to setup your memory map.You can set top_of_memory, and other <strong>ARM</strong> runtime controls specific to <strong>ARM</strong>processors, as part of a project definition. However, the available options depend onyour target processor and target vehicle.You can also set top_of_memory on a temporary basis, that is for the current session,using the @top_of_memory register. To do this select Debug → Memory/RegisterOperations → Set Register... to display the Interactive Register Setting dialog box,where the register contents can be changed.NoteIf you are using the default RVISS to simulate an <strong>ARM</strong> processor, this is not a suitabletarget for setting top_of_memory in this way.<strong>ARM</strong> DUI 0153G Copyright © 2002-2005 <strong>ARM</strong> Limited. All rights reserved. 5-13
Memory Mapping5.7 Generating linker command files for non-<strong>ARM</strong> targetsThe memory map, shown in the Process Control Map tab, can be used to generate ormodify a MEMORY section of a linker command file used when you build your program.This MEMORY directive information can then be used to position various sections of anapplication correctly. For details of how to set up such command options see the chapterthat describes customizing projects in <strong>RealView</strong> <strong>Debugger</strong> v1.8 Project Management<strong>User</strong> <strong>Guide</strong>.NoteLinker command files are not currently supported by <strong>ARM</strong> targets.To generate or modify a linker command file:1. Right-click on the start address at the top of the entries and select Save Map toLinker Command File... from the context menu.2. Specify the location of the file in the Select Linker Command File to Create orModify dialog box. Remember that:• If the file already exists, <strong>RealView</strong> <strong>Debugger</strong> looks for a MEMORY directiveblock created previously and, if found, replaces that block.• If the file already exists, but no MEMORY directive block exists, <strong>RealView</strong><strong>Debugger</strong> locates the first MEMORY section and inserts the MEMORY directiveblock before it.• If the file already exists, <strong>RealView</strong> <strong>Debugger</strong> makes a backup copy beforeupdating the contents.• If there is no existing file, <strong>RealView</strong> <strong>Debugger</strong> creates the specified fileready to accept the MEMORY directive block.The <strong>RealView</strong> <strong>Debugger</strong> linker command file generation process uses the built-inautomatic memory mapping to generate data based on the connected target settings, forexample the registers that control mapping.The data recorded in the generated MEMORY block includes each internal RAM, ROM, andFlash section as appropriate. Each section is allocated a predefined name. All externalmemory added using the Map tab, or defined automatically from a loaded image, isallocated a name based on the characteristics of the memory.The linker file format is processor-specific. If none is known, <strong>RealView</strong> <strong>Debugger</strong> usesa default format based on TI tools.Example 5-1 on page 5-15 shows an example of a generated linker command file, inDSP format.5-14 Copyright © 2002-2005 <strong>ARM</strong> Limited. All rights reserved. <strong>ARM</strong> DUI 0153G
Memory MappingExample 5-1/* Linker Command file for the DSPxx processor *//* This file was generated by RVDEBUG. You can edit everythingoutside the MEMORY block defined by RVDEBUG. Updates byRVDEBUG will only effect that block. *//* RVDEBUG: generated data block. Updated Fri Apr 04 15:10:41 2003Do not modify this block. Do not put MEMORY lines abovethis line, put below end of this block. */MEMORY{/* Register @YYYY has (masked) value 0068 */PAGE 0: PDaRam: org=0x0080, len=0x177F /* internal 'Dual-Access' */PAGE 0: P_RAM: org=0x8000, len=0x032D /* external 'Sect .text' */PAGE 1: DMapReg: org=0x0000, len=0x005F /* internal 'Registers (mapped)' */PAGE 1: DScrDaRam: org=0x0060, len=0x001F /* internal 'Scratch Dual-Access' */PAGE 1: DLDaRam: org=0x0080, len=0x177F /* internal 'Dual-Access' */PAGE 1: D_RAM: org=0x8000, len=0x0085 /* external 'Sect .bss,.stack' */PAGE 1: DHRom(R): org=0xC000, len=0x3EFF /* internal 'Internal program-ROM' */}/* RVDEBUG: generated data above */This example shows a combination of internal memory based on current registersettings (@YYYY) in addition to external memory as defined by the loading of a program.The following notes apply to this automatic file generation process:• If <strong>RealView</strong> <strong>Debugger</strong> creates the linker command file a comments section isinserted in the file reporting that it was generated by <strong>RealView</strong> <strong>Debugger</strong>, shownin Example 5-1.• If a file already exists and is being updated by <strong>RealView</strong> <strong>Debugger</strong>, the commentssection is not inserted. <strong>RealView</strong> <strong>Debugger</strong> then inserts the generated commandsabove the original user-generated commands.• If a file already exists and contains a <strong>RealView</strong> <strong>Debugger</strong> generated data blockthen this section is replaced when <strong>RealView</strong> <strong>Debugger</strong> updates the command file.<strong>ARM</strong> DUI 0153G Copyright © 2002-2005 <strong>ARM</strong> Limited. All rights reserved. 5-15
Memory Mapping5-16 Copyright © 2002-2005 <strong>ARM</strong> Limited. All rights reserved. <strong>ARM</strong> DUI 0153G
Chapter 6Working with Debug ViewsThis chapter describes how to monitor your program during execution using panes andviews in the <strong>RealView</strong> ® <strong>Debugger</strong> Code window. It contains the following sections:• Working with registers on page 6-2• Working with memory on page 6-19• Working with the stack on page 6-30• Using the call stack on page 6-36• Working with watches on page 6-40.<strong>ARM</strong> DUI 0153G Copyright © 2002-2005 <strong>ARM</strong> Limited. All rights reserved. 6-1
Working with Debug Views6.1 Working with registersThe Register pane displays the contents of processor registers and enables you tochange those contents. Where appropriate, the pane shows registers using enumerationsto make it easier to read the details, and enables you to enter new values in this format.The Register pane updates the register values to correspond to the current programstatus each time the target processor stops.The registers that are visible depend on your debug target, that is your processor and thedebug interface. See your processor hardware documentation for details onprocessor-specific statistics. For information on different debug interfaces, see theappropriate documentation, for example:• <strong>RealView</strong> ICE <strong>User</strong> <strong>Guide</strong>• Multi-ICE ® <strong>User</strong> <strong>Guide</strong>• <strong>ARM</strong> MultiTrace <strong>User</strong> <strong>Guide</strong>.This section describes the options available when working with registers. It contains thefollowing sections:• Displaying register contents• Formatting options on page 6-4• Changing register contents on page 6-6• Viewing different registers on page 6-7• Understanding the register view on page 6-9• Viewing debugger internals on page 6-11• Defining new registers on page 6-18• Interactive operations on page 6-18.6.1.1 Displaying register contentsTo examine the contents of registers:1. Select View → Registers to display the Register pane and bring the Core tab tothe front.2. Connect to your target and load an image, for example dhrystone.axf.3. Select Edit → Advanced → Show Line Numbers to display line numbers.This is not necessary but might help you to follow the examples.4. Click on the Src tab to view the source file dhry_1.c.5. Set a default breakpoint by double-clicking on line 301.6. Click Run to start execution.6-2 Copyright © 2002-2005 <strong>ARM</strong> Limited. All rights reserved. <strong>ARM</strong> DUI 0153G
Working with Debug Views7. Enter 5000 when asked for the number of runs.The program starts and then stops when execution reaches the breakpoint at line301. The red box marks the location of the PC when execution stops.8. The contents of the Register pane are updated to show the program status as thetarget stops, shown in Figure 6-1.Figure 6-1 Register pane9. Click on the Core tab to view base registers for your target processor.The Register pane displays tabs appropriate to the target processor running yourimage and the target interface. Different target processors contain differentregisters and so the contents of this pane change depending on the target you aredebugging.For more details on the contents of this pane see:• Viewing different registers on page 6-7 for examples of other tabs.• Understanding the register view on page 6-9 for information on registers.• Viewing debugger internals on page 6-11 for information on debuggerinternals and statistics.10. Click High-level Step Into to execute one instruction and then stop. Registervalues that have changed, since the last update, are displayed in dark blue.11. Click High-level Step Into a few more times and examine the register values asthey change.12. Right-click on a changed register and select View Memory At Value to use thechosen value as the starting address for a memory display.<strong>ARM</strong> DUI 0153G Copyright © 2002-2005 <strong>ARM</strong> Limited. All rights reserved. 6-3
Working with Debug ViewsThe first time you perform this operation in a debugging session, a new instanceof the Memory pane is displayed as a floating pane. Subsequent View MemoryAt Value operations use this instance of the Memory pane to display the memorycontents, even if you have docked that pane.If you change the docked instance of the Memory pane to a different pane view(such as Process Control), and you later perform the View Memory At Valueoperation, the docked Memory pane is redisplayed to the right of the changedpane view (Process Control in this example).This Memory pane is also used if you perform the view memory operations fromthe Watch pane or the File Editor pane.13. Monitor changes in the Register pane as you step through your program.14. Double-click on the red marker disc to clear the breakpoint at line 301.NoteIf you are using <strong>RealView</strong> <strong>ARM</strong>ulator ® ISS (RVISS), as in this example, registers insome <strong>ARM</strong> ® cores are incompletely modeled, that is:• <strong>ARM</strong>925T , wait for interrupt• <strong>ARM</strong>966E -Sr2, TCM register size missing• <strong>ARM</strong>946E -Sr1, r13 trace PID• <strong>ARM</strong>926EJ -S, r13 context ID writing to the wrong register• <strong>ARM</strong>720T r4, does not distinguish trace PID and FCSE r13.Display colorsWhen using the Register pane to view register contents, <strong>RealView</strong> <strong>Debugger</strong> uses colorto make the display easier to read and to highlight significant events:• Black indicates values that are unchanged for the previous two updates.• Dark blue shows those values that have changed since the last update.• Light blue indicates a value that changed at the previous update.6.1.2 Formatting optionsYou can change the way register values are displayed in the Register pane.6-4 Copyright © 2002-2005 <strong>ARM</strong> Limited. All rights reserved. <strong>ARM</strong> DUI 0153G
Working with Debug ViewsGlobal formatting of all registersClick the Pane menu to select formatting options for all registers currently displayed.This applies formatting to all registers, except those registers that you have specificallyformatted on an individual basis. For example, you might want to display contents asvalues rather than enumerations, or to display values in decimal format. This changeapplies to all tabs in the Register pane.Use the option Copy Pane to take a snapshot of the top-level pane display. You can thencopy this, for example into a text editor, so that you can compare registers and values.For selected registersYou can change the display format for a single register while viewing other registers inthe default format. Right-click on a chosen register, for example R3, to display theRegister context menu.This menu enables you to change the format of the chosen register, to view theproperties, or to change the register contents, for example, select Increment to add oneto the current value. You can also select from a list of previously used values to updatethe current contents.The values of the FIQ, IRQ, STATE, and MODE fields of the CPSR register can be set usingnames that enumerate to numerical values. The options offered on this menu depend onthe register currently under the mouse pointer. Position your pointer over the MODE fieldvalue of the CPSR register, which is set to SVC by default, and then right-click to displaythe status register context menu.You can use this menu to change the register contents, or pick from a list of valuesappropriate to this register.Select Set Enumeration... to display the selection box shown in Figure 6-2.Figure 6-2 Setting enumeration values<strong>ARM</strong> DUI 0153G Copyright © 2002-2005 <strong>ARM</strong> Limited. All rights reserved. 6-5
Working with Debug ViewsThis dialog enables you to select a new value for the chosen register or to use anexpression to define the contents. For example, highlight the entry . Click OK to display a box where you can enter the value orchoose from a drop-down list.As you change a value in a CPSR register field, the CPSR register value is also updated.6.1.3 Changing register contentsYou can use in-place editing to change register contents in the Register pane. There are,however, other ways to set register values from the Code window:• Set the contents of a register by pasting variables from other windows. Forexample, right-click on a value in the source-level view and select Copy from thecontext menu. Right-click in the register whose value you want to change andselect Paste Value from the context menu.• If you want to use a favorite data value that you have saved, right-click on aregister and select Set from Favorites from the context menu to display aFavorites Chooser/Editor dialog box (see Using the Favorites Chooser/Editordialog box on page 8-29).• Highlight a value in the Src tab in the File Editor pane and then use drag-and-dropto copy the expression into the contents of a chosen register in the Register pane.See Dragging and dropping expressions into register contents for an example.• Select Debug → Memory/Register Operations → Set Register... from theCode window main menu to display the Interactive Register Setting dialog box.Any register contents you change are displayed in blue.NoteYou can also set breakpoints on memory mapped registers but not on core registers,because breakpoints are set on addresses and core registers do not have addresses.Dragging and dropping expressions into register contentsYou can drag and drop an expression from a source file into the contents of a registerfunction name. The following example shows how to you can set the PC register to theaddress of a function:1. Load the dhrystone.axf image.2. Enable line numbering and locate line 149 in the dhry_1.c source.6-6 Copyright © 2002-2005 <strong>ARM</strong> Limited. All rights reserved. <strong>ARM</strong> DUI 0153G
Working with Debug Views3. Double-click on the Proc_5 function name.4. Click on the function name, and drag it to the PC register.The address of the Proc_5 function is loaded into the PC register, and the sourcelevel view changes to show the code for the Proc_5 function. The Dsm tab is alsoupdated.NoteIf the function code is in a different source file, and that source file is not open,<strong>RealView</strong> <strong>Debugger</strong> cannot determine the context, and informs you of this in theSrc tab. However, the Dsm tab is updated.Updating register contentsThe Register pane updates automatically when register contents change. This is set bydefault, as indicated by the checked option Automatic Update on the Pane menu.If you change this default option, you must update the pane display manually. SelectUpdate Window from the Register pane context menu to update the view. <strong>RealView</strong><strong>Debugger</strong> updates the pane contents and displays changed values in blue for improvedreadability.6.1.4 Viewing different registersThe Register pane displays tabs and registers appropriate to your:• target processor, that is different target processors contain different registers andso the contents of this pane change depending on the target you are debugging• target interface, for example <strong>RealView</strong> ICE• target configuration, for example if you are using a .bcd file, the pane includesextra tabs to provide extended target visibility.In Figure 6-3 on page 6-8, the Register pane shows registers for an <strong>ARM</strong>940T core andthe <strong>ARM</strong> Integrator /AP board using Multi-ICE.<strong>ARM</strong> DUI 0153G Copyright © 2002-2005 <strong>ARM</strong> Limited. All rights reserved. 6-7
Working with Debug ViewsFigure 6-3 Registers for an <strong>ARM</strong>940T debug targetHere you can see the CP15 tab and other tabs relating to processor-specific operations,for example Data Regions, Cache Operations, and TLB Operations (TranslationLookaside Buffers). These are special registers and are described in full in the processorhardware documentation.In the example in Figure 6-4, the Register pane displays register contents for aCEVA-Oak debug target.Figure 6-4 Registers for a CEVA-Oak debug targetHere you can see the Status tab displaying the status registers.6-8 Copyright © 2002-2005 <strong>ARM</strong> Limited. All rights reserved. <strong>ARM</strong> DUI 0153G
Working with Debug ViewsManaging multiple targetsIf you are licensed to use multiprocessor debugging mode you can access differentregisters on multiple debug targets at the same time. To do this, set up multiple Codewindows, attach each window to a different debug target and then display the registersfor each target. <strong>RealView</strong> <strong>Debugger</strong> enables you to set up several Register panes withdifferent formatting options for each.For details on setting up multiple Code windows and attaching to different debugtargets, see the multiprocessing chapter in <strong>RealView</strong> <strong>Debugger</strong> v1.8 Extensions <strong>User</strong><strong>Guide</strong>.6.1.5 Understanding the register view<strong>ARM</strong> processors support up to seven processor modes depending on the architectureversion, for example <strong>User</strong> (USR), Supervisor (SVC), and FIQ. All modes, except <strong>User</strong>mode, are referred to as privileged modes.<strong>ARM</strong> processors have thirty-seven registers arranged in partially overlapping banks.There is a different register bank for each processor mode, for example USER or FIQ.Using banked registers gives rapid context switching for dealing with processorexceptions and privileged operations.<strong>RealView</strong> <strong>Debugger</strong> displays registers in named groups to reflect how registers arebanked, for example USR, IRQ, and FIQ for an <strong>ARM</strong>7TDMI ® core. Click on the plus, orminus, sign to expand, or collapse, the view (shown in Figure 6-5 on page 6-10).<strong>ARM</strong> DUI 0153G Copyright © 2002-2005 <strong>ARM</strong> Limited. All rights reserved. 6-9
Working with Debug ViewsFigure 6-5 Viewing registersAt first sight, it might appear that some registers are missing or that extra registers arevisible for different processor modes. For example, FIQ contains R8, R9, R10, R11, R12, SP,LR, and SPSR. These are the registers in the bank for that processor mode that are bankedout when an FIQ exception occurs.However, USR also contains R8, R9, R10, R11, R12, SP, and LR. These are banked outregisters indirectly accessible with LDM and STM instructions of the form:LDM rX, (r8-r14)^STM rX, (r8-r14)^These examples use the ^ suffix to specify that data is transferred into or out of the USRmode registers. The register list must not contain the PC.You must load banked out registers from memory to modify them, and you must storethem to memory to read them. However, they might be of interest when writing taskcontext switch code or a coprocessor emulator.For full details on LDM and STM commands see the appropriate documentation, forexample:• <strong>RealView</strong> Compilation Tools Assembler <strong>Guide</strong>• <strong>RealView</strong> Compilation Tools Developer <strong>Guide</strong>.6-10 Copyright © 2002-2005 <strong>ARM</strong> Limited. All rights reserved. <strong>ARM</strong> DUI 0153G
Working with Debug Views6.1.6 Viewing debugger internalsDepending on your debug target, debugger internals appear in tabs in the Register pane:• Viewing RVISS cycle counts• Viewing internal variables on page 6-12• Viewing semihosting controls on page 6-13.Viewing RVISS cycle countsIf you are using RVISS to simulate a target processor, and connect to RVISS using the<strong>RealView</strong> Connection Broker interface, the CycleCount tab displays a range of internalcycle count variables. What is shown depends on the processor that you have chosen tosimulate, for example Figure 6-6 shows the display for an <strong>ARM</strong>7TDMI core.Figure 6-6 shows:Instructions The number of program instructions executed.Figure 6-6 Viewing CycleCount tab (RVISS)Core_CyclesInternal core cycles indicating the time an instruction spends in theexecute stage of the pipeline.S_CyclesN_CyclesThe number of sequential cycles performed. The CPU requests transferto, or from, the same address, or an address that is a word or halfwordafter the address used in the preceding cycle.The number of nonsequential cycles performed. The CPU requeststransfer to, or from, the same address, or an address that is unrelated tothe address used in the preceding cycle.<strong>ARM</strong> DUI 0153G Copyright © 2002-2005 <strong>ARM</strong> Limited. All rights reserved. 6-11
Working with Debug ViewsI_CyclesC_CyclesTotalThe number of internal cycles performed. The CPU does not require atransfer because it is performing an internal function (or running fromcache).The number of coprocessor cycles performed.The sum of the S_Cycles, N_Cycles, I_Cycles, and C_Cycles.For information on what is shown for different target processors, see:• the section that describes RVISS cycle types in the <strong>RealView</strong> <strong>ARM</strong>ulator ISS <strong>User</strong><strong>Guide</strong>• the hardware documentation for the target processor you are simulating.Viewing internal variables<strong>RealView</strong> <strong>Debugger</strong> uses internal variables like any other program. These are set up aspart of the target device configuration or the BCD file configuration. The variables ituses depend on your debug target. If you are using <strong>RealView</strong> ICE, Multi-ICE, or theRDI interface of RVISS, you see a different set of debugger internals in the Debug tab.An example of the Debug tab for <strong>RealView</strong> ICE is shown in Figure 6-7 on page 6-13.NoteThe RDI connection to RVISS in <strong>RealView</strong> <strong>Debugger</strong> is deprecated in this release.NoteIt is strongly recommended that you do not change the semihosting <strong>ARM</strong> and Thumb ®SWI numbers. If you do, you must:• change all the code in your system, including library code, to use the new SWInumber• change the <strong>ARM</strong>_SWI and Thumb_SWI settings to use the new SWI numbers.6-12 Copyright © 2002-2005 <strong>ARM</strong> Limited. All rights reserved. <strong>ARM</strong> DUI 0153G
Working with Debug ViewsFigure 6-7 Viewing internal variables (<strong>RealView</strong> ICE)For information on what is shown for different target interfaces, see the appropriatedocumentation:• <strong>RealView</strong> ICE <strong>User</strong> <strong>Guide</strong>• Multi-ICE <strong>User</strong> <strong>Guide</strong>• the hardware documentation for your target processor.Viewing semihosting controlsSemihosting enables code running on an <strong>ARM</strong> architecture-based target to use facilitieson a host computer that is running <strong>RealView</strong> <strong>Debugger</strong>. Examples of such facilitiesinclude the keyboard input, screen output, and file system I/O. The method ofcontrolling semihosting depends on what connection you are using:• RVISS using <strong>RealView</strong> Connection Broker interface• JTAG connection using <strong>RealView</strong> ICE or Multi-ICE on page 6-15.RVISS using <strong>RealView</strong> Connection Broker interfaceIf you connect to RVISS using the <strong>RealView</strong> Connection Broker interface, the Semihosttab in the Register pane, shown in Figure 6-8 on page 6-14, enables you to control thebehavior of semihosting.<strong>ARM</strong> DUI 0153G Copyright © 2002-2005 <strong>ARM</strong> Limited. All rights reserved. 6-13
Working with Debug ViewsFigure 6-8 Viewing Semihost tab (RVISS)Figure 6-8 shows:Semihosting_StateIndicates the semihosting state:1 Semihosting on0 Semihosting off<strong>ARM</strong>_SWI The SWI used for semihosting in <strong>ARM</strong> state.Thumb_SWIThe SWI used for semihosting in Thumb state.NoteIt is strongly recommended that you do not change the semihosting <strong>ARM</strong>and Thumb SWI numbers. If you do, you must:• change all the code in your system, including library code, to usethe new SWI number• change the <strong>ARM</strong>_SWI and Thumb_SWI settings to use the new SWInumbers.ErrnoThe errno value of the last SWI operation manipulating files, returned bythe SYS_ERRNO SWI.Heap_Base The lowest address of the system heap, returned by the SYS_HEAPINFOSWI.Heap_Limit The highest address available for the system heap, returned by theSYS_HEAPINFO SWI.6-14 Copyright © 2002-2005 <strong>ARM</strong> Limited. All rights reserved. <strong>ARM</strong> DUI 0153G
Working with Debug ViewsStack_Base The lowest address of the system stack, returned by the SYS_HEAPINFOSWI.Stack_Limit The highest address available for the system stack, returned by theSYS_HEAPINFO SWI.Vector_CatchA bit mask of the current vector catch, showing the SWI processorexceptions that are currently enabled. It is suggested that you do notmodify this in the Register pane. Instead, enable or disable the processorexceptions using the following option on the main menu:Debug → Processor Exceptions...Addr_Cmd_LineThe address of the command line in <strong>ARM</strong> space that is to receive thecommand line to the image (SWI_GetEnv).Addr_<strong>User</strong>_StackThe address of the user stack (SWI_GetEnv).Number_Of_Files_OpenThe number of files that the semihosting operations currently have open.JTAG connection using <strong>RealView</strong> ICE or Multi-ICEWhen you are connected via <strong>RealView</strong> ICE or Multi-ICE, if standard semihosting isenabled, then the target processor enters debug state when a semihosting operation isperformed. To enable semihosting you must set the variable semihost_enabled, shownin Figure 6-7 on page 6-13 and Figure 6-9 on page 6-16:• Standard semihosting is enabled by default, and is the only mode available on<strong>RealView</strong> ICE. The behavior of semihosting depends on your target core, andyour target vehicle (see Standard semihosting behavior on page 6-16)• DCC semihosting is available on Multi-ICE (see DCC semihosting on page 6-17).<strong>ARM</strong> DUI 0153G Copyright © 2002-2005 <strong>ARM</strong> Limited. All rights reserved. 6-15
Working with Debug ViewsFigure 6-9 Specifying semihosting (Multi-ICE)Standard semihosting behaviorIf there is ROM or FLASH at the SWI Vector, then the use of semihosting requires ahardware breakpoint on certain cores, such as <strong>ARM</strong>7TDMI. In this case, there might beinsufficient hardware breakpoint resources left to permit single instruction stepping orsource level stepping, so it might be necessary to disable semihosting.The behavior also depends on the target vehicle you are using to connect to the core. Forexample, if you connect to an <strong>ARM</strong>7TDMI on an Integrator/AP board using <strong>RealView</strong>ICE, the following warning messages are displayed:• for software breakpoint modes AUTO, WATCHPOINT, and BKPT:Warning: A software breakpoint is being used to simulate reset vectorcatch. This may fail to be hit if the memory is remapped when a resetoccurs.• for software breakpoint mode NONE:Warning: Insufficient hardware resources to enable requested vector catchevents. Some vector catch events have been disabled.See the <strong>RealView</strong> ICE <strong>User</strong> <strong>Guide</strong> for details on setting the software breakpoint mode.Also see Breakpoints and memory map locations on page 4-9 for more details onbreakpoints and memory mapping.6-16 Copyright © 2002-2005 <strong>ARM</strong> Limited. All rights reserved. <strong>ARM</strong> DUI 0153G
Working with Debug ViewsDCC semihostingIf you are using Multi-ICE to connect to a target, DCC semihosting is supported inaddition to standard semihosting. DCC semihosting is not supported if you are using<strong>RealView</strong> ICE.The EmbeddedICE ® logic in <strong>ARM</strong> cores such as the <strong>ARM</strong>7TDMI, contains a debugcommunications channel (DCC), that enables data to be passed between the debuggerand the target using the <strong>RealView</strong> ICE or Multi-ICE interface, without stopping theprogram or entering debug state.DCC is a word-size communications mechanism implemented in the debug part of the<strong>ARM</strong> core as a number of registers in CP14. DCC takes the form of a 32-bit registerthrough which data might be communicated between code running on the host and coderunning on the target.Note<strong>RealView</strong> <strong>Debugger</strong> does not currently support the use of channel viewers.When using DCC semihosting, a handler is automatically loaded to the target.Communication between the handler and the host is performed over the DCC. DCCsemihosting has two advantages over breakpoint-based semihosting:• it is generally faster• interrupts continue to be serviced because the target processor does not enterdebug state.Standard semihosting is the default choice because DCC semihosting is more intrusiveon the target.Specify DCC semihosting by setting the variable semihost_enabled to DCC (seeFigure 6-9 on page 6-16). To do this, right-click on the semihost_enabled variable, andselect DCC from the context menu. This means that the DCC semihosting softwareinterrupt handler is installed in memory at the address specified by thesemihost_dcchndlr_addr variable. It is essential that a region of memory starting at thisaddress is available in target memory and is unused. The default address stored in thisvariable is 0x70000. You might have to change this to a lower value to suit the targetmemory.For full details on DCC semihosting with Multi-ICE, see Multi-ICE <strong>User</strong> <strong>Guide</strong>.<strong>ARM</strong> DUI 0153G Copyright © 2002-2005 <strong>ARM</strong> Limited. All rights reserved. 6-17
Working with Debug Views6.1.7 Defining new registers<strong>RealView</strong> <strong>Debugger</strong> has built-in awareness of core registers and other standard registersfor different processor families. These are displayed in the Register pane. However, youcan define new ASIC registers using the Advanced_<strong>Information</strong> blocks in your targetconfiguration settings. When configured, user-defined registers can be displayed in theRegister pane in the same way as standard registers. See the chapter that describesconfiguring custom targets in <strong>RealView</strong> <strong>Debugger</strong> v1.8 Target Configuration <strong>Guide</strong> fordetails.6.1.8 Interactive operationsFor full details on using interactive operations on register contents using the Debugmenu, see Chapter 7 Reading and Writing Memory, Registers, and Flash.6-18 Copyright © 2002-2005 <strong>ARM</strong> Limited. All rights reserved. <strong>ARM</strong> DUI 0153G
Working with Debug Views6.2 Working with memoryThe Memory pane displays the contents of memory and enables you to change thosecontents. On first opening, the pane is empty, because no starting address has beenspecified. If a starting address is entered, values are updated to correspond to the currentprogram status each time your program stops.This section describes the options available when working with memory displays andcontains the following sections:• Displaying memory contents• Formatting options on page 6-21• Operating on memory contents on page 6-25• Data width on memory accesses on page 6-27• Changing memory contents on page 6-28• Managing multiple targets on page 6-29• Interactive operations on page 6-29.6.2.1 Displaying memory contentsTo examine the contents of memory:1. Select Target → Reload Image to Target to reload the image dhrystone.axf.You can also reload an image using the Reload Image button on the Imagetoolbar.2. Click on the Src tab to view the source file dhry_1.c.3. Set a default breakpoint by double-clicking on line 301.4. Click Run to start execution.5. Enter 5000 when asked for the number of runs.The program starts and then stops when execution reaches the breakpoint at line301. The red box marks the location of the PC when execution stops.6. If no Memory pane is visible, select View → Memory to display the Memorypane, shown in Figure 6-10 on page 6-20.You can set start addresses using in-place editing or using the context menu.<strong>ARM</strong> DUI 0153G Copyright © 2002-2005 <strong>ARM</strong> Limited. All rights reserved. 6-19
Working with Debug ViewsFigure 6-10 Memory pane7. Right-click in the address column in the Memory pane to display the Addresscontext menu.8. Select Set Start Address... to display the dialog box shown in Figure 6-11.Figure 6-11 Memory start address selection boxYou specify the start address by giving an address in hexadecimal or by giving aC/C++ expression that <strong>RealView</strong> <strong>Debugger</strong> computes to obtain the startingaddress. You can use any valid expression using constants and symbols.You can also use the drop-down arrow to select an expression from a browser orto re-use a value entered previously. The drop-down also gives access to your listof personal favorites (see Using the Favorites Chooser/Editor dialog box onpage 8-29) where you can store a memory address for re-use in this, or future,debugging sessions.In this example, memory addresses of interest are in the region of 000088A0 so setthe start address to examine memory from this location.Numbers entered here must start with a zero. This means that <strong>RealView</strong> <strong>Debugger</strong>can distinguish these entries from valid variable names.9. Enter the required location, for example 0x00088A4, and then click Set to updatethe Memory pane.The memory display is arranged in columns. The left-most column shows thememory address. The memory contents are shown in the other columns. Thenumber of columns displayed varies depending on the size of the pane. Colorcoding is used to distinguish the type of memory being displayed, see Displaycolors on page 6-24 for details.10. Monitor changes in the memory display as you step through your program.6-20 Copyright © 2002-2005 <strong>ARM</strong> Limited. All rights reserved. <strong>ARM</strong> DUI 0153G
Working with Debug Views11. Double-click on the red marker disc to clear the breakpoint at line 301.6.2.2 Formatting optionsYou can change the way memory contents are displayed, and set the start address, usingthe Pane menu:CopyIf you have selected memory contents, use this option to copy the valuesto the clipboard ready to paste.Update WindowIf you have unselected the option Automatic Update, you can use thisoption to update the memory display manually. You can update thedisplay using this option at any time when execution is stopped. Thisenables you to catch any memory updates made externally.Set Start Address...Select this option to enter a C/C++ expression to compute the startaddress. This displays the selection box shown in Figure 6-11 onpage 6-20 with the current expression already displayed. Change theaddress and click Set to specify the start address for the memory view.Previous Start AddressUses a previous start address for displaying the contents of memory.The history list holds up to 16 previous start addresses added when:• you enter a new start address or expression• the current expression is recomputed to generate a new startaddress• the start address is set from the Address context menu.Re-evaluate Start AddressWhere you have used a C/C++ expression to compute the start address,select this option to recompute the expression and, where necessary, startat the new location. Where you have used a fixed value to specify the startaddress, select this option to update only the pane contents.Set Number of Columns to show...When the Memory pane first opens, the number of columns you can seedepends on the size of the pane and is chosen so as to show an evennumber of bytes. Use this option to change the number of columns visiblein the display. Use the selection box to show up to 32 columns in a single<strong>ARM</strong> DUI 0153G Copyright © 2002-2005 <strong>ARM</strong> Limited. All rights reserved. 6-21
Working with Debug Viewswindow. This number does not include the column used when the ASCIIdisplay option is selected, see the description of Show ASCII in Datasizes on page 6-23.The default setting is 0 to configure the number of columns to fit thewindow size.Automatic UpdateUpdates the memory display automatically, that is when:• you change memory from anywhere in <strong>RealView</strong> <strong>Debugger</strong>• program execution stops.This is the default.Re-evaluate Start Address on UpdateWhere you have used a C/C++ expression to compute the start address,select this option to recompute the expression when the pane contents areupdated (see the description of Automatic Update), and start at the newcomputed location where necessary.Timed Update when RunningIf you are using RealMonitor or an RTOS extension, the memory displaycan be updated at a specified time interval during program execution.Select this option to set this timer according to the update period specifiedby the Timed Update Period option.This option is enabled when:• RealMonitor is activated (see the chapter that describes configuringcustom targets in <strong>RealView</strong> <strong>Debugger</strong> v1.8 Target Configuration<strong>Guide</strong> for details)• you are in RSD mode and where supported by the underlying debugtarget (see the chapter that describes RTOS support in <strong>RealView</strong><strong>Debugger</strong> v1.8 Extensions <strong>User</strong> <strong>Guide</strong> for details).Timed Update PeriodUse this to choose the interval, in seconds, between window updates.Any value you enter here is only used when the option Timed Updatewhen Running is enabled.SizeDisplays a submenu where you can select various data sizes (see Datasizes on page 6-23).6-22 Copyright © 2002-2005 <strong>ARM</strong> Limited. All rights reserved. <strong>ARM</strong> DUI 0153G
Working with Debug ViewsFormatDisplays a submenu where you can select various data formats (see Dataformats).Data sizesThe Pane menu contains a Size submenu to define how data values are displayed in theMemory pane. The display size used for viewing memory contents varies depending onthe data types supported by your target processor:Signed DecimalDisplays the memory contents as negative or positive values where themaximum absolute value is half the maximum unsigned decimal value.Unsigned DecimalDisplays the memory contents from 0 up to the highest value that can bestored in the number of bits available.HexadecimalThis displays memory contents as hexadecimal numbers.Hexadecimal with leading ZerosDisplays memory values in hexadecimal format including leading zeros.This is the default display format for data values in this pane.Show ASCII Adds another column to the Memory pane, on the right hand side, to showthe ASCII value of the memory contents.ASCII format displays column values as characters. The ASCII format isuseful if, for example, you are examining the copying of strings andcharacter arrays by transfer in and out of registers.Any non-printable value is represented by a period (.).Data formatsThe Pane menu contains a Format submenu to define how data values are displayed inthe Memory pane. The display format used for viewing memory contents variesdepending on the data types supported by your target processor:Minimum Access SizeDisplays memory contents in the format specified as the minimummemory access size for the target. This is the default.Bytes (8 bits) Each column displays 8 bits of data.<strong>ARM</strong> DUI 0153G Copyright © 2002-2005 <strong>ARM</strong> Limited. All rights reserved. 6-23
Working with Debug ViewsHalf Words (16 bits)Each column displays 16 bits of data. Where your debug target is an<strong>ARM</strong> processor halfwords are aligned on 2-byte boundaries.Words (32 bits)Each column displays 32 bits of data. Where your debug target is an<strong>ARM</strong> processor long words are aligned on 4-byte boundaries.Double Words (64 bits)Each column displays 64 bits of data.Fixed (word size)Enables you to use fixed point format for displaying numeric values, thatis based on the natural size for the debug target processor. The defaultformat is unsigned and one less than the number of bits in the value.Fixed...Displays a selection box that enables you to specify a fixed point formatto display numeric values. The value entered here becomes the defaultdisplay format for the pane.Floats (32 bits)Displays values in floating point IEEE format, occupying four bytes, forexample:2.5579302e-041Doubles (64 bits)Displays values in floating point IEEE format, occupying eight bytes, forexample:4.71983561663e+164Display colorsWhen using the Memory pane to view memory contents, <strong>RealView</strong> <strong>Debugger</strong> uses colorto make the display easier to read and to highlight significant events:• Black specifies RAM or memory that can be modified.• Blue shows those contents that have changed since the last update. Light blueindicates a previous update.• Yellow indicates the contents of ROM.• Green indicates Flash memory known to <strong>RealView</strong> <strong>Debugger</strong>. Otherwise thevalues are displayed in yellow, indicating ROM.6-24 Copyright © 2002-2005 <strong>ARM</strong> Limited. All rights reserved. <strong>ARM</strong> DUI 0153G
Working with Debug ViewsNoteIf the Flash memory locations are shown with a yellow background in theMemory pane, then the Flash_type setting for the Flash memory area in the BCDfile is either pointing to an invalid FME file, or is not set.• Red **** indicates one of:— no memory is defined at this location— memory at this location is defined as Auto meaning it is determined whenloading your application program— memory is defined as prompt meaning that you are prompted to confirm theusage when loading the application.• Red !!!! indicates that there has been a failure in performing the memoryoperation. Double-click, with the right mouse button, at this location to get anexplanation of the problem.6.2.3 Operating on memory contentsYou can perform different operations on the memory displayed in the Memory paneusing the context menus. The menu shown, and the options available, depend on thetype of memory under the cursor when you right-click and on the valid licenses that youhave. The color-coded display helps you to identify the memory type. For a descriptionof the context menus, see:• Address context menu on page 6-26• Memory value context menu on page 6-26.NoteIf you right-click on a memory cell to access a context menu, any change you specify ismade to the cell under the cursor. This is independent of any highlighted cells in theview.If you double-click on an address in the address column of the Memory pane, an editfield is displayed. You can enter a specific address, or a symbol that specifies an address,in this field. For example, to display memory at the address pointed to by the SP register,enter @SP.<strong>ARM</strong> DUI 0153G Copyright © 2002-2005 <strong>ARM</strong> Limited. All rights reserved. 6-25
Working with Debug ViewsAddress context menuRight-click on a memory address to display the Address context menu that providesoptions to set the start address:UpdateUpdates the display in the Memory pane.Set Start Address...Enables you to specify the starting address for the display of memorycontents.Previous Start AddressEnables you to use the previous starting address for the display ofmemory contents.Re-evaluate Start AddressWhere you have used a C expression to compute the start address, selectthis option to recompute the expression and, where necessary, start thedisplay at the new location.Memory value context menuRight-click on a memory cell (or byte) shown as black or green, that is where the typeis ROM, Flash, or modifiable, to display the Memory value context menu. This contextmenu contains the following options:UpdateUpdates the display in the Memory pane.Set Start Address from ContentEnables you to use the cell contents as the starting address for the displayof memory contents. This option is enabled when the cell contains ascalar the size of an address or pointer.Show Symbol from Content<strong>RealView</strong> <strong>Debugger</strong> looks up the address held in the cell and displays anysymbol at that address.Show Symbol at AddressDisplays any symbol at the address contained in the cell, and not thecontents.Set to 0Enables you to set the current memory cell to zero.6-26 Copyright © 2002-2005 <strong>ARM</strong> Limited. All rights reserved. <strong>ARM</strong> DUI 0153G
Working with Debug ViewsIncrementDecrementEnables you to add 1 to the contents of the memory cell.Enables you to subtract 1 from the contents of the memory cell.Set Value... Displays a prompt where you can enter a new value for the memory cell.This new value is then entered and the memory display is updated.A memory cell can also be changed using in-place editing.Set Memory Interactive...Enables you to use memory interactive operations available in <strong>RealView</strong><strong>Debugger</strong>.Fill Memory with Pattern...Enables you to fill memory starting at this location.Set Break At...Displays the Set Address/Data Break/Tracepoint dialog box where youcan specify a breakpoint on the current memory cell. The type ofbreakpoint offered depends on the type of memory at the chosen location.For example, if the memory is defined as ROM, <strong>RealView</strong> <strong>Debugger</strong>offers a hardware breakpoint first.Set Tracepoint...Enables you to set tracepoints based on the current memory view.Right-click on a memory cell, or byte, that is yellow, that is where the type is ROM, tosee the ROM-specific context menu that offers a subset of these options.Memory errors6.2.4 Data width on memory accessesWhere a memory cell contains !!!! (colored red), this shows that there has been an errorin the memory operation. Right-click to display a menu with a single option:Show Error Code...Select this to display the error code returned from the debug target whenthe memory operation failed.By default, <strong>RealView</strong> <strong>Debugger</strong> makes word-size accesses when reading or writingmemory. You can change this in your memory map or by specifying the Memory_blocksettings in the Advanced_<strong>Information</strong> block in your target configuration file. For detailssee the chapter that describes configuring custom targets in <strong>RealView</strong> <strong>Debugger</strong> v1.8Target Configuration <strong>Guide</strong>.<strong>ARM</strong> DUI 0153G Copyright © 2002-2005 <strong>ARM</strong> Limited. All rights reserved. 6-27
Working with Debug Views6.2.5 Changing memory contentsTo change memory contents:1. Select Target → Reload Image to Target to reload the image dhrystone.axf.2. Click on the Src tab to view the source file dhry_1.c.3. Set a default breakpoint by double-clicking on line 301.4. Click Run to start execution.5. Enter 5000 when asked for the number of runs.The program starts and then stops when execution reaches the breakpoint at line301. The red box marks the location of the PC when execution stops.6. Use the Pane menu, in the Memory pane, to set the start address to 0x89A2 anddisplay the ASCII values, shown in Figure 6-12.Figure 6-12 Example memory displayThe memory locations 000089EF-000089F2 contain the four hexadecimal values0x33, 0x27, 0x52, and 0x44 corresponding to the string 3’RD.Right-click in the value at 000089ef, that is 0x33, to display the Memory valuecontext menu (see Operating on memory contents on page 6-25).This enables you to change the contents at the specified location. Select the optionSet Value... from the context menu to display the selection box, shown inFigure 6-11 on page 6-20, where you can enter the new value.Enter the required hexadecimal value 0x4E, or enter ‘N’, and click Set to updatethe memory display. You can use uppercase or lowercase to enter the new value.The new value is displayed in blue and the ASCII value changes from 3 to N.You can also use the drop-down arrow to select from a browser or to re-use a valueentered previously. The drop-down also gives access to your list of personalfavorites where you can store a data value for re-use in this, or future, debuggingsessions.6-28 Copyright © 2002-2005 <strong>ARM</strong> Limited. All rights reserved. <strong>ARM</strong> DUI 0153G
Working with Debug Views7. Change the value at location 000089F0 from 0x27 to 0x6F (lowercase o).8. Data values can be entered in a format that is different from the display format.Right-click in the location 000089F1 (0x52), for example, enter the decimal value32 and then click Set. The memory pane is updated with the new value, a space,displayed in the chosen display format.9. You can also use in-place editing to change memory contents. Double-click in thevalue 0x44 (D) at location 000089F2 and change it to 0x32. Press Enter to confirmthe new value.If you press Escape then any changes you made in the highlighted field areignored.10. View the changed values in the memory display. Each new value is displayed inblue as the pane contents are updated.11. View the changes you have made in the messages displayed when your programcompletes. The string “3’RD” has been replaced by “No 2”.12. Double-click on the red marker disc to clear the breakpoint at line 301.6.2.6 Managing multiple targetsIf you are licensed to use multiprocessor debugging mode you can examine differentmemory views on multiple debug targets at the same time. To do this, set up multipleCode windows, attach each window to a different debug target and then display thememory contents for each target. <strong>RealView</strong> <strong>Debugger</strong> enables you to set up severalMemory panes with different formatting options for each.For details on setting up multiple Code windows and attaching to different debugtargets, see the multiprocessing chapter in <strong>RealView</strong> <strong>Debugger</strong> v1.8 Extensions <strong>User</strong><strong>Guide</strong>.6.2.7 Interactive operationsYou can also perform operations on memory contents including saving memory to a file,and reloading, and filling memory. See Chapter 7 Reading and Writing Memory,Registers, and Flash for details.<strong>ARM</strong> DUI 0153G Copyright © 2002-2005 <strong>ARM</strong> Limited. All rights reserved. 6-29
Working with Debug Views6.3 Working with the stackThe stack, or run-time stack, is an area of memory used to store function returninformation and local variables.Executing a function sets up the stack. As the new function is called, a record is createdon the stack including traceback details, and local variables. At this point thesearguments and local variables become available to <strong>RealView</strong> <strong>Debugger</strong>, and you canaccess them through the Code window.When the function returns, the area of the stack occupied by that function is recoveredautomatically and can then be used for the next function call.In a typical memory-managed <strong>ARM</strong> processor, the memory model comprises:• a large area of application memory starting at the lowest address (code and staticdata)• an area of memory used to satisfy program requests, the heap, that grows upwardsfrom the top of the application space• a dynamic area of memory for the stack which grows downwards from the top ofmemory.The Stack Pointer (SP) points to the bottom of the stack.NoteModifying a value in the stack might cause the application program to performincorrectly or even to abort operation completely.<strong>RealView</strong> <strong>Debugger</strong> can provide the calling sequence of any functions that are still inthe execution path because their calling addresses are still on the stack. However, whenthe function is off the stack, it is lost to <strong>RealView</strong> <strong>Debugger</strong>. Similarly, if the stackcontains a function for which there is no debug information, <strong>RealView</strong> <strong>Debugger</strong> mightnot be able to trace back past it.This section describes ways of working with the stack:• Using the Stack pane on page 6-31• Formatting options on page 6-32• Operating on stack contents on page 6-33• Context controls on page 6-34• Setting a breakpoint on page 6-34• Interactive operations on page 6-35.6-30 Copyright © 2002-2005 <strong>ARM</strong> Limited. All rights reserved. <strong>ARM</strong> DUI 0153G
Working with Debug Views6.3.1 Using the Stack paneThe Stack pane enables you to monitor the contents of the stack as raw memory, and tomake changes to those settings. This might be especially useful for assembly languageprogrammers. The Stack pane shows the contents of the stack at the SP register whichis always kept at the top-left of the display area. Use this pane to view changes as theyhappen in the stack.The Stack pane enables you to follow the flow of your application through thehierarchical structure by displaying the current state of the stack. This shows you thepath that leads from the main entry point to the currently executing function.To view the Stack pane:1. Select Target → Reload Image to Target to reload the image dhrystone.axf.2. Select View → Stack to view the Stack pane.3. Click on the Src tab to view the source file dhry_1.c.4. Set a default breakpoint by double-clicking on line 301.5. Click Run to start execution.6. Enter 5000 when asked for the number of runs.The program starts and then stops when execution reaches the breakpoint at line301. The red box marks the location of the PC when execution stops.7. View the updated Stack pane, shown in Figure 6-13.Figure 6-13 Viewing the stackThe stack pointer, marked by SP, is located at the bottom of the stack. The framepointer, marked by FP, shows the starting point for the storage of local variables.<strong>ARM</strong> DUI 0153G Copyright © 2002-2005 <strong>ARM</strong> Limited. All rights reserved. 6-31
Working with Debug Views8. Monitor changes in the Stack pane as you step through your program, for exampleby clicking Hi-level Step Into.9. Double-click on the red marker disc to clear the breakpoint at line 301.The stack is displayed in columns:AddressValueThe left column contains the memory addresses of the stack.In some target processors that use a Harvard architecture, for example aDSP, a D is appended to show that this is a data address. You must includethis letter when specifying such an address as the starting address.The right column displays the contents of the addresses in the stack.As with the Memory pane, the memory display in the Stack pane is color-coded for easyviewing and to enable you to monitor changes.6.3.2 Formatting optionsYou can change the way stack contents are displayed, and set the start address, using thePane menu. This menu provides options to manage the display of stack contents duringyour debugging session, change the display format, and extract data from the pane foruse in other panes or windows. Highlight an entry in the display and then choose fromthe list of available options:CopyCopies the chosen entry from the list to the clipboard.Previous Start AddressEnables you to use the previous starting address for the display ofmemory contents.Signed DecimalDisplays the memory contents as negative or positive values where themaximum absolute value is half the maximum unsigned decimal value.Unsigned DecimalDisplays the memory contents from 0 up to the highest value that can bestored in the number of bits available.HexadecimalDisplays memory contents as hexadecimal numbers.Hexadecimal with leading ZerosDisplays memory values in hexadecimal format including leading zeros.This is the default display format for data values in this pane.6-32 Copyright © 2002-2005 <strong>ARM</strong> Limited. All rights reserved. <strong>ARM</strong> DUI 0153G
Working with Debug ViewsShow ASCII Adds another column to the Stack pane, on the right hand side, to showthe ASCII value of the memory contents.ASCII format displays column values as characters. The ASCII format isuseful if, for example, you are examining the copying of strings andcharacter arrays by transfer in and out of registers.Any non-printable value is represented by a period (.).Data formats6.3.3 Operating on stack contentsThe Pane menu contains an extended panel to define how data values are displayed inthe Stack pane. The display format used for viewing memory contents varies dependingon the data types supported by your target processor:Bytes (8 bits) Each column displays 8 bits of data.Half Words (16 bits)Each column displays 16 bits of data. Where your debug target is an<strong>ARM</strong> processor halfwords are aligned on 2-byte boundaries.Words (32 bits)Each column displays 32 bits of data. Where your debug target is an<strong>ARM</strong> processor long words are aligned on 4-byte boundaries.Double Words (64 bits)Each column displays 64 bits of data.You can perform operations on the memory displayed in the Stack pane using thememory contents context menus, as described in Operating on memory contents onpage 6-25.Changing the stack pointerAs you step through your code, the default stack pointer is used, shown in Figure 6-13on page 6-31. You can specify an expression or a register to use as the stack pointer fromthe Stack pane:1. Right-click on a stack address or the Stack pane background to display the Stackcontext menu.NoteIf you right-click on a stack value, the Stack Value context menu is displayed.<strong>ARM</strong> DUI 0153G Copyright © 2002-2005 <strong>ARM</strong> Limited. All rights reserved. 6-33
Working with Debug Views2. Select Set Start Address... to display the address prompt box.3. Enter an expression or a register, for example @R9, as the new stack pointer.You can also use the drop-down arrow to select an expression from a browser orto re-use a value entered previously. The drop-down also gives access to your listof personal favorites (see Using the Favorites Chooser/Editor dialog box onpage 8-29) where you can store a memory address for re-use in this, or future,debugging sessions.4. Click Set to confirm your choice and close the address prompt box.The new stack pointer is marked by Expression Pointer (EP), located at the bottom of thestack.If you enter a blank expression, or remove the existing expression, in the address promptbox, <strong>RealView</strong> <strong>Debugger</strong> reverts to using the default stack pointer register. In thisexample, this was R13 shown in Figure 6-1 on page 6-3.6.3.4 Context controlsThere are two Context controls available from the Code window main menu:Stack upMoves up one stack level from the current scope location giving accessto all local variables at that location. A stack level is determined by eachcalling function.6.3.5 Setting a breakpointStack down Moves down one stack level from the current scope location givingaccess to all local variables at that location. A stack level is determinedby each calling function.You must use the Stack up control first, because the context is as fardown the stack as possible.To set a breakpoint in the Stack pane:1. Right-click on the required stack value to display the Stack Value context menu.2. Select Set Break At... from the Stack Value context menu.3. Complete the entries in the Set Address/Data Breakpoint dialog box.4. Click OK to close the dialog box and set the breakpoint.6-34 Copyright © 2002-2005 <strong>ARM</strong> Limited. All rights reserved. <strong>ARM</strong> DUI 0153G
Working with Debug Views<strong>RealView</strong> <strong>Debugger</strong> sets a breakpoint on a symbol address where it exists on the stack.As soon as you exit the function, the address is no longer meaningful. Do not, therefore,use such a breakpoint where execution runs past the function return call.Unlike the Watch pane, the Stack pane acts like a snapshot of a chosen address. It doesnot track each invocation of a function and so is not able to track the chosen symbol.6.3.6 Interactive operationsYou can also perform other operations on memory contents using the Stack pane. SeeChapter 7 Reading and Writing Memory, Registers, and Flash for details.<strong>ARM</strong> DUI 0153G Copyright © 2002-2005 <strong>ARM</strong> Limited. All rights reserved. 6-35
Working with Debug Views6.4 Using the call stackProcessors maintain a call stack for each processor in your debug target. If you aredebugging multithreaded applications, a thread stack is also maintained.As a program function is called, it is added to the call stack. Similarly, as a functioncompletes execution and returns control normally, it is removed from the call stack. Thecall stack, therefore, contains details of all functions that have been called but have notyet completed execution.<strong>RealView</strong> <strong>Debugger</strong> includes features that enable you to monitor variables and accesstraceback as your debugging session develops:• Using the Stack pane• Using the Call Stack pane.6.4.1 Using the Stack paneThe Stack pane enables you to monitor activity on the stack during program executionby giving access to the stack as raw memory. See Working with the stack on page 6-30for full details.6.4.2 Using the Call Stack paneUse the Call Stack pane to follow the flow of your application through the hierarchicalstructure by examining the current status of functions and variables. This enables youto see the path that leads from the main entry point to the currently executing functionat the top of the stack. You can also use the Call Stack pane to set breakpoints.The Call Stack pane shows the:• name of the function• line number in the source file from which the function was called• parameters to the function.To use traceback:1. Select Target → Reload Image to Target to reload the image dhrystone.axf.2. Click on the Src tab to view the source file dhry_1.c.3. Set an unconditional software breakpoint by double-clicking on line 301.4. Click Run to start execution.5. Enter 5000 when asked for the number of runs.6-36 Copyright © 2002-2005 <strong>ARM</strong> Limited. All rights reserved. <strong>ARM</strong> DUI 0153G
Working with Debug ViewsThe program starts and then stops when execution reaches the breakpoint at line301. The red box marks the location of the PC when execution stops.6. Select View → Call Stack to view the Call Stack pane, shown in Figure 6-14.Figure 6-14 Multistatement details in the Call Stack pane7. Continue to step through your program. If the current line is a multistatement line,the Call Stack pane shows the information in the form of line and column details,shown in Figure 6-14.8. Monitor changes in the Call Stack pane as you step through your program.9. Double-click on the red marker disc to clear the breakpoint at line 301.Tabs in the Call Stack paneThe Call Stack pane contains the tabs:Call StackLocalsStaticsThisDisplays details of the functions currently on the stack, shown inFigure 6-14.Displays a list of the variables that are local to the current function.Displays a list of static variables local to the current module.In C++ the this pointer locates the object for which the member functionwas called. It is C++ specific.Using the Pane menuClick on the Pane menu button to display the Pane menu that contains options to:• manage variables• change the display format• change how contents are updated• extract data from the Call Stack pane for use in other panes or windows.<strong>ARM</strong> DUI 0153G Copyright © 2002-2005 <strong>ARM</strong> Limited. All rights reserved. 6-37
Working with Debug ViewsClick on the Call Stack tab, highlight an entry in the functions list and display the Panemenu options:CopyCopy the chosen entry, where enabled.Timed Update when RunningNot available in this release.Timed Update Period...Not available in this release.Update WindowUpdates the contents of the Call Stack pane. Use this when AutomaticUpdate is disabled.Automatic UpdateRefreshes the Call Stack pane as soon as a watchpoint is triggered andexecution stops. This is enabled by default.Show char* and char[] as stringsDisplays local variables of type char* and char[] (or casted) as strings.This is enabled by default.Show integers in hexDisplays all integers in hexadecimal format. Disabling this optiondisplays all integers in decimal. This is enabled by default.Properties... Displays a text description of the item under the cursor.6.4.3 Using context menusThe Call Stack pane contains several context menus depending on which entry isselected and the type of variable under the cursor.Using the Function menuRight-click on a function in the Call Stack tab to display the Function context menu:Scope ToBreak at...BreakIf...Scopes to the chosen function.Sets a breakpoint at the address defined by the chosen function, if this ispermitted.Displays the Breakpoint type selection box.6-38 Copyright © 2002-2005 <strong>ARM</strong> Limited. All rights reserved. <strong>ARM</strong> DUI 0153G
Working with Debug ViewsGo toThis continues execution until the specified point in the stack is reached.Properties... Displays a text description of the item under the cursor.Using the Variable menuRight-click on a chosen entry Name or Value in the Locals tab to display the Variablemenu. This context menu provides options that operate on selected variables only:UpdateFormat...Updates the displayed value for the chosen expression. This is applied incombination with any update options you set from the Pane menu.Displays a selection box where you can highlight the required format forthe expression from the list of available formats.If a variable contains multibyte characters, you can choose to view itusing ASCII, UTF-8, or Locale encoding.6.4.4 Stack controlsWhen working with the Call Stack pane there are two Context controls available fromthe Debug toolbar:• Stack up• Stack down.See Context controls on page 6-34 for full details.<strong>ARM</strong> DUI 0153G Copyright © 2002-2005 <strong>ARM</strong> Limited. All rights reserved. 6-39
Working with Debug Views6.5 Working with watchesUse watches to monitor variables or to evaluate expressions during your debuggingsession:• Setting watches in source-level view• Working with the Watch pane• Managing watches on page 6-42• Saving watches as favorites on page 6-46.6.5.1 Setting watches in source-level viewTo set a watch:1. Select Target → Reload Image to Target to reload the image dhrystone.axf.2. Click on the Src tab to view the source file dhry_1.c.3. Right-click on a variable name, for example Run_Index at line 146, and selectWatch from the Source Variable Name menu.4. Set a second watch, for example on the variable Enum_Loc at line 155.If you are working in source-level view and the Watch pane is visible, you can setwatches in other ways:• use the option Enter New Expression... from the Pane menu in the Watch pane• drag-and-drop the variable to watch• select a variable to watch, copy it, and paste it into the Watch pane.6.5.2 Working with the Watch paneThe Watch pane enables you to view expressions and their current values. You can usethe Watch pane to create breakpoints, or to change existing watched values.Displaying the paneSelect View → Watch to view the Watch pane, shown in Figure 6-15 on page 6-42.The Watch pane contains a series of tabs. The Watch1 tab is selected by default. Youcan set expressions on different tabs to make it easier to manage what is being watchedduring your debugging session. Click on the required tab to select it.Expressions are listed in the order they were created. You can drag the column headingsto display the full name or value if required. Where an entry contains subentries, forexample an array, a plus sign is appended to the name. Click on this to expand thedisplay.6-40 Copyright © 2002-2005 <strong>ARM</strong> Limited. All rights reserved. <strong>ARM</strong> DUI 0153G
Working with Debug ViewsUsing the Pane menuHighlight an entry in the watched variables list and click the Pane menu button todisplay the Pane menu. This contains:CopySelect this option to copy the chosen value from the list to the clipboard.From here it can be copied into another tab in the Watch pane, or intoanother pane or window.Timed Update when RunningIf you are using RealMonitor or an RTOS extension, this enables a timedupdate of the Watch pane when the target processor is running. Select thisoption to refresh the expressions list automatically where it containsmemory based expressions. Other expression types are not updated.This option is enabled when:• RealMonitor is activated (see the chapter that describes configuringcustom targets in <strong>RealView</strong> <strong>Debugger</strong> v1.8 Target Configuration<strong>Guide</strong> for details)• you are in RSD mode and where supported by the underlying debugtarget (see the chapter that describes RTOS support in <strong>RealView</strong><strong>Debugger</strong> v1.8 Extensions <strong>User</strong> <strong>Guide</strong> for details).Timed Update Period...Use this to choose the interval, in seconds, between window updates.Any value you enter here is only used when the option Timed Updatewhen Running is enabled.Update WindowUpdates the contents of the Watch pane. Use this when Timed Updatewhen Running and Automatic Update have been disabled. Select thisto update the current tab.Enter New Expression...Displays a prompt box where you can enter the expression to be watched.This displays the name and current value in the current tab. Click therequired tab before selecting this option.Automatic UpdateRefreshes the Watch pane as soon as execution stops. This is enabled bydefault.<strong>ARM</strong> DUI 0153G Copyright © 2002-2005 <strong>ARM</strong> Limited. All rights reserved. 6-41
Working with Debug ViewsRecompute Expression with same ContextIf you watch an expression, the result is evaluated based on the currentcontext. Select this option to recompute expressions using the contextwhen set.Show char* and char[] as stringsDisplays values as strings where appropriate. This is enabled by default.Show integers in hexDisplays all integers in hexadecimal format. Disabling this optiondisplays all integers in decimal. This is enabled by default.Properties... Displays a text description of the item under the cursor.Viewing watchesAs you set watches, expressions are added to the Watch pane, shown in Figure 6-15.Figure 6-15 Watch pane with watchesThe entries correspond to the watches you set, in the order that you set them. Eachexpression is shown giving the Name and Value. You can expand the column headings bydragging on the boundary marker to make the details easier to read.To delete an expression, highlight it and press Delete. There is no undo for this operationbut saving the watches in your personal Favorites List enables you to reinstate anydeleted entry.6.5.3 Managing watchesWith a watch set, you might want to change the expression, change the display formatused, or edit it directly to control how it is monitored. The Watch pane enables you tocarry out these operations and gives access to context menus where editing options areavailable.6-42 Copyright © 2002-2005 <strong>ARM</strong> Limited. All rights reserved. <strong>ARM</strong> DUI 0153G
Working with Debug ViewsFigure 6-16 shows an example Watch pane, with several expressions already set.Figure 6-16 Watches in the Watch paneOne watched value is an array, shown by the plus sign appended to the variable name.Click on the plus sign to expand the view and display the array elements.NoteIf the chosen array is very large, <strong>RealView</strong> <strong>Debugger</strong> warns you before expanding theview. Click either Yes to expand the array, or No to cancel the operation.You can access context menus, inside the Watch pane, to control watch options and editwatches directly, see:• Using the Name menu• Using the Value menu on page 6-44• Using the pane context menu on page 6-45• Editing watches on page 6-46.Using the Name menuIf you have set up expressions, right-click on a chosen entry Name to display the Namemenu. This context menu provides options that operate on selected entries only:UpdateFormat...Updates the displayed value for the chosen expression. This is applied incombination with any update options you set from the Pane menu.Displays a selection box to specify the format for the watched expression.Highlight the required format from the list of available formats. You canalso cast top level expressions, including casting to array, for examplechar* and char[12].Click OK to confirm your choice. This closes the selection box and thenew format is applied to the chosen expression.<strong>ARM</strong> DUI 0153G Copyright © 2002-2005 <strong>ARM</strong> Limited. All rights reserved. 6-43
Working with Debug ViewsIf a variable contains multibyte characters, you can choose to view itusing ASCII, UTF-8, or Locale encoding.Break at...BreakIf...If enabled, select this option to set a breakpoint at this location.If enabled, select this option to set a conditional breakpoint.Add from Favorites...Displays the Favorites Chooser/Editor dialog box where data valuessaved in your personal favorites can be added to the Watch pane (seeUsing the Favorites Chooser/Editor dialog box on page 8-29 and Savingwatches as favorites on page 6-46 for details).View Memory at ValueSelect this option to use the chosen value as the starting address for amemory display.View Memory at AddressSelect this option to use the address of the chosen item as the startingaddress for a memory display.Properties... Displays a text description of the item under the cursor.NoteThe first time you perform the View Memory at Value or View Memory at Addressoperations in a debugging session, a new instance of the Memory pane is displayed asa floating pane. Subsequent view memory operations use this instance of the Memorypane to display the memory contents, even if you have docked that pane.If you change the docked instance of the Memory pane to a different pane view (suchas Process Control), and you later perform the View Memory At Value operation, thedocked Memory pane is redisplayed to the right of the changed pane view (ProcessControl in this example).This Memory pane is also used if you perform the view memory operations from theRegister pane or the File Editor pane.Using the Value menuWith a watch set, you can right-click on a chosen entry Value to display the Value menu.This context menu provides options that operate on selected watches only:UpdateUpdates the displayed value for the chosen expression. This is applied incombination with any update options you set from the Pane menu.6-44 Copyright © 2002-2005 <strong>ARM</strong> Limited. All rights reserved. <strong>ARM</strong> DUI 0153G
Working with Debug ViewsFormat...Set to 0IncrementDecrementDisplays a selection box where you can highlight the required format forthe expression from the list of available formats.If a variable contains multibyte characters, you can choose to view itusing ASCII, UTF-8, or Locale encoding.Sets the value of the chosen expression to zero, where allowed. An errormessage is displayed if you try to set a value to zero when not permitted.Adds 1 to the value of the chosen expression. An error message isdisplayed if you try to increment a value when not permitted.Subtracts 1 from the value of the chosen expression. An error message isdisplayed if you try to decrement a value when not permitted.Set from Favorites...Displays the Favorites Chooser/Editor dialog box where data valuessaved in your personal Favorites List can be inserted into the specifiedlocation (see Using the Favorites Chooser/Editor dialog box onpage 8-29 and Saving watches as favorites on page 6-46 for details).Recent expressionsThe rest of this menu contains a list of recently-used variables and datavalues. You can re-use entries from this list as required.Using the pane context menuIf you right-click anywhere inside an empty entry in the Watch pane, a short contextmenu is displayed. This provides the options:Update AllUpdates the details for all the expressions currently displayed in theWatch pane.Add from Favorites...Displays the Favorites Chooser/Editor dialog box where expressionssaved in your personal Favorites List can be added to the Watch pane (seeUsing the Favorites Chooser/Editor dialog box on page 8-29 and Savingwatches as favorites on page 6-46 for details).<strong>ARM</strong> DUI 0153G Copyright © 2002-2005 <strong>ARM</strong> Limited. All rights reserved. 6-45
Working with Debug ViewsEditing watchesYou can use in-place editing to change expressions in the Watch pane, and to add newones:1. Double-click in the name you want to change, or press Enter if the item is alreadyselected. The name is enclosed in a box with the characters highlighted to showthey are selected (pending deletion).2. Enter the new name, or move the cursor to change the existing expression, or adda cast.3. Press Enter to store the new name.If you press Escape then any changes you made in the highlighted field are ignored.6.5.4 Saving watches as favoritesYou can create watches and then add them directly to your personal Favorites List oryou can add watches that you have been using in the current debugging session. Thissection explains the steps to follow to do both.Creating a watch favoriteTo create a Watch favorite, right-click inside a blank entry of the Watch pane to displaythe Name menu, and then select Add from Favorites.... This displays the FavoritesChooser/Editor dialog box. If this is the first time you have used watches in <strong>RealView</strong><strong>Debugger</strong>, the display list is empty.To create a new watch and add it to your Favorites List:1. Click New to display the New/Edit Favorite dialog box shown in Figure 6-17.2. Enter the expression to be watched, for example Ptr_Comp.Figure 6-17 New/Edit Favorite dialog box3. Enter a short text description to help you to identify the watch for future use, forexample my watch favorite.This is optional.6-46 Copyright © 2002-2005 <strong>ARM</strong> Limited. All rights reserved. <strong>ARM</strong> DUI 0153G
Working with Debug Views4. Click OK to confirm the entries and close the New/Edit Favorite dialog box.The Favorites Chooser/Editor dialog box is displayed with the newly-createdwatch shown in the display list (shown in Figure 6-18). See Using the FavoritesChooser/Editor dialog box on page 8-29 for details.Duplicate entries are not permitted in the Favorites List.Saving existing watches as favoritesWith several watches already set, <strong>RealView</strong> <strong>Debugger</strong> lets you choose which to add toyour Favorites List so that they are available for re-use in future debugging sessions orwith other target configurations of your application program.To add existing watches to your Favorites List:1. Highlight an expression in the Watch pane that you want to add to your FavoritesList.2. Right-click on the Name and select Add from Favorites... from the Name menu.This displays the Favorites Chooser/Editor, shown in Figure 6-18.Figure 6-18 Existing watches in the Favorites Chooser/EditorThe display list shows any watches already saved in your Favorites List. The datafield now shows the chosen expression.3. Click Add to List to add the specified expression to your Favorites List. Thisdisplays the New/Edit Favorite dialog box shown in Figure 6-19 on page 6-48.<strong>ARM</strong> DUI 0153G Copyright © 2002-2005 <strong>ARM</strong> Limited. All rights reserved. 6-47
Working with Debug ViewsFigure 6-19 Adding a new favoriteThe Expression field contains the chosen watch and you can enter a short textdescription to help you identify the watch favorite. This is optional.4. Click OK to confirm the watch details and close the dialog box.The Favorites Chooser/Editor dialog box is displayed showing the new watch in thedisplay list. Because this watch is already set, click Close to close the dialog box. Ifrequired, set another watch from your Favorites List before closing the dialog box.The edited Favorites List is saved to your exphist.sav file when you close <strong>RealView</strong><strong>Debugger</strong>.Saving data values as favoritesWith several watches already set, you can right-click on the Value for a specifiedexpression and display the Value menu. This context menu includes the option Set fromFavorites... to specify a data value to be set.Select this option to display the Favorites Chooser/Editor dialog box where you can:• save an existing data value as an entry in your Favorites List so that it can bere-used later in this debugging session• take a data value already saved and use it to set the starting value for the specifiedwatch.NoteIf you are using <strong>RealView</strong> <strong>Debugger</strong> on non-Windows platforms, the history file is onlycreated if you create and save a favorite, for example a breakpoint or watchpoint. SeeAppendix B <strong>RealView</strong> <strong>Debugger</strong> on Sun Solaris and Red Hat Linux for details.6-48 Copyright © 2002-2005 <strong>ARM</strong> Limited. All rights reserved. <strong>ARM</strong> DUI 0153G
Chapter 7Reading and Writing Memory, Registers, andFlash<strong>RealView</strong> ® <strong>Debugger</strong> includes options that enable you to work with registers andmemory interactively during your debugging session. This chapter describes theseoptions. It contains the following sections:• About interactive operations on page 7-2• Using the Memory/Register Operations menu on page 7-3• Accessing interactive operations in other ways on page 7-4• Working with Flash on page 7-5• Examples of interactive operations on page 7-10.<strong>ARM</strong> DUI 0153G Copyright © 2002-2005 <strong>ARM</strong> Limited. All rights reserved. 7-1
Reading and Writing Memory, Registers, and Flash7.1 About interactive operationsUse interactive operations to:• set memory and registers• patch assembly code (where supported by your debug target)• read a file to memory• write memory to a file• verify memory against a file• fill memory with a pattern of your choosing• control Flash memory.You can access all these features directly from the Debug menu. Selected operations arealso available when you are working in panes. These are described in:• Using the Memory/Register Operations menu on page 7-3• Accessing interactive operations in other ways on page 7-4• Working with Flash on page 7-5.The last section in this chapter contains examples using interactive operations see:• Examples of interactive operations on page 7-10.7-2 Copyright © 2002-2005 <strong>ARM</strong> Limited. All rights reserved. <strong>ARM</strong> DUI 0153G
Reading and Writing Memory, Registers, and Flash7.2 Using the Memory/Register Operations menuUse the Debug menu to carry out read and write operations on memory and registers:1. Connect to your target and load an image, for example dhrystone.axf.2. Select Debug from the Code window main menu to display the Debug menu.3. Select Memory/Register Operations to display the menu.This menu contains:Set Memory...Displays the Interactive Memory Setting dialog box where you can walkthrough memory and make changes where required.Patch Assembly...Enables you to patch assembly code during your debugging session. Youcan enter instructions in assembler format for patching directly intomemory. You can use labels, including making new ones, and symbols.This is only available where supported by the underlying debug target, forexample a DSP. This option is disabled by default.Set Register...Displays the Interactive Register Setting dialog box where you can walkthrough registers and make changes where required.Upload/Download Memory file...Displays the Upload/Download file from/to Memory dialog box whereyou can locate a specific file, of a given type, and read the contents intoan area of memory, or write a memory range into the file for re-use, orverify that a memory range matches the file contents.Fill Memory with Pattern...Displays the Fill Memory with Pattern dialog box where you can specifya pattern that is used to write to a given area of memory.Flash Memory Control...Displays the Flash Memory Control dialog box where you can erase andwrite Flash memory. The Flash memory must be opened before trying touse this dialog box.<strong>ARM</strong> DUI 0153G Copyright © 2002-2005 <strong>ARM</strong> Limited. All rights reserved. 7-3
Reading and Writing Memory, Registers, and Flash7.3 Accessing interactive operations in other waysThere are other ways to access interactive operations depending on where you areworking:• From the Memory pane• From the Stack pane.7.3.1 From the Memory paneIf you are working in the Memory pane, you can access memory operations:1. Select View → Memory to display the Memory pane.2. Right-click on a memory cell, or byte, that is black or green, that is where the typeis ROM, Flash, or modifiable, to display the Memory context menu.3. Select the required option, for example Set Memory Interactive... to display theInteractive Memory Setting dialog box (see Setting memory on page 7-10 forinstructions on how to use this dialog box).7.3.2 From the Stack paneIf you are working in the Stack pane, you can access memory operations:1. Select View → Stack to display the Stack pane.2. Right-click on a memory cell, or byte, to display the Memory context menu.3. Select the required option, for example Set Memory Interactive... to display theInteractive Memory Setting dialog box (see Setting memory on page 7-10 forinstructions on how to use this dialog box).7-4 Copyright © 2002-2005 <strong>ARM</strong> Limited. All rights reserved. <strong>ARM</strong> DUI 0153G
Reading and Writing Memory, Registers, and Flash7.4 Working with FlashTo use <strong>RealView</strong> <strong>Debugger</strong> to control Flash memory on your chosen debug target, youmust:• have access to an appropriate Flash MEthod (FME) file• have access to a Board/Chip Definition (BCD) file that specifies the memory mapof your debug target, and the FME file to use• assign the BCD file to your debug target.Depending on your current target, this might mean that you must first:• create the FME file for your Flash type• create and set up the BCD file.See the chapter that describes Flash programming with <strong>RealView</strong> <strong>Debugger</strong> in the<strong>RealView</strong> <strong>Debugger</strong> v1.8 Target Configuration <strong>Guide</strong> for detailed instructions oncreating an FME file, and creating, setting up and assigning a BCD file to your debugtarget.When you have configured your debug target to use the required BCD and FME files,you can program your Flash image into the Flash device. This section describes how toprogram a Flash image into the Flash device on your debug target. It includes:• Flash Method files• Flash examples on page 7-6• Flash programming on page 7-6• Using the Flash Memory Control on page 7-8.7.4.1 Flash Method filesFME files include code to:• enable you to write to the Flash on your debug target• perform read, write, and erase operations• describe the way the Flash is configured on the bus.Example files are included for all supported Flash devices as part of the root installation.If you have a custom board or custom Flash type that is not one of those supported by<strong>RealView</strong> <strong>Debugger</strong>, you must create your own FME file. See the chapter that describesFlash programming with <strong>RealView</strong> <strong>Debugger</strong> in the <strong>RealView</strong> <strong>Debugger</strong> v1.8 TargetConfiguration <strong>Guide</strong> for detailed instructions on how to create an FME file.<strong>ARM</strong> DUI 0153G Copyright © 2002-2005 <strong>ARM</strong> Limited. All rights reserved. 7-5
Reading and Writing Memory, Registers, and Flash7.4.2 Flash examplesThe root installation contains a directory of examples for supported Flash devices.These examples contain the prebuilt FME files that are required to program thesupported Flash devices.All the Flash examples are located in:install_directory\RVD\Core\...\flash\examplesFiles are collected in subdirectories based on the target board or Flash device.7.4.3 Flash programmingBefore you can use <strong>RealView</strong> <strong>Debugger</strong> to control a Flash device on your target, youmust:• describe the Flash memory chip in the memory map• ensure that you have a correctly configured FME file.The following example describes how to program the Flash memory on an <strong>ARM</strong> ®Integrator /AP board that is connected using <strong>RealView</strong> ICE. It assumes that your debugtarget is correctly configured to use the BCD file and FME file for the Integrator/APboard. The Integrator/AP FME file is installed as part of the root installation, in theFlash examples directory ...\IntegratorAP (see Flash examples).NoteIf you program the Flash on an <strong>ARM</strong> Integrator board using this release of <strong>RealView</strong><strong>Debugger</strong>, you bypass the <strong>ARM</strong> Firmware Suite (AFS) Flash library system informationblocks. These blocks are used by the AFS Flash Library, and are stored at the end ofeach image written to Flash. If you rely on these blocks to keep track of what is in theFlash memory of your target, keep a record of the state and recreate it after workingthrough the example.Programming an image into FlashTo program an image, you ask <strong>RealView</strong> <strong>Debugger</strong> to write to the Flash memory regionthat you have defined in the board file. The Integrator/AP Flash starts at memoryaddress 0x24000000.The following procedure uses the Load File to Target dialog box to load a Flash imagein preparation for writing to Flash. However, you can also program the image into Flashusing the Upload/Download file to/from Memory dialog box. For instructions on howto do this, see Loading Flash memory with the Upload/Download file from/to Memorydialog box on page 7-18.7-6 Copyright © 2002-2005 <strong>ARM</strong> Limited. All rights reserved. <strong>ARM</strong> DUI 0153G
Reading and Writing Memory, Registers, and FlashTo write an image to the Integrator/AP Flash:1. Build an image compiled to run with code at 0x24000000 and that has data inRAM.This example uses the dhrystone program stored in:install_directory\RVDS\Examples\...\dhrystoneTo rebuild the dhrystone image with modified linker options:a. Open the dhrystone project.b. Select Project → Project Properties to open the Project Propertieswindow.c. Click on the entry *BUILD in the left hand pane and double-click on theLink_Advanced entry.d. Right-click on the Ro_base entry in the right-hand pane and select EditValue from the context menu. Enter the value 0x24000000.e. Right-click on the Rw_base entry in the right-hand pane and select EditValue from the context menu. Enter the value 0x8000.f. Select Save and Close in the Project Properties window.Wait until <strong>RealView</strong> <strong>Debugger</strong> has finished generating the makefiles.g. Select Build → Rebuild All to build the project.2. Connect to the target device (Integrator/AP in this example).3. Click on the blue hyperlink in the File Editor pane to load the dhrystone.axfimage.This displays the Flash Memory Control dialog box (see Figure 7-1 on page 7-8).<strong>RealView</strong> <strong>Debugger</strong> queues the image in preparation for writing to Flash.4. Click Write to program the image into Flash.NoteWait for the write to complete before continuing.See Using the Flash Memory Control on page 7-8 for more details on how to usethe Flash Memory Control dialog box.5. Click Close to close the Flash Memory Control dialog box.6. Click on the Cmd tab in the Output pane to see the Flash operations.7. Select View → Memory Map tab to display the Map tab where you can see theFlash memory area (green icon) on the Integrator/AP board. Expand the Flashmemory map entry to see the image and Flash details.<strong>ARM</strong> DUI 0153G Copyright © 2002-2005 <strong>ARM</strong> Limited. All rights reserved. 7-7
Reading and Writing Memory, Registers, and Flash7.4.4 Using the Flash Memory ControlThe Flash Memory Control dialog box shown in Figure 7-1 enables you to performvarious operations on a Flash device.Figure 7-1 Flash Memory Control dialog boxThe Flash Memory Control dialog box consists of a display list, a read-only data field,a Flash Log, and control buttons:Flash:Click this button to view details about the Flash. The data field next to theFlash button describes the connection, Flash start address, and type ofFlash being used.Open Flash Blocks:Lists the Flash blocks that are currently open for access. A check box isassociated with each block. When this check box is checked, any Flashoperations are performed on that block. When you first write an image toFlash, only those Flash blocks that are affected by the image are selected.AllOnAllOffSelects all entries in the Open Flash Blocks list as indicated by a check inthe accompanying check box. This enables you to carry out operations onall the open blocks.Unselects all entries in the Open Flash Blocks list as indicated by nocheck in the accompanying check box.7-8 Copyright © 2002-2005 <strong>ARM</strong> Limited. All rights reserved. <strong>ARM</strong> DUI 0153G
Reading and Writing Memory, Registers, and FlashWriteEraseCancelCancel AllDetailsWrites data to the specified blocks of Flash.Erases every specified block of Flash. This normally sets every byte to0x00 or 0xFF depending on the type of Flash being used.Abandons any changes made to the specified blocks of Flash.Abandons all changes to the Flash contents.Displays an information box describing the type of Flash being used.Erase Block before WriteSelect this check box to erase the Flash block before performing the writeoperation.Verify Block after WriteSelect this check box to verify the Flash block, against the data source,after performing the write operation.Use Current values for Unspecified data in blockSpecifies that the original contents are to be maintained unless modifiedby the current operation. If unselected, the erase values are used.Only use this option if you are updating part of the Flash block and youwant to retain the current values in the rest of the block. This check boxis unselected by default. If you select this option, <strong>RealView</strong> <strong>Debugger</strong>reads and then writes the entire block. This might take some time tocomplete.Flash Log:CloseHelpDisplays a log of operations carried out on the selected Flash blocks.Closes the Flash Memory Control dialog box.Displays online help for this dialog box.See Setting Flash memory on page 7-20 for an example of interactive Flash memoryoperations.<strong>ARM</strong> DUI 0153G Copyright © 2002-2005 <strong>ARM</strong> Limited. All rights reserved. 7-9
Reading and Writing Memory, Registers, and Flash7.5 Examples of interactive operationsThis section contains examples showing how to perform interactive operations onmemory and registers:• Setting memory• Setting registers on page 7-12• Downloading memory to a file on page 7-14• Comparing memory with file contents on page 7-16• Filling memory with a pattern on page 7-16• Loading Flash memory with the Upload/Download file from/to Memory dialogbox on page 7-18• Setting Flash memory on page 7-20.7.5.1 Setting memoryTo set memory contents:1. Connect to your target and load an image, for example dhrystone.axf.2. Select Edit → Advanced → Show Line Numbers to display line numbers.This is not necessary but might help you to follow the examples.3. Click on the Src tab to view the source file dhry_1.c.4. Set a default breakpoint by double-clicking on line 301.5. Click Go to start execution.6. Enter 5000 when asked for the number of runs.The program starts and then stops when execution reaches the breakpoint at line301. The red box marks the location of the PC when execution stops.7. Select View → Memory to display the Memory pane.Start addresses can be set using in-place editing or using the Memory contextmenu.8. Right-click in the first address in the window to display the Memory contextmenu.9. Select Set Start Address... and enter 0x000088A0 as the new start address.10. Highlight the first byte at this address. In this example, this is 0x08.11. Right-click and select Set Memory Interactive... from the context menu todisplay the Interactive Memory Setting dialog box, shown in Figure 7-2.7-10 Copyright © 2002-2005 <strong>ARM</strong> Limited. All rights reserved. <strong>ARM</strong> DUI 0153G
Reading and Writing Memory, Registers, and FlashFigure 7-2 Interactive Memory Setting dialog box12. Enter the required memory settings:Type: Select the display format. See Formatting options on page 6-21 fordetails of the memory formats.Addr: The address where the memory setting starts. Depending on themethod used to display this dialog box, this field is already populated,as in this example.The address must be entered in hexadecimal format, for example0x000088A0.Value: This read-only data field shows the current value, in hexadecimal anddecimal formats, at the specified memory location.Enter New Value:Enter the value to be set at the current location, for example 0x08 or 8(decimal).If the Memory pane is configured to update automatically, clicking Setimmediately updates the memory contents. This is the default settingin the Pane menu.If you press Enter with no value in the Value data field, <strong>RealView</strong><strong>Debugger</strong> moves automatically to the next, or previous, location.Next AddrMoves the target address to the next location by adding 1 to the addressdisplayed in the Addr data field. This depends on the size of the currenttype.<strong>ARM</strong> DUI 0153G Copyright © 2002-2005 <strong>ARM</strong> Limited. All rights reserved. 7-11
Reading and Writing Memory, Registers, and FlashPrev AddrMoves the target address to a new location by subtracting 1 from theaddress displayed in the Addr data field. This depends on the size ofthe current type.Clear NewAutomatically clears any value entered in the Enter New Value datafield ready to accept another value. By default, this feature is enabled.Auto Inc AddrIf selected, this radio button instructs <strong>RealView</strong> <strong>Debugger</strong> to incrementthe target address automatically ready to accept a new setting.Auto Dec AddrIf selected, this radio button instructs <strong>RealView</strong> <strong>Debugger</strong> todecrement the target address automatically ready to accept a newsetting.Log:Displays a log of the changes you have made. This log is shown whenyou next display the dialog box.13. See the log updated to show your change.14. Click Close to close the Interactive Memory Setting dialog box.15. Double-click on the red marker disc to clear the breakpoint at line 301.Changed values are displayed in the Memory pane in the usual way. That is, updatedvalues are displayed in dark blue or light blue, depending on when they last changed.7.5.2 Setting registersTo set register contents:1. Select Target → Reload Image to Target to reload the image dhrystone.axf.2. Click on the Src tab to view the source file dhry_1.c.3. Set a default breakpoint by double-clicking on line 301.4. Click Run to start execution.5. Enter 5000 when asked for the number of runs.The program starts and then stops when execution reaches the breakpoint at line301. The red box marks the location of the PC when execution stops.6. Select View → Registers to display the Register pane.7-12 Copyright © 2002-2005 <strong>ARM</strong> Limited. All rights reserved. <strong>ARM</strong> DUI 0153G
Reading and Writing Memory, Registers, and Flash7. Select Debug → Memory/Register Operations → Set Register... from theCode window main menu to display the Interactive Register Setting dialog box.This dialog contains almost the same controls as the Interactive Memory Settingdialog box described in Setting memory on page 7-10.8. Set up the required register settings:Register: Enter the register to change, for example @R4. Press Enter to confirmyour choice.If required, use the drop-down arrow to select a previously usedregister from the stored list.Value: This read-only data field shows the current value, in hexadecimal anddecimal formats, for the specified register.Enter New Value:Enter the value to be set, in hex or decimal, for example 0xCC4.All changed registers are displayed in blue.Next AddrMoves to higher register by adding 1 to the register number displayedin the Register field.Prev AddrMoves to a lower register by subtracting 1 from the register numberdisplayed in the Register field.Clear NewAutomatically clears any value entered in the Enter New Value datafield ready to accept another value. By default, this feature is enabled.Auto Inc RegIf selected, this radio button instructs <strong>RealView</strong> <strong>Debugger</strong> to incrementthe register number automatically ready to accept a new setting.Auto Dec AddrIf selected, this radio button instructs <strong>RealView</strong> <strong>Debugger</strong> todecrement the register number automatically ready to accept a newsetting.Log: Displays a log of the changes you have made. This log is shown whenyou next display the dialog box.9. See the log updated to show your change.10. Click Close to close the Interactive Register Setting dialog box.11. Double-click on the red marker disc to clear the breakpoint at line 301.<strong>ARM</strong> DUI 0153G Copyright © 2002-2005 <strong>ARM</strong> Limited. All rights reserved. 7-13
Reading and Writing Memory, Registers, and Flash7.5.3 Downloading memory to a fileTo download a memory range into a file:1. Select Target → Reload Image to Target to reload the image dhrystone.axf.2. Click on the Src tab to view the source file dhry_1.c.3. Set a default breakpoint by double-clicking on line 301.4. Click Go to start execution.5. Enter 5000 when asked for the number of runs.The program starts and then stops when execution reaches the breakpoint at line301. The red box marks the location of the PC when execution stops.6. Select Debug → Memory/Register Operations → Upload/DownloadMemory file... from the Code window main menu to display theUpload/Download file from/to Memory dialog box, shown in Figure 7-3.Figure 7-3 Upload/Download file from/to Memory dialog box7. Specify the operation and set up the controls, as follows:a. Select the Save Memory into File radio button. This instructs <strong>RealView</strong><strong>Debugger</strong> to access the specified memory block, read the contents, andwrite them to the given file.b. In the File text box, enter the full pathname of the file to use to read/writememory values.7-14 Copyright © 2002-2005 <strong>ARM</strong> Limited. All rights reserved. <strong>ARM</strong> DUI 0153G
Reading and Writing Memory, Registers, and Flashc. In the Type of File section of the dialog, select the data type to be used inthe specified file where:• OBJ specifies an object file in the standard executable target format,for example <strong>ARM</strong>-ELF for <strong>ARM</strong> architecture-based targets• raw specifies a data file as a stream of 32-bit values• rawhw specifies a data file as a stream of 16-bit values• rawb specifies a data file as a stream of 8-bit values• ascii specifies a space-separated file of hexadecimal values.d. Define the start location of the memory block.When writing memory, specify a range as an address range or as a startaddress and length, for example:• 0x88A0..0x8980• 0x88A0..+1000• main..+1000If required, use the drop-down arrow to select a previously used locationfrom the stored list.NoteIf you are reading from a file to memory, you must specify a start location.The range can be left blank, unless the data type is binary.If you are writing to a file from memory, you must specify a start locationand a range.8. Click Apply to create and write the specified file. If the specified file alreadyexists, you are prompted to overwrite it.9. Click Close to close the Upload/Download file to/from Memory dialog box.10. Double-click on the red marker disc to clear the breakpoint at line 301.NoteIf you are writing memory to a file and the specified file already exists, <strong>RealView</strong><strong>Debugger</strong> warns of this and asks for confirmation before overwriting the file contents.<strong>RealView</strong> <strong>Debugger</strong> warns you if the memory transfer is going to take a long time tocomplete. When reading or writing memory contents, you must be aware that:• There is no limit on the size of file that <strong>RealView</strong> <strong>Debugger</strong> can handle.• The time taken to complete the operation depends on the access speeds of yourdebug target interface.<strong>ARM</strong> DUI 0153G Copyright © 2002-2005 <strong>ARM</strong> Limited. All rights reserved. 7-15
Reading and Writing Memory, Registers, and Flash7.5.4 Comparing memory with file contentsTo verify a file:1. Ensure that you have downloaded a memory range into a file as described inDownloading memory to a file on page 7-14.2. Select Debug → Memory/Register Operations → Upload/DownloadMemory file... from the Code window main menu to display theUpload/Download file from/to Memory dialog box (see Figure 7-3 on page 7-14).3. Select Verify Memory and File.4. Specify the file to be compared.5. Specify the start address to be compared. This must be within the range specifiedin the memory file.6. Click Apply to compare the file contents with the specified memory block.7. Click on the Cmd tab in the Output pane and view the results, for example:verifyfile,ascii,gui "D:\<strong>ARM</strong>\RVD\Test_files\memory_file_3"Mismatch at Address 0x000088B6: 0x8E vs 0x8FThe first mismatch is identified and the location reported. Any mismatches afterthis location are not reported.8. Click Close to close the Upload/Download file from/to Memory dialog box.9. Double-click on the red marker disc to clear the breakpoint at line 301.7.5.5 Filling memory with a patternTo fill a specified area of memory with a predefined pattern:1. Select Target → Reload Image to Target to reload the image dhrystone.axf.2. Click on the Src tab to view the source file dhry_1.c.3. Set a default breakpoint by double-clicking on line 301.4. Click Run to start execution.5. Enter 5000 when asked for the number of runs.The program starts and then stops when execution reaches the breakpoint at line301. The red box marks the location of the PC when execution stops.6. Select View → Memory to display the Memory pane.7-16 Copyright © 2002-2005 <strong>ARM</strong> Limited. All rights reserved. <strong>ARM</strong> DUI 0153G
Reading and Writing Memory, Registers, and Flash7. Double-click in the address column of the Memory pane, and enter 0x88A0 to viewthe memory contents at that location.8. Select Debug → Memory/Register Operations → Fill Memory withPattern... from the Code window main menu to display the Fill Memory withPattern dialog box, shown in Figure 7-4.Figure 7-4 Fill Memory with Pattern dialog box9. Set up the required memory settings:Start: Enter the start address for the memory range to be filled, for example0x88A0.If required, use the drop-down arrow to select a previously used startaddress from the stored list.End/Len: By default, the memory area that is filled is defined by a start addressand a length. Enter the length of the memory block to be filled in thisdata field, for example 14 (decimal).The specified length must be given relative to the data type given in theSize data field.If the Use Length (Count) check box is unselected, you can specifythe address that marks the end of the memory block.Size: Enter the data type to be used in the file where:• natural indicates the format specified as native for the debugtarget• byte indicates support for 8-bit signed and unsigned byte form• half-word indicates support for 16-bit signed and unsignedhalfwords• long-word indicates support for 32-bit signed and unsignedwords.<strong>ARM</strong> DUI 0153G Copyright © 2002-2005 <strong>ARM</strong> Limited. All rights reserved. 7-17
Reading and Writing Memory, Registers, and FlashUse Length (Count)By default, the memory block to be filled is defined by a start addressand the length. If this check box is unselected you can specify anaddress to mark the end of the filled block.Pattern: Enter the pattern to be used as the fill, for example:“AB”0,1,0,1,0NoteStrings must be enclosed in quotes.10. Click OK to confirm your settings and close the Fill Memory with Pattern dialogbox. Memory contents are rewritten and the Memory pane is automaticallyupdated with changed values displayed in blue.11. Double-click on the red marker disc to clear the breakpoint at line 301.When filling memory blocks, you must be aware of the following:• All expressions in an expression string are padded or truncated to the sizespecified by the Size value if they do not fit the specified size evenly.• If the number of values in an expression string is less than the number of bytes inthe specified address range, <strong>RealView</strong> <strong>Debugger</strong> repeats the pattern and so mightfill an area in excess of the specified block, for example specify a pattern of 10bytes and a fill area of 16 bytes. <strong>RealView</strong> <strong>Debugger</strong> repeats the pattern twice andso fills a block of 20 bytes.• If more values are given than can be contained in the specified address range,excess values are ignored.• If a pattern is not specified, <strong>RealView</strong> <strong>Debugger</strong> displays an error message.7.5.6 Loading Flash memory with the Upload/Download file from/to Memory dialog boxThis example assumes that you have built the dhrystone.axf image as described inProgramming an image into Flash on page 7-6, step 1, and that you are using theIntegrator/AP board as the target.To load Flash memory:1. Connect to the Integrator/AP target.7-18 Copyright © 2002-2005 <strong>ARM</strong> Limited. All rights reserved. <strong>ARM</strong> DUI 0153G
Reading and Writing Memory, Registers, and Flash2. Select Debug → Memory/Register Operations → Upload/DownloadMemory file... from the Code window main menu to display theUpload/Download file from/to Memory dialog box, shown in Figure 7-3 onpage 7-14.Figure 7-5 Upload/Download file from/to Memory dialog box3. Specify the operation and set up the controls, as follows:a. Select the Load File into Memory radio button. This instructs <strong>RealView</strong><strong>Debugger</strong> to load the chosen file starting at the specified address.b. In the File text box, enter the full pathname of the dhrystone.axf you builtin step 1.c. In the Type of File section of the dialog, select OBJ. This specifies an objectfile in the standard executable target format, for example <strong>ARM</strong>-ELF for<strong>ARM</strong> architecture-based targets.d. Define the start location of the Flash memory.For the Integrator/AP board, enter 0x24000000.4. Click Apply.<strong>RealView</strong> <strong>Debugger</strong> queues the image in preparation for writing to Flash, anddisplays the Flash Memory Control dialog box (see Using the Flash MemoryControl on page 7-8).NoteAlthough <strong>RealView</strong> <strong>Debugger</strong> updates the Memory pane and the File Editor panewith the image information, the image is yet not written to the Flash.5. Click Write to write the image to Flash.<strong>ARM</strong> DUI 0153G Copyright © 2002-2005 <strong>ARM</strong> Limited. All rights reserved. 7-19
Reading and Writing Memory, Registers, and FlashNoteWait for the write to complete before continuing.6. Click Close to close the Flash Memory Control dialog box.7. Click Close to close the Upload/Download file to/from Memory dialog box.7.5.7 Setting Flash memoryFlash memory blocks open for access when you write to Flash, for example when youload an image. This displays the Flash Memory Control dialog box (see Using the FlashMemory Control on page 7-8 for details).To write to Flash memory interactively:1. Connect to your target, load an image, and write to Flash, as described in Workingwith Flash on page 7-5.2. Select View → Memory to display the Memory pane.Start addresses can be set using in-place editing or using the Memory contextmenu.3. Right-click in the first address in the window to display the Memory contextmenu.4. Select Set Start Address... and enter 0x24000000 as the new start address.This is colored green, indicating Flash.5. Right-click in the first byte at this address.6. Select Set Value... from the context menu.7. Enter the new value 0xA0 at the prompt.8. Click Set to confirm this value. This displays the Flash Memory Control dialogbox to enable you to access the open Flash, shown in Figure 7-1 on page 7-8.9. If you want to view details of the Flash memory, click Flash in the Flash MemoryControl dialog box. This displays details of the Flash memory, as shown inFigure 7-6 on page 7-21.7-20 Copyright © 2002-2005 <strong>ARM</strong> Limited. All rights reserved. <strong>ARM</strong> DUI 0153G
Reading and Writing Memory, Registers, and FlashFigure 7-6 Flash memory detailsYou can also click Details to display information about the open Flash block.Click Close to close the information box.10. In the Flash Memory Control dialog box, ensure that the Erase Block beforeWrite option is checked.11. Click Write to write to the chosen Flash location. Monitor the changes in theMemory pane as memory is updated. The Flash Log confirms the Flash operation.12. Click Close to close the Flash Memory Control dialog box.NoteYou can also select Debug → Memory/Register Operations → Flash MemoryControl..., from the Code window main menu, to display the Flash Memory Controldialog box during your debugging session.<strong>ARM</strong> DUI 0153G Copyright © 2002-2005 <strong>ARM</strong> Limited. All rights reserved. 7-21
Reading and Writing Memory, Registers, and Flash7-22 Copyright © 2002-2005 <strong>ARM</strong> Limited. All rights reserved. <strong>ARM</strong> DUI 0153G
Chapter 8Working with Browsers and Favorites<strong>RealView</strong> ® <strong>Debugger</strong> provides browser panes and list dialog boxes to help withdebugging tasks and monitor your program during execution. This chapter describeshow to access these panes and dialog boxes from the Code window, and how to usethem. It contains the following sections:• Using browsers on page 8-2• Using the Data Navigator pane on page 8-5• Using the Symbol Browser pane on page 8-17• Using the Function List dialog box on page 8-19• Using the Variable List dialog box on page 8-21• Using the Module/File List dialog box on page 8-23• Using the Register List Selection dialog box on page 8-25• Specifying browser lists on page 8-27• Using the Favorites Chooser/Editor dialog box on page 8-29.<strong>ARM</strong> DUI 0153G Copyright © 2002-2005 <strong>ARM</strong> Limited. All rights reserved. 8-1
Working with Browsers and Favorites8.1 Using browsersBrowsers enable you to search through your source files to look for specific structuresand to monitor their status during program execution.This section includes:• Scope of symbols in <strong>RealView</strong> <strong>Debugger</strong>• Browser panes• List browser dialog boxes.8.1.1 Scope of symbols in <strong>RealView</strong> <strong>Debugger</strong><strong>RealView</strong> <strong>Debugger</strong> uses scope to determine the value of a symbol. Any symbol valueavailable to a C or C++ program at the current PC is also available to <strong>RealView</strong><strong>Debugger</strong>.Variables can have values that are relevant within:• a specific class only, that is class scope• a specific function only, that is local scope• a specific file only, that is static global scope• the entire process, that is global scope.For full details on scope and scoping rules see the chapter that describes working withthe CLI in <strong>RealView</strong> <strong>Debugger</strong> v1.8 Command Line Reference <strong>Guide</strong>.8.1.2 Browser panesThe following browser panes are available:• Data Navigator, to quickly locate a module, function, or variable (see Using theData Navigator pane on page 8-5)• Symbol Browser, for viewing C++ classes (see Using the Symbol Browser paneon page 8-17).8.1.3 List browser dialog boxesYou can access list browser dialog boxes from various routes when working with<strong>RealView</strong> <strong>Debugger</strong>. These browsers enable you to select specific locations when youare performing operations such as:• setting breakpoints• setting watchpoints to monitor the contents of the specified location• viewing the memory from the specified location.8-2 Copyright © 2002-2005 <strong>ARM</strong> Limited. All rights reserved. <strong>ARM</strong> DUI 0153G
Working with Browsers and FavoritesTo view a list browser:1. Display the required pane, if the required pane is not in view:• View → Break/Tracepoints to display the Break/Tracepoints pane• View → Watch to display the Watch pane• View → Memory to display the Memory pane.2. Click on the Pane menu button in the pane toolbar.3. Select the required option:• On the Break/Tracepoints pane menu, select Set/Edit Breakpoint... todisplay the Set Address/Data Breakpoint dialog box. Also, see Accessingthe list browsers from the breakpoint dialog boxes on page 8-4.• On the Watch pane menu, select Enter New Expression... to display theexpression prompt box.• On the Memory pane menu, select Set Start Address... to display theexpression prompt box.4. Click on the drop-down arrow to the right of the field to display the options listmenu.5. Select the required browser from the menu:Displays the Function List dialog box, described in Using the FunctionList dialog box on page 8-19.Displays the Variable List dialog box, described in Using the VariableList dialog box on page 8-21.Displays the Module/File List dialog box, described in Using theModule/File List dialog box on page 8-23.Displays the Register List dialog box, described in Using the RegisterList Selection dialog box on page 8-25. This option is only availablefrom the various dialog boxes used to set breakpoints, see Accessingthe list browsers from the breakpoint dialog boxes on page 8-4.Because the browsers are used only to make a selection, there are no controls fordebugging operations such as Watch, Break, or Show Type Info.<strong>ARM</strong> DUI 0153G Copyright © 2002-2005 <strong>ARM</strong> Limited. All rights reserved. 8-3
Working with Browsers and FavoritesAccessing the list browsers from the breakpoint dialog boxesThe list browsers are also accessible from the following breakpoint dialog boxes:• Simple Break if X (see Using the Simple Break if X dialog box on page 4-21)• Simple Break if X, N times (see Using the Simple Break if X, N times dialog boxon page 4-35)• Simple Break if X, when Y is True (see Using the Simple Break if X, when Y isTrue dialog box on page 4-37)• HW Break if in Range (see Using the HW Break if in Range dialog box onpage 4-24)• HW While in function/range, Break if X (see Using the HW While infunction/range, Break if X dialog box on page 4-26)• HW Break if X, then if Y (see Using the HW Break if X, then if Y dialog box onpage 4-27)• HW Break on Data Value match (see Using the HW Break on Data Valuematch dialog box on page 4-29).8-4 Copyright © 2002-2005 <strong>ARM</strong> Limited. All rights reserved. <strong>ARM</strong> DUI 0153G
Working with Browsers and Favorites8.2 Using the Data Navigator paneThe Data Navigator pane enables you to:• quickly locate a module, function, or variable in one or more images that areloaded on the debug target• perform various operations, such as setting breakpoints on functions or variables.This section describes how to use the Data Navigator pane, and includes:• Displaying the Data Navigator pane• Data Navigator pane interface components on page 8-6• Applying a filter on page 8-6• Refining the list of functions and variables on page 8-8• Setting a default breakpoint on a function on page 8-8• Setting a non-default breakpoint on a function on page 8-9• Setting a hardware breakpoint on a variable on page 8-9• Working with the Images tab on page 8-9• Working with the Modules tab on page 8-10• Working with the Functions tab on page 8-11• Working with the Variables tab on page 8-14.8.2.1 Displaying the Data Navigator paneTo display the Data Navigator pane, shown in Figure 8-1, select View → DataNavigator from the Code window main menu.Figure 8-1 Data Navigator pane<strong>ARM</strong> DUI 0153G Copyright © 2002-2005 <strong>ARM</strong> Limited. All rights reserved. 8-5
Working with Browsers and Favorites8.2.2 Data Navigator pane interface componentsThe Data Navigator contains the following interface components:Filter fieldUse this to quickly locate a function. This field is updated as you choosean image, module, and function. Alternatively, if you know the moduleand function name in the image, you can enter this directly.See Applying a filter for more details on how to specify filters.8.2.3 Applying a filterGoto Variables check boxBy default, when you double-click on a module entry in the Modules tab,the Functions tab is selected. Check this box to have the Variables tabselected instead.Images tab Lists the images that are loaded on the current debug target. See Workingwith the Images tab on page 8-9 for details on using this tab.Modules tab Lists the modules in all images, or in the chosen image. See Working withthe Modules tab on page 8-10 for details on using this tab.Functions tabLists the functions in all images or modules, or in the chosen image ormodule. See Working with the Functions tab on page 8-11 for details onusing this tab.Variables tabLists the variables in all images or modules, or in the chosen image ormodule. See Working with the Variables tab on page 8-14 for details onusing this tab.Using a filter enables you to narrow down the search when displaying the list of images,modules, functions, or variables in the Data Navigator pane. When you specify a filter,the list of functions and variables is filtered accordingly. That is, only those functionsand variables that match the filter are displayed.Filter syntaxThe syntax for specifying a filter is:• For modules:@image_name\module_name\*The \* suffix is optional.8-6 Copyright © 2002-2005 <strong>ARM</strong> Limited. All rights reserved. <strong>ARM</strong> DUI 0153G
Working with Browsers and Favorites• For functions:@image_name\module_name\function_name• For variables:@image_name\module_name\variable_nameModule names qualify symbolic references. See Module naming conventions onpage 4-7 for details on using module names.Filter metacharactersTable 8-1 shows the metacharacters you can use to specify the filter rule or rules. Whenentering a filter, characters are case sensitive, for example the filter *DHRY* returns a listof three modules but *dhry* returns an empty list.When you have completed the filter, press Enter and the list is refreshed. By repeatedlyentering filters, and pressing Enter, you can refine the search to focus on selectedmodules, files, functions or variables.Table 8-1 Filter metacharactersMetacharacterDescription* This operator matches any character or number of characters, forexample *DHRY* matches MY_DHRYSTONE_H but not Dhrystone_H or MY_DHR.? This operator matches any single character, for example *DHRY_?.matches MY_DHRY_A but not MY_DHRY_AB or DHRY_B.[…]^List operators enable you to define a set of items to use as a filter. Thelist items must be enclosed by square brackets, for example *[HN]*matches DHRY_H and UNNAMED_1 but not STDLIB. An empty list ([]) returnsno results.This operator is used inside a list, to represent a NOT action, for example*_[^2]* matches DHRY_1 but not DHRY_2.- Range operators enable you to define a range of items to use as a match.The range must be enclosed within square brackets, for example*_[A-Z]* matches DHRY_H but not DHRY_1 whereas *_[^A-Z]* matchesUNNAMED_1 but not DHRY_H.- Used as the first character in a filter, this operator means do not match.For example, *SAM* -*HOST* means match all names containing the stringSAM except those that contain the string HOST.<strong>ARM</strong> DUI 0153G Copyright © 2002-2005 <strong>ARM</strong> Limited. All rights reserved. 8-7
Working with Browsers and Favorites8.2.4 Refining the list of functions and variablesYou can refine the list of functions and variables in the Data Navigator pane by using afilter (see Applying a filter on page 8-6). In addition, you can also use the followingoptions on the Functions context menu (see Functions context menu on page 8-12) andthe Variables context menu (see Variables context menu on page 8-15):Show PublicsList global or public functions or variables with scope over all parts of theprogram.Show StaticsList static functions or variables.Shows LabelsList code labels with scope over entire functions.Show LocalsDisplays local variables with scope within a function. This option isavailable only on the Variables context menu.Show Library SymbolsList library symbols depending on the state of the Show Publics, ShowStatics, Show Locals, and Show Labels options.8.2.5 Setting a default breakpoint on a functionIn the Data Navigator pane, you can set a default breakpoint on a chosen function. Todo this:1. Locate the function in the Functions tab.2. Right-click on the function entry.3. Select Break to set a breakpoint.This sets a default breakpoint on the function. <strong>RealView</strong> <strong>Debugger</strong> uses theBREAKINSTRUCTION command to set the breakpoint:• If the function is in RAM, a software breakpoint is set.• If the function is in Flash or ROM, a hardware breakpoint is set. A warningmessage might also be issued, depending on your debug target.For more details on default breakpoints, see Setting default breakpoints on page 4-15.8-8 Copyright © 2002-2005 <strong>ARM</strong> Limited. All rights reserved. <strong>ARM</strong> DUI 0153G
Working with Browsers and Favorites8.2.6 Setting a non-default breakpoint on a functionIf you want to use the Data Navigator pane set a non-default breakpoint on a function,that is you want to set a breakpoint that has qualifiers or actions, do the following:1. Right-click on the function, and select one of the following options from theFunctions context menu:• Show in Disassembly• Show Source• Scope To.2. Set the required breakpoint as described in the following sections:• Setting unconditional breakpoints explicitly on page 4-21• Setting hardware breakpoints explicitly on page 4-24• Setting conditional breakpoints on page 4-34• Using the Set Address/Data Breakpoint dialog box on page 4-41.8.2.7 Setting a hardware breakpoint on a variableIn the Data Navigator pane, you can set a hardware access, read, or write breakpoint ona chosen variable. To do this:1. Locate the variable in the Variables tab.2. Right-click on the variable entry to display the context menu.3. Select Break... from the context menu.This displays the Set Address/Data Breakpoint dialog box, with the Location fieldcontaining the reference to the selected variable. Only HW Access, HW Read, and HWWrite breakpoint types are valid for variables. For more details on using this dialogbox, see Using the Set Address/Data Breakpoint dialog box on page 4-41.8.2.8 Working with the Images tabThe Images tab in the Data Navigator pane lists the images that you have loaded ontothe current debug target.Images tab operationsYou can perform the following operations with the Images tab:• Sort the image names in ascending or descending order. To do this, click on theImages column header.<strong>ARM</strong> DUI 0153G Copyright © 2002-2005 <strong>ARM</strong> Limited. All rights reserved. 8-9
Working with Browsers and Favorites8.2.9 Working with the Modules tab• Narrow the search for a module, function, or variable to a specific image. To dothis, double-click on the image name. The Modules tab becomes the current tab(see Working with the Modules tab). Also:— the Functions tab lists those functions in the image that you have elected toshow in that tab— the Variables tab lists those variables in the image that you have elected toshow in that tab.The Modules tab in the Data Navigator pane lists the modules in all images by default,or in the image you selected from the Images tab (see Working with the Images tab onpage 8-9). You can also limit the list of modules by specifying a filter (see Applying afilter on page 8-6).Modules tab operationsYou can perform the following operations with the Modules tab:• Sort the modules in ascending or descending order of Module Name, Filename,or Image. To do this, click on the appropriate column header.• Narrow the search for a function or variable to a specific module. To do this,double-click on the required module entry:— By default, the Functions tab becomes the current tab (see Working with theFunctions tab on page 8-11). This tab lists those functions in the modulethat you have elected to show in that tab.— If you have checked the Goto Variables check box, the Variables tabbecomes the current tab (see Working with the Variables tab on page 8-14).This tab lists those variables in the module that you have elected to show inthat tab.• Locate the lowest address in memory that is occupied by the selected module, seeModules context menu on page 8-11 for details.8-10 Copyright © 2002-2005 <strong>ARM</strong> Limited. All rights reserved. <strong>ARM</strong> DUI 0153G
Working with Browsers and FavoritesModules context menuTo display the Modules context menu, right-click on a module entry. This menu has asingle option:Scope ToLocates the lowest address in memory that is occupied by the chosenmodule in the current view of the File Editor pane. The address is that ofthe function with the lowest address in the module:• If the Dsm tab is selected, the function is displayed in thedisassembly view.• If a source file tab is selected, for example dhry_1.c, and the chosenmodule matches that source file, the function is displayed.If the chosen module matches a source file that is not selected,<strong>RealView</strong> <strong>Debugger</strong> selects the source file. If the source file is notalready open, then <strong>RealView</strong> <strong>Debugger</strong> opens it.If the selected module is in an <strong>ARM</strong> library, then <strong>RealView</strong> <strong>Debugger</strong> isunable to display the source, and displays the following message in theSrc tab:No source for context: module\functionmodule\function refers to the function in the module that has the lowestaddress in memory, for example, DIVISION_S\__rt_sdiv, or if<strong>RealView</strong> <strong>Debugger</strong> is unable to determine the context.In all cases where a module context can be determined, <strong>RealView</strong><strong>Debugger</strong> also locates the module in the Dsm tab. Select the Dsm tab toview the start address for the module.If <strong>RealView</strong> <strong>Debugger</strong> is unable to determine the context, then address0x00000000 is chosen. For example, if you scope to a module that relatesto a .h file, such as DHRY_H.8.2.10 Working with the Functions tabThe Functions tab in the Data Navigator pane lists the functions in all modules bydefault, or in the module you selected from the Modules tab (see Working with theModules tab on page 8-10). You can also limit the list of functions displayed byspecifying a filter (see Applying a filter on page 8-6).Functions tab operationsYou can perform the following operations with the Functions tab:• Sort the functions in ascending or descending order of Function Name, Address,Scope, Module, or Image. To do this, click on the appropriate column header.<strong>ARM</strong> DUI 0153G Copyright © 2002-2005 <strong>ARM</strong> Limited. All rights reserved. 8-11
Working with Browsers and Favorites• Various operations are available from the Functions context menu. To displaythis context menu, right-click on a function entry. See Functions context menu fora description of these operations.Functions context menuThe Functions context menu contains the following options:Show PublicsWhen enabled (checked), lists all global or public functions with scopeover all parts of the image, or selected module.Show Statics When enabled (checked), lists all static functions in the image, orselected module.Show Labels When enabled (checked), lists all code labels with scope over the entireimage, or selected module.Show Library SymbolsWhen enabled (checked), lists the symbols in the libraries used by theimage. The library symbols listed depends on the state of the ShowPublics, Show Statics, and Show Labels options.When disabled (unchecked), most library symbols are filtered out. Thisis the default.Show in DisassemblyLocates the function in the disassembly view in the Dsm tab of the FileEditor pane. If the disassembly view is not visible, <strong>RealView</strong> <strong>Debugger</strong>switches the code view to the Dsm tab.You can also locate the function in the disassembly view bydouble-clicking on the function entry.Show SourceLocates the function in your source code of the File Editor pane. If thesource file is not open, <strong>RealView</strong> <strong>Debugger</strong> opens the file. If the sourcefile is open, but not visible, <strong>RealView</strong> <strong>Debugger</strong> switches the code viewto the source.BreakSets a default breakpoint on the function using the BREAKINSTRUCTIONcommand (see Setting a default breakpoint on a function on page 8-8).If you want to set a non-default breakpoint on a function, that is you wantto set a breakpoint that has qualifiers or actions, see Setting a non-defaultbreakpoint on a function on page 8-9.8-12 Copyright © 2002-2005 <strong>ARM</strong> Limited. All rights reserved. <strong>ARM</strong> DUI 0153G
Working with Browsers and FavoritesGo untilSets a temporary breakpoint at the specified function. The program thenexecutes from the current position of the PC. When execution reaches thebreakpoint it stops.The temporary breakpoint exists only for the duration of this run and sois not shown in the Break/Tracepoints pane. Similarly, there is no redbreakpoint marker shown in the source file. If the program stops before itreaches the temporary breakpoint, you must reinstate it before restartingthe run.This is equivalent to the CLI command:go functionFor example, go @dhrystone\\DHRY_1\Proc_2.Show Type InfoPrints the type information for the selected function in the Cmd tab of theOutput pane. This is equivalent to the CLI command:printtype functionFor example, printtype @dhrystone\\DHRY_1\Proc_2.Show Full InfoSubmits a CEXPRESSION command to calculate the value of a givenexpression by calling the specified target function.The function is converted into a debugger call macro, and strings andarrays passed to the target function are copied onto a stack maintained by<strong>RealView</strong> <strong>Debugger</strong>. A function called in this way behaves as though ithad been called from your program.NoteTarget calls are not supported by all debug environments.Results are displayed in either floating-point format, address format, orin decimal, hexadecimal, or ASCII format depending on the type ofvariables used in the expression.Set PC to FunctionSubmits a SETREG command to set the PC register to the start address ofthe selected function. For example:setr @PC=@dhrystone\\DHRY_1\Proc_1The Code window scrolls to the specified function and the red box showsthe location of the PC.<strong>ARM</strong> DUI 0153G Copyright © 2002-2005 <strong>ARM</strong> Limited. All rights reserved. 8-13
Working with Browsers and FavoritesScope ToLocates the start of the function in the current view of the File Editorpane:• If the Dsm tab is selected, the function is displayed in thedisassembly view.• If a source file tab is selected, for example dhry_1.c, and the chosenfunction is in that source file, that function is displayed.If the chosen function matches a source file that is not selected,<strong>RealView</strong> <strong>Debugger</strong> selects the source file. If the source file is notalready open, then <strong>RealView</strong> <strong>Debugger</strong> opens it.If the selected function is in an <strong>ARM</strong> library, then <strong>RealView</strong> <strong>Debugger</strong> isunable to display the source, and displays the following message in theSrc tab:No source for context: module\functionmodule\function is the function reference, for example, STDIO\fgetc.In all cases, <strong>RealView</strong> <strong>Debugger</strong> also locates the function in the Dsm tab.Select the Dsm tab to view the start address for the function.8.2.11 Working with the Variables tabThe Variables tab in the Data Navigator pane lists the variables in all functions bydefault, or in the module you selected from the Modules tab (see Working with theModules tab on page 8-10). You can also limit the list of variables displayed byspecifying a filter (see Applying a filter on page 8-6).Variables tab operationsYou can perform the following operations with the Variables tab:• Sort the variables in ascending or descending order of Variable Name, Address,Scope, Module, or Image. To do this, click on the appropriate column header.• Print the hexadecimal value of the variable to the Cmd tab of the Output pane. Todo this, double-click on the variable entry.• Various operations available from the Variables context menu. To display thiscontext menu, right-click on a variable entry. See Variables context menu onpage 8-15 for a description of these operations.8-14 Copyright © 2002-2005 <strong>ARM</strong> Limited. All rights reserved. <strong>ARM</strong> DUI 0153G
Working with Browsers and FavoritesVariables context menuThe Variables context menu contains the following options:Show PublicsWhen enabled (checked), lists all global or public variables with scopeover all parts of the image, or selected module.Show Statics When enabled (checked), lists all static variables in the image, or selectedmodule.Show Labels When enabled (checked), lists all code labels with scope over the entireimage, or selected module.Show Locals When enabled (checked), lists all local variables in the image, or selectedmodule.Show Library SymbolsWhen enabled (checked), lists the symbols in the libraries used by theimage. The library symbols listed depends on the state of the ShowPublics, Show Statics, Show Labels, and Show Locals options.When disabled (unchecked), most library symbols are filtered out. Thisis the default.Print HexPrints the hexadecimal value of the selected variable in the Cmd tab ofthe Output pane. This is equivalent to the CLI command:print /h variableFor example, print /h @dhrystone\\Ch_1_Glob.You can also display the hexadecimal value by double-clicking on thevariable entry.Print DecimalPrints the decimal value of the selected variable in the Cmd tab of theOutput pane. This is equivalent to the CLI command:print variableFor example, print @dhrystone\\Ch_1_Glob.WatchAdds a watch for the selected variable.Show Type InfoPrints the type information for the selected variable in the Cmd tab of theOutput pane. This is equivalent to the CLI command:printtype variable<strong>ARM</strong> DUI 0153G Copyright © 2002-2005 <strong>ARM</strong> Limited. All rights reserved. 8-15
Working with Browsers and FavoritesFor example, printtype @dhrystone\\Ch_1_Glob.Show Full InfoPrints the full information for the selected variable in the Cmd tab of theOutput pane. This is equivalent to the CLI command:printsym variableFor example, printsym @dhrystone\\Ch_1_Glob.Break...Displays the Set Address/Data Breakpoint dialog box, where you can seta hardware breakpoint (see Setting a hardware breakpoint on a variableon page 8-9).8-16 Copyright © 2002-2005 <strong>ARM</strong> Limited. All rights reserved. <strong>ARM</strong> DUI 0153G
Working with Browsers and Favorites8.3 Using the Symbol Browser paneUse the Symbol Browser pane to examine C++ classes in your application program.To examine C++ classes either:• Select the menu option View → Symbol Browser from the Code window mainmenu.• Move the focus to the chosen pane, for example the Watch pane, click the PaneControl menu, and select New Pane → Symbol Browser from the availableoptions.An example display is shown in Figure 8-2.This section describes:• Viewing details of a class on page 8-18• Viewing details of a function on page 8-18.Figure 8-2 C++ symbols in the Symbol Browser pane<strong>ARM</strong> DUI 0153G Copyright © 2002-2005 <strong>ARM</strong> Limited. All rights reserved. 8-17
Working with Browsers and Favorites8.3.1 Viewing details of a classColored icons are used to identify different components within a class:Filled stack + arrowThis magenta icon indicates a function which is a declared member of theparent class.Filled stack The magenta filled stack indicates that a member function of the parentclass is both declared and defined. These members are real in that theyare called during execution.Hollow stackWhere magenta stacks are hollow, they indicate that a member functionof the parent class is declared but not defined. These members are virtualin that they are not called during execution.Filled block The filled blue block indicates a data object that is manipulated by a classfunction using operators, or methods, defined in the class.Right-click on a chosen class to display the Class menu. This contains:Find Class Definition...Displays the Find in Files dialog box where you can specify the classdetails and so locate the definition in your source code.Use this dialog box to locate class definitions when these are not providedby the compiler.See the chapter that describes searching in <strong>RealView</strong> <strong>Debugger</strong> v1.8Project Management <strong>User</strong> <strong>Guide</strong> for details on using the Find in Filesdialog box.Properties... Displays a text description of the item under the cursor.8.3.2 Viewing details of a functionRight-click on a function to display the Function menu. This contains:Show Function DefinitionScopes to the selected function. This option is enabled for definedfunctions identified by a magenta filled stack icon.Set BreakSets a breakpoint at the selected function. This option is enabled fordefined functions identified by a magenta filled stack icon.Properties... Displays a text description of the item under the cursor.8-18 Copyright © 2002-2005 <strong>ARM</strong> Limited. All rights reserved. <strong>ARM</strong> DUI 0153G
Working with Browsers and Favorites8.4 Using the Function List dialog boxUse the Function browser to examine the different functions that make up yourprogram.This section describes:• Displaying the Function List dialog box• Specifying the list• Refining the list on page 8-20• Selecting a function on page 8-20• Closing the browser on page 8-20.8.4.1 Displaying the Function List dialog boxDisplay the Function List dialog box, shown in Figure 8-3, as described in List browserdialog boxes on page 8-2.Figure 8-3 Function List dialog boxThe Function List dialog box lists all the functions, ordered by module name, in thecurrent program. Each entry in the list shows the filename, if known, and then thefunction name, for example:DHRY_2\Func_3 of @dhrystone8.4.2 Specifying the listWhen you first open the Function List dialog box, the list entries are determined by thedefault search entry ISearch but you can decide which functions are displayed byapplying a search filter.See Specifying browser lists on page 8-27 for details of how to specify the list for thechosen browser.<strong>ARM</strong> DUI 0153G Copyright © 2002-2005 <strong>ARM</strong> Limited. All rights reserved. 8-19
Working with Browsers and Favorites8.4.3 Refining the listThe Function List dialog box contains check boxes that enable you to refine what isdisplayed in the list box:PublicsStaticsLabelsDisplays global or public functions with scope over all parts of theprogram.Displays static functions.Displays code labels with scope over the entire function.8.4.4 Selecting a functionWith a list of functions displayed in the Function List, select a function entry and clickthe Select button to select that function.8.4.5 Closing the browserWhen you click Select, the Function List dialog box closes automatically. Otherwise,click Cancel to exit the browser.8-20 Copyright © 2002-2005 <strong>ARM</strong> Limited. All rights reserved. <strong>ARM</strong> DUI 0153G
Working with Browsers and Favorites8.5 Using the Variable List dialog boxUse the Variables browser to examine the different variables used in your program.This section describes:• Displaying the Variable List dialog box• Specifying the list• Refining the list on page 8-22• Closing the browser on page 8-22.8.5.1 Displaying the Variable List dialog boxDisplay the Variable List dialog box, shown in Figure 8-4, as described in List browserdialog boxes on page 8-2.Figure 8-4 The Variable ListThe Variable List dialog box shows all the variables in the current program. By default,the Sort check box is unselected and so the variables are given in order of occurrence.Each entry in the list shows the variable name followed by the program name attachedusing @, for example:Ch_1_Glob of @dhrystoneIncluding local variables adds the filename, if known, to the list, for example:DHRY_2\Proc_8\Int_Index local of @dhrystone8.5.2 Specifying the listWhen you first open the Variable List dialog box, the list entries are determined by thedefault search entry ISearch but you can decide which variables are displayed byapplying a search filter.<strong>ARM</strong> DUI 0153G Copyright © 2002-2005 <strong>ARM</strong> Limited. All rights reserved. 8-21
Working with Browsers and FavoritesSee Specifying browser lists on page 8-27 for details of how to specify the list for thechosen browser.8.5.3 Refining the listThe Variable List dialog box contains check boxes that enable you to refine what isdisplayed in the list box:PublicsStaticsLabelsLocalsDisplays global or public variables with scope over all parts of theprogram.Displays static variables.Displays code labels with scope over the entire function.Displays local variables with scope within the current function.8.5.4 Closing the browserWhen you click Select, the Variables List dialog box closes automatically. Otherwise,click Cancel to exit the browser.8-22 Copyright © 2002-2005 <strong>ARM</strong> Limited. All rights reserved. <strong>ARM</strong> DUI 0153G
Working with Browsers and Favorites8.6 Using the Module/File List dialog boxUsing the Module/File browser enables you to examine the different files and modulesthat make up your program and how these components are accessed during programexecution. In this way you can locate errors during your debugging session.This section describes:• Displaying the Module/File List dialog box• Specifying the list on page 8-24• Selecting a module on page 8-24• Closing the browser on page 8-24.8.6.1 Displaying the Module/File List dialog boxDisplay the Module/File List dialog box, shown in Figure 8-5, as described in Listbrowser dialog boxes on page 8-2.Figure 8-5 Module/File List dialog boxThe Module/File List dialog box displays, in order of appearance, all the modules andfiles in the current program. Each entry in the list shows the module name and then thefilename, if known, for example:@dhrystone\\DHRY_2 - dhry_2.cThe program name is attached at the start using @, for example @dhrystone\\.Module names qualify symbolic references. The module name is usually the filenamewithout the extension. All module names are converted to uppercase by <strong>RealView</strong><strong>Debugger</strong>. If the extension is not standard, the extension is preserved, and the dot isreplaced with an underscore, for example sample_arm.c is converted to SAMPLE_<strong>ARM</strong>, andsample_arm.h is converted to SAMPLE_<strong>ARM</strong>_H.<strong>ARM</strong> DUI 0153G Copyright © 2002-2005 <strong>ARM</strong> Limited. All rights reserved. 8-23
Working with Browsers and FavoritesIf two modules have the same name then <strong>RealView</strong> <strong>Debugger</strong> appends an underscorefollowed by a number to the second module, for example SAMPLE_1. Additional modulesare numbered sequentially, for example, if there is a third module this becomesSAMPLE_2.Following this convention avoids any confusion with the C dot operator indicating astructure reference.8.6.2 Specifying the listWhen you first open the Module/File List dialog box, the list entries are determined bythe default search entry ISearch but you can decide which modules and files aredisplayed by applying a search filter.See Specifying browser lists on page 8-27 for details of how to specify the list for thechosen browser.8.6.3 Selecting a moduleTo select a module:1. Display the Module/File List dialog box as described in List browser dialog boxeson page 8-2.2. Select a module from the list.3. Click Select to select that module.8.6.4 Closing the browserWhen you click Select the Module/File List dialog box closes automatically. Otherwise,click Cancel to exit the browser without adjusting the scope.8-24 Copyright © 2002-2005 <strong>ARM</strong> Limited. All rights reserved. <strong>ARM</strong> DUI 0153G
Working with Browsers and Favorites8.7 Using the Register List Selection dialog boxThe Register List Selection dialog box enables you to select a register from a list ofmemory mapped registers for the current target connection. The list of registers isgenerated from those defined in the Peripherals group of the Board/Chip Definition fileassigned to the connection. For more details, see the <strong>RealView</strong> <strong>Debugger</strong> v1.8 TargetConfiguration <strong>Guide</strong>.NoteYou must assign a Board/Chip Definition file (for example, AP.bcd) to the connection touse this dialog box.This section describes:• Displaying the Register List Selection dialog box• Selecting a register on page 8-26• Closing the browser on page 8-26.8.7.1 Displaying the Register List Selection dialog boxDisplay the Register List Selection dialog box, shown in Figure 8-6, as described in Listbrowser dialog boxes on page 8-2.Figure 8-6 Register List Selection dialog boxThe Register List Selection dialog box displays, in alphabetical order, the memorymapped registers. These registers are defined any Board/Chip Definitions you haveassigned to the current target connection. The registers shown in Figure 8-6 are thosefor the Integrator/AP board, which are defined in the AP.bcd. For more details, see the<strong>RealView</strong> <strong>Debugger</strong> v1.8 Target Configuration <strong>Guide</strong>.<strong>ARM</strong> DUI 0153G Copyright © 2002-2005 <strong>ARM</strong> Limited. All rights reserved. 8-25
Working with Browsers and Favorites8.7.2 Selecting a registerTo select a register:1. Display the Register List Selection dialog box as described in List browser dialogboxes on page 8-2.2. Select a register from the list.3. Click OK to select that register.8.7.3 Closing the browserWhen you click OK the Register List Selection dialog box closes automatically.Otherwise, click Cancel to exit the browser without adjusting the scope.8-26 Copyright © 2002-2005 <strong>ARM</strong> Limited. All rights reserved. <strong>ARM</strong> DUI 0153G
Working with Browsers and Favorites8.8 Specifying browser listsWhen you first open a browser, the list entries shown in the dialog box are determinedby the default search entry ISearch but you can decide what contents are displayed byapplying a search filter. To change the search mechanism either:• click on the drop-down arrow to display the search list and select a search• highlight the contents, for example ISearch, and press F or I to toggle thecontents.This section describes:• Specifying a list• Applying a filter on page 8-28.8.8.1 Specifying a listWhen you change the browser search mechanism to specify a new list, <strong>RealView</strong><strong>Debugger</strong> performs the match against list entry segments and not against the text stringas shown in the display list. This applies if you choose to sort the display list (see thedescription of Sort in this section) or to apply a filter to limit the search (see Applyinga filter on page 8-28 for details).To specify the search:List of entries displayedThe list of entries displayed can be specified using one of the following:ISearch With this selected, the list of entries is created using the defaultsearch mechanism based on the names of the modules, files,functions, or variables found in your program. Enter a partialname in the Text entry field to move the highlight to the firstmatching occurrence. The search is case insensitive.Filter Use a filter to limit the search to list only those symbols thatmatch certain criteria, see Applying a filter on page 8-28 fordetails.Text entry fieldEnter here the filter to be used in the search and then press Enter. Thefilter enables you to search using the metacharacters listed in Table 8-1on page 8-7. You can enter a list of search rules by combining differentoperators, see Applying a filter on page 8-28 for details of how to apply asearch filter.<strong>ARM</strong> DUI 0153G Copyright © 2002-2005 <strong>ARM</strong> Limited. All rights reserved. 8-27
Working with Browsers and FavoritesSortSelect this check box to order the display list in alphabetical order basedon the names of the modules, files, functions, or variables found in yourprogram. The sort is case insensitive, that is uppercase and lowercase aretreated as identical. Sort is unchecked by default.NoteIf you change the default search entry to Filter and then enter a filter to set the displaycriteria, these settings are maintained when you close, or cancel, the browser.8.8.2 Applying a filterUsing a filter enables you to narrow down the search when displaying the list ofmodules, files, functions, or variables. Table 8-1 on page 8-7 shows the metacharactersyou can use to specify the filter rule or rules. When entering a filter, characters are casesensitive, for example the filter *DHRY* returns a list of three modules but *dhry* returnsan empty list.When you have completed the filter, press Enter and the list is refreshed. By repeatedlyentering filters, and pressing Enter, you can refine the search to focus on selectedmodules, files, functions or variables.8-28 Copyright © 2002-2005 <strong>ARM</strong> Limited. All rights reserved. <strong>ARM</strong> DUI 0153G
Working with Browsers and Favorites8.9 Using the Favorites Chooser/Editor dialog boxThis section describes how to use the Favorites Chooser/Editor dialog box. It includes:• Overview of the Favorites Chooser/Editor dialog box• Displaying the Favorites Chooser/Editor dialog box on page 8-30• Favorites Chooser/Editor dialog box interface components on page 8-30• Favorites categories used by <strong>RealView</strong> <strong>Debugger</strong> features on page 8-32.8.9.1 Overview of the Favorites Chooser/Editor dialog boxThe Favorites Chooser/Editor dialog box enables you to save expressions that you useon a regular basis to a personal Favorites List. The following types of expression can beset as favorites:• addresses and address ranges• data values• breakpoints and tracepoints• qualifiers and actions for breakpoints• watch expressions• directories• filenames.When you first start to use <strong>RealView</strong> <strong>Debugger</strong> on Windows, your personal FavoritesList is empty. You can create expressions and add them directly to this list or you canadd expressions that you have been using in the current debugging session.If you create an expression manually, you must make sure that the expression matchesthe Favorites Category (see Favorites Chooser/Editor dialog box interface componentson page 8-30). For example, you must add an address range to the Addresses category,but not to the Break/Tracepoints category. If you do add a favorite to the wrong category,then <strong>RealView</strong> <strong>Debugger</strong> might not behave as expected, or an error message might bedisplayed.<strong>RealView</strong> <strong>Debugger</strong> keeps a record of all favorite expressions that you set during yourdebugging session as part of your history file exphist.sav, which is located in your<strong>RealView</strong> <strong>Debugger</strong> home directory. This file also contains a history of other entities,for example files and directories you have accessed during the debugging session. Bydefault, at the end of your debugging session, these processor-specific lists are saved inthe history file.NoteYou must connect to a target to enable <strong>RealView</strong> <strong>Debugger</strong> favorites.<strong>ARM</strong> DUI 0153G Copyright © 2002-2005 <strong>ARM</strong> Limited. All rights reserved. 8-29
Working with Browsers and Favorites8.9.2 Displaying the Favorites Chooser/Editor dialog boxThere are many ways you can display the Favorites Chooser/Editor dialog box in<strong>RealView</strong> <strong>Debugger</strong>:• From any dialog boxes that have a drop-down arrow to the right of the variousfields, for example, the various breakpoint and tracepoint dialog boxes.• By selecting the appropriate favorites option from a menu, for example, the Setfrom Favorites option on the context menu of the Register pane.The Favorites Chooser/Editor dialog box is shown in Figure 8-7.Figure 8-7 Favorites Chooser/Editor dialog box8.9.3 Favorites Chooser/Editor dialog box interface componentsThe main interface components of the Favorites Chooser/Editor dialog box (seeFigure 8-7) are:Favorites CategoryThis is the category that is to contain the favorite expression. Favoritescategories used by <strong>RealView</strong> <strong>Debugger</strong> features on page 8-32 identifiesthe dialog boxes where each categories are used.<strong>RealView</strong> <strong>Debugger</strong> automatically sets this to the context from which youdisplayed the dialog box. For example, if you want to set a breakpointfrom the Break/Tracepoint favorites, <strong>RealView</strong> <strong>Debugger</strong> sets this toBreak/Tracepoints.Alternatively, you can select another category if you want to add anexpression manually. Use the New button to create a new favoriteyourself.8-30 Copyright © 2002-2005 <strong>ARM</strong> Limited. All rights reserved. <strong>ARM</strong> DUI 0153G
Working with Browsers and FavoritesFavorites ListLists any favorites that are currently defined for the selected FavoritesCategory.NewEditDeleteClick this button the manually create a new favorite. When you click thisbutton a New/Edit Favorite dialog box is displayed. Enter the requiredexpression and a meaningful description. The expression must match theFavorites Category, for example, a breakpoint if the Break/Tracepointcategory is selected. When you have finished, click OK to add theexpression to the Favorites List.Click this button to edit the selected favorite.Deletes the selected favorite from the Favorites List.Add to List This button is enabled if an expression is shown in the text box to the rightof the button. Otherwise it is disabled.When you click this button a New/Edit Favorite dialog box is displayedshowing the expression from the text box. You can also enter ameaningful description for the expression. When you have finished, clickOK to add the expression to the Favorites List.SetCloseHelpCloses the dialog, and sets the selected favorite for the current context.Closes the dialog box without using a favorite.Displays online help for this dialog box.<strong>ARM</strong> DUI 0153G Copyright © 2002-2005 <strong>ARM</strong> Limited. All rights reserved. 8-31
Working with Browsers and Favorites8.9.4 Favorites categories used by <strong>RealView</strong> <strong>Debugger</strong> featuresTable 8-2 describes where each Favorites Category is used in <strong>RealView</strong> <strong>Debugger</strong>.Table 8-2 Favorites Categories used by <strong>RealView</strong> <strong>Debugger</strong> featuresFavorites CategoryAddressesData ValuesData EndsWhere it is used in <strong>RealView</strong> <strong>Debugger</strong>This is used where you can specify an address or an address range:• In the dialog boxes for setting breakpoints, where you wantto specify an address.See Chapter 4 Working with Breakpoints for details onusing the breakpoint dialog boxes.• In the dialog boxes for setting tracepoints, where you wantto specify an address or an address range.See the chapter the describes tracing in <strong>RealView</strong> <strong>Debugger</strong>in the <strong>RealView</strong> <strong>Debugger</strong> v1.8 Extensions <strong>User</strong> <strong>Guide</strong> fordetails on using the tracepoint dialog boxes.• In the dialog boxes used to locate a specific address, such asin the:— Stack pane (see Using the Stack pane on page 6-31)— Memory pane (see Displaying memory contents onpage 6-19)— Dsm tab.Used to specify data values in the dialog boxes when setting:• BreakpointsSee Chapter 4 Working with Breakpoints for details onusing the breakpoint dialog boxes.• TracepointsSee the chapter the describes tracing in <strong>RealView</strong> <strong>Debugger</strong>in the <strong>RealView</strong> <strong>Debugger</strong> v1.8 Extensions <strong>User</strong> <strong>Guide</strong> fordetails on using the tracepoint dialog boxes.• The value of a memory location in the Memory pane.See Displaying memory contents on page 6-19.• The value of a register in the Register pane.See Changing register contents on page 6-6.Used by the HW Break on Data Value match dialog box, to specifya data value modifier.See Using the HW Break on Data Value match dialog box onpage 4-29 for details.8-32 Copyright © 2002-2005 <strong>ARM</strong> Limited. All rights reserved. <strong>ARM</strong> DUI 0153G
Working with Browsers and FavoritesTable 8-2 Favorites Categories used by <strong>RealView</strong> <strong>Debugger</strong> features (continued)Favorites CategoryWatch ExpressionsBreak/TracepointsBreak QualifiersBreak ActionsFilenamesDirectoriesWhere it is used in <strong>RealView</strong> <strong>Debugger</strong>Used for specifying watchpoints in the Watch pane.See Working with watches on page 6-40 for details on settingwatchpoints.This is used to specify CLI commands for setting breakpoints andtracepoints:• For details on setting breakpoints, see Chapter 4 Workingwith Breakpoints.• For details on setting tracepoints, see the chapter thedescribes tracing in <strong>RealView</strong> <strong>Debugger</strong> in the <strong>RealView</strong><strong>Debugger</strong> v1.8 Extensions <strong>User</strong> <strong>Guide</strong>.This is used for breakpoint qualifiers on the Set Address/DataBreakpoint dialog box.See Specifying Qualifiers on page 4-52 for details.This is used for breakpoint actions on the Set Address/DataBreakpoint dialog box.See Specifying Actions on page 4-53 for details.This is used for the various open and save file dialog boxes tospecify files, such as opening source files, include and workspacefiles, and selecting log files.This is used for the various open and save file dialog boxes tospecify directories, such as opening source files, include andworkspace files, and selecting log files.<strong>ARM</strong> DUI 0153G Copyright © 2002-2005 <strong>ARM</strong> Limited. All rights reserved. 8-33
Working with Browsers and Favorites8-34 Copyright © 2002-2005 <strong>ARM</strong> Limited. All rights reserved. <strong>ARM</strong> DUI 0153G
Chapter 9Working with MacrosIn <strong>RealView</strong> ® <strong>Debugger</strong>, a macro is a C-like function that is invoked by entering a singlecommand using the macro name. This section describes how to define macros for useduring your debugging session, and how to save and edit your macros. It contains thefollowing sections:• About macros on page 9-2• Using macros on page 9-8• Getting more information on page 9-17.<strong>ARM</strong> DUI 0153G Copyright © 2002-2005 <strong>ARM</strong> Limited. All rights reserved. 9-1
Working with Macros9.1 About macrosMacros are interpreted C code running on the host with access to target memory andsymbols, user-defined debugger symbols (in host or target memory), and debuggerfunctions. Macros can access debugger variables, external windows and programs, andcan be attached to breakpoints, aliases, and windows.A macro can contain:• a sequence of expressions• string formatting controls• statements• calls to other macros• predefined macros• target functions• debugger commands.You can define and use macros at any time during a debugging session to use thecommands or statements contained in the macro. You call the macro with a singlecommand using the name. The macro definition might contain parameters that youchange each time the macro is called.When a macro is defined, you can use it as:• a complex command or in an expression• an attachment to a breakpoint to create breakpoint condition testing• an attachment to a window or file where the macro can send information.NoteAfter a macro has been loaded into <strong>RealView</strong> <strong>Debugger</strong>, the definition is stored in thesymbol table. If the symbol table is recreated, for example when an image is loaded withsymbols, any macros are automatically deleted. Disconnecting also clears any macros.This section gives an overview of macros in <strong>RealView</strong> <strong>Debugger</strong>. It includes thefollowing sections:• Properties of macros on page 9-3• <strong>Debugger</strong> commands in macros on page 9-3• Defining macros on page 9-5• Calling macros on page 9-5• Macro return values on page 9-6• Using macros with breakpoints on page 9-6• Attaching macros on page 9-7• Stopping macros on page 9-7.9-2 Copyright © 2002-2005 <strong>ARM</strong> Limited. All rights reserved. <strong>ARM</strong> DUI 0153G
Working with Macros9.1.1 Properties of macrosMacros can:• have return values• contain C expressions• contain certain C statements• have arguments• define macro local variables• use conditional statements• call other macros and predefined macros• be used in expressions, where they return values• reference target variables and registers• reference user-defined variables, in debugger or target memory• execute most debugger commands• be defined in a debugger include file.Macros cannot:• be recursive• define global variables• define static variables• define other macros.9.1.2 <strong>Debugger</strong> commands in macros<strong>RealView</strong> <strong>Debugger</strong> enables you to enter debugger commands on the command line, orwhen using the headless debugger, for example PRINTF or SETMEM.You can define a macro that contains a sequence of debugger commands. When used inthis way, the command must be enclosed by dollar signs ($), shown in Example 9-1.Example 9-1 Using debugger commands in macrossome_commandsdefine int registers(){some_commandsfor(macro_index = 0; macro_index < 6; macro_index++){macro_bin_str[macro_index + 8] = macro_cpsr_mode[macro_index +(6*macro_cpsr_key)];}<strong>ARM</strong> DUI 0153G Copyright © 2002-2005 <strong>ARM</strong> Limited. All rights reserved. 9-3
Working with Macrosmacro_bin_str[14] = 0x00;$printf " r0 = 0x%x" ,@r0$;$printf " r1 = 0x%x" ,@r1$;$printf " r2 = 0x%x" ,@r2$;some_commands}.Macros containing commands are similar to command files and can be used for settingup complex initialization conditions. These macros are executed by entering the macroname and any parameters on the <strong>RealView</strong> <strong>Debugger</strong> command line.The following commands cannot be used inside a macro:• ADD• DEFINE (unless it is the macro definition itself)• DELETE• HELP• HOST• INCLUDE• QUIT.Because macros can return a value, they can also be used in expressions. When themacro executes, the return value is used according to the return type.For full details on all CLI commands, see <strong>RealView</strong> <strong>Debugger</strong> v1.8 Command LineReference <strong>Guide</strong>.Attaching macrosMacros can also be invoked as actions associated with:• a window• a breakpoint• deferred commands, for example BGLOBAL.In this case, execution-type commands cannot be used inside a macro:• GO• GOSTEP• STEPLINE, STEPO• STEPINSTR, STEPOINSTR.9-4 Copyright © 2002-2005 <strong>ARM</strong> Limited. All rights reserved. <strong>ARM</strong> DUI 0153G
Working with MacrosIf you require a conditional breakpoint that performs an action and then continuesprogram execution, you must use the breakpoint continue qualifier, or return 1 from themacro call, instead of the GO command.9.1.3 Defining macrosYou can define a macro outside <strong>RealView</strong> <strong>Debugger</strong> using a text editor and load themacro definition file in with the INCLUDE command. The number of macros that can bedefined is limited only by the available memory on your workstation.You can also create, edit, save, and delete macros from the Code window using theDebug menu, as demonstrated in Using macros on page 9-8.NoteAfter a macro has been loaded into <strong>RealView</strong> <strong>Debugger</strong>, the definition is stored in thesymbol table. If the symbol table is recreated, for example when an image is loaded withsymbols, any macros are automatically deleted. Disconnecting also clears any macros.9.1.4 Calling macrosMacros are called from the <strong>RealView</strong> <strong>Debugger</strong> command line. The call consists of themacro name followed by a set of parentheses containing the macro arguments, separatedby commas.Macro names are case sensitive and must be entered as shown in the definition. Themacro arguments are converted to the types specified in the macro definition. If<strong>RealView</strong> <strong>Debugger</strong> cannot convert the arguments it generates an error message.Examples of macro calls are:mytext(var) Calls the macro named mytext with the argument var.count(7) Calls the macro named count with the parameter 7.You can define a macro with a name that is identical to a command or keyword used by<strong>RealView</strong> <strong>Debugger</strong>. You can then use the macro name in an expression and submit iton the command line where it is interpreted correctly.If, however, you submit the macro name as a command, <strong>RealView</strong> <strong>Debugger</strong> cannotidentify it as a macro. To overcome this, use the prefix MACRO when entering macronames that might conflict with debugger keywords or command names:MACRO macro_name()<strong>ARM</strong> DUI 0153G Copyright © 2002-2005 <strong>ARM</strong> Limited. All rights reserved. 9-5
Working with MacrosMacros take higher precedence than target functions. If a target function and a macrohave the same name, the macro is executed unless the target function is qualified. Forexample, strcpy is a predefined debugger macro, while PROG\strcpy is a function withinthe module PROG. The predefined macro is referenced as strcpy(dest,src), whilePROG\strcpy(dest,src) refers to the function within PROG.9.1.5 Macro return valuesThe type of the macro return value is specified by return_type when you define themacro. If return_type is not specified, then type int is assumed.When attached to a breakpoint, the macro return value controls the behavior of thebreakpoint, see Using macros with breakpoints.9.1.6 Using macros with breakpointsWhen you set a breakpoint, you can also associate a macro with that breakpoint to setup complex break conditions. When you attach a macro to a breakpoint, it acts as acondition qualifier (see Setting conditional breakpoints on page 4-34). Therefore, youcan test your program variables and decide how the breakpoint behaves when it is hit(see Controlling breakpoint behavior with macro return values on page 9-7).The frequency that a macro runs when the breakpoint is hit depends on the order itappears with other condition qualifiers. See Controlling the behavior of breakpoints onpage 4-59 for more details.You can use conditional statements in your macro to change the execution path whenthe breakpoint is triggered depending on variables on the debug target system or on thehost. This enables you to control program execution during your debugging session orwhen there is no user intervention.You can also use high-level expressions in macros. Combining these conditionalstatements and expressions enables you to patch your source program.Breakpoint macros can be used to fill out stubs, such as I/O handling, and also tosimulate complex hardware.For an example of attaching a macro to a breakpoint and using it to control programexecution see Attaching macros to breakpoints on page 4-56.NoteYou cannot use the GO, GOSTEP, STEPINSTR, STEPLINE, STEPO, or STEPOINSTR commands ina macro that is attached to a breakpoint. If any of these commands are present in a sucha macro, the following messages are displayed:9-6 Copyright © 2002-2005 <strong>ARM</strong> Limited. All rights reserved. <strong>ARM</strong> DUI 0153G
Working with MacrosError: Cannot perform operation - thread is running.Error: E0081: Runtime error in macro.Controlling breakpoint behavior with macro return valuesYou can use macro return values to control what action <strong>RealView</strong> <strong>Debugger</strong> takes whena breakpoint is triggered:• If the macro returns a nonzero value, <strong>RealView</strong> <strong>Debugger</strong> continues programexecution. Any qualifiers and actions that appear after the macro are notprocessed, and the triggering of the breakpoint is not recorded.• If a macro returns a value of zero, <strong>RealView</strong> <strong>Debugger</strong> stops program execution.Any actions that are assigned to the macro are performed.NoteThis behavior might be different if you assign additional condition qualifiers to thebreakpoint. See Setting conditional breakpoints on page 4-34 for more details.9.1.7 Attaching macrosIn addition to breakpoints, you can attach macros to:• aliases, for example ALIAS my_alias=my_macro()• windows, for example VMACRO 250, my_macro().9.1.8 Stopping macrosWhen macros are run as commands they are queued for execution like any otherdebugger command when your program is executing. Click the Command canceltoolbar button to cancel the last command entered onto the queue. This can be used tostop any macro that is running. This does not take effect until the previous commandhas completed and so any effects might be delayed.Click the Stop Execution button to stop a macro that is attached to a breakpoint.<strong>ARM</strong> DUI 0153G Copyright © 2002-2005 <strong>ARM</strong> Limited. All rights reserved. 9-7
Working with Macros9.2 Using macrosThis section shows you how to start using macros by working through an example. Itcontains the following sections:• Creating a macro• Viewing a macro on page 9-10• Testing a macro on page 9-10• Editing a macro on page 9-11• Copying a macro on page 9-13• Deleting a macro on page 9-13• Calling a macro on page 9-14.9.2.1 Creating a macroTo create a macro from within <strong>RealView</strong> <strong>Debugger</strong>, you can use the Add/Edit Macrosdialog box. It is not possible to create macros using CLI commands on the commandline.Complete the following steps to create a macro for use with a debug target:1. Connect to your target and load an image, for example dhrystone.axf.2. Select Edit → Advanced → Show Line Numbers to display line numbers.This is not necessary but might help you to follow the examples.3. Select Tools → Add/Edit <strong>Debugger</strong> Macros... to display the Add/Edit Macrosdialog box.When you open this dialog box, the Existing Macros display list is empty, unlessyou have previously loaded macros into <strong>RealView</strong> <strong>Debugger</strong>.The Macro Entry Area gives advice on how to use the buttons, New, Show, andCopy.This area shows the definition of the macro when it has been created.4. Click New to create the macro. This inserts the default name int Macro() in theName data entry field and inserts {} in the Macro Entry Area ready for editing.5. Edit the default macro name so that it shows int tutorial(var1).6. Enter the macro contents to show:int var1;{$printf “value=%d\n”,var1$;}9-8 Copyright © 2002-2005 <strong>ARM</strong> Limited. All rights reserved. <strong>ARM</strong> DUI 0153G
Working with MacrosWhen creating a macro, variables must be declared at the start of the macrodefinition. This also applies to macros that you create using a text editor.The Add/Edit Macros dialog looks like the example shown in Figure 9-1.Figure 9-1 Creating a macroThe macro uses the PRINTF command and so the command must be enclosed bydollar signs ($), shown in the Macro Entry Area.7. Click Update to pass the macro definition to <strong>RealView</strong> <strong>Debugger</strong>, where it isstored in the symbol table. This adds the new macro to the Existing Macrosdisplay list.If there are any errors in the macro text, you are notified when you try to pass themacro to <strong>RealView</strong> <strong>Debugger</strong>.NoteIf the symbol table is recreated, for example when an image is loaded withsymbols or if you disconnect, any macros are automatically deleted.8. View the Output pane message:def int tutorial(var1)9. Click Save... to display the Select file to save/append into dialog box where youcan choose where to save the new macro definition file for later re-use.The macro name has been entered automatically with the extension .inc.10. Save the new macro, with the default name, in your \home directory.If the chosen file already exists, <strong>RealView</strong> <strong>Debugger</strong> displays a warning messageand gives you the option to append the new file or to overwrite the existingcontents.<strong>ARM</strong> DUI 0153G Copyright © 2002-2005 <strong>ARM</strong> Limited. All rights reserved. 9-9
Working with Macros11. Click Close to close the Add/Edit Macros dialog box and return to the Codewindow.9.2.2 Viewing a macroView the contents of a macro using:• the File Editor pane• an external text editor• the SHOW command.Viewing a macro using any of these methods differs from viewing the macro contentsin the Add/Edit Macros dialog box:• The Macro Entry Area, in the dialog box, does not show the macro DEFINEcommand or the terminator (a period used as the first and only character on thelast line).• The SHOW command does not display the terminator.NoteIf you are using a predefined macro, you cannot use the SHOW command to view thedefinition.9.2.3 Testing a macroTo test the macro you have created, you execute the loaded image and then enter themacro on the <strong>RealView</strong> <strong>Debugger</strong> command line:1. Click on the Src tab to view the source file dhry_1.c.2. Set a default breakpoint by double-clicking on line 187.3. Click Go to start execution. When asked for the number of runs, use a smallnumber, for example 5000.4. When the program reaches the breakpoint, enter the following command andpress Enter:tutorial(Int_2_Loc)This displays the current value of the variable Int_2_Loc in the Output pane.5. Step through the program a few more times using the macro to monitor thevariable. You can use the up arrow to step back through the commands alreadysubmitted on the command line.9-10 Copyright © 2002-2005 <strong>ARM</strong> Limited. All rights reserved. <strong>ARM</strong> DUI 0153G
Working with Macros9.2.4 Editing a macroTo edit the macro that you have created and retest it to verify the changes:1. Select Tools → Add/Edit <strong>Debugger</strong> Macros... to display the Add/Edit Macrosdialog. The Existing Macros display list shows the tutorial macro you createdand it is highlighted.2. Click Show to see the contents of the macro.3. Change the macro name to read:int tutorial(var1,var2,var3)4. In the Macro Entry Area change the variable definition to read:int var1;int var2;int var3;5. In the Macro Entry Area change the body of the macro to read:var1==var1++;$fprintf 250, "value=%d\n",var1$;$fprintf 250, "value=%d\n",var2$;$fprintf 250, "value=%d\n",var3$;This change increments var1 and displays the output of the macro in a windowinstead of the Output pane.6. In the Macro Entry Area add this line at the end of the macro:return(var1);This change causes the macro to return the value of the variable. If the value isnonzero, then <strong>RealView</strong> <strong>Debugger</strong> continues program execution after reportingthe result. If the value returned is zero, then execution stops.The macro now looks like the one shown in Figure 9-2 on page 9-12.<strong>ARM</strong> DUI 0153G Copyright © 2002-2005 <strong>ARM</strong> Limited. All rights reserved. 9-11
Working with MacrosFigure 9-2 Editing a macro body7. Click Update to pass the macro definition to <strong>RealView</strong> <strong>Debugger</strong>.8. View the Output pane message:def int tutorial(var1, var2, var3)9. Click Save... to save the updated macro in the same location. This generates aprompt to enable you to Append or Replace the existing file. Click No to replacethe existing tutorial.inc.10. Click Close to close the Add/Edit Macros dialog.To test the macro you have created, you execute the image and then enter the macro onthe <strong>RealView</strong> <strong>Debugger</strong> command line:1. Select Target → Reload Image to Target to reload the image to your debugtarget.2. Enter this command:VOPEN 250This opens a window ready to display the results returned from the macro.3. If you no breakpoint is set on line 187, double-click on line 187 to set a defaultbreakpoint.4. Click Run to start execution. When asked for the number of runs, use a smallnumber, for example 5000.5. When the program reaches the breakpoint, enter the following command on thecommand line of the Code window and press the Enter key:tutorial(Int_1_Loc, Int_2_Loc, Int_3_Loc)9-12 Copyright © 2002-2005 <strong>ARM</strong> Limited. All rights reserved. <strong>ARM</strong> DUI 0153G
Working with MacrosThis displays the current value of the variables in the window.6. Step through the program a few more times using the macro to monitor thevariables. You can use the up arrow to step back through the commands alreadysubmitted on the command line.Remember to save your macros before you exit <strong>RealView</strong> <strong>Debugger</strong>. There is nowarning if any macro definitions are unsaved.9.2.5 Copying a macroYou can use an existing macro to form the basis of a new macro:1. Select Tools → Add/Edit <strong>Debugger</strong> Macros... to display the Add/Edit Macrosdialog and so edit the macro. The Existing Macros display list shows the tutorialmacro you created and it is highlighted.2. Click Show to see the contents of the macro.3. Click Copy. This automatically adds an integer number to the end of the macroname in the Name field, starting at one. For example, inttutorial1(var1,var2,var3). Subsequent copies are numbered sequentially, forexample, int tutorial2... and int tutorial3.... However, you can change thethis name to your own choice.4. In the Macro Entry Area change the body of the macro as required.5. Click Update to pass the macro definition to <strong>RealView</strong> <strong>Debugger</strong>.6. View the Output pane message, assuming that you do not change the defaultname:def int tutorial1(var1,var2,var3)7. Click Save to save the updated macro in the usual way.8. Click Close to close the Add/Edit Macros dialog.The number of macros that can be defined is limited only by the available memory onyour workstation.9.2.6 Deleting a macroWith a group of macros shown in the Existing Macros display list, you can highlightselected macros and click Delete to unload them from <strong>RealView</strong> <strong>Debugger</strong>. This doesnot delete the files themselves if they have been saved to disk. You can only delete onemacro at a time in this way.<strong>ARM</strong> DUI 0153G Copyright © 2002-2005 <strong>ARM</strong> Limited. All rights reserved. 9-13
Working with MacrosYou can also delete a macro, and all associated symbols, using the DELETE command.9.2.7 Calling a macroWhen you first start <strong>RealView</strong> <strong>Debugger</strong>, any macros you created have been unloadedfrom <strong>RealView</strong> <strong>Debugger</strong>.After a macro has been loaded into <strong>RealView</strong> <strong>Debugger</strong>, the definition is stored in thesymbol table. If the symbol table is recreated, for example when an image is loaded withsymbols, any macros are automatically deleted.NoteReloading an image with all associated symbols also deletes any macros.To load, or reload, macros into <strong>RealView</strong> <strong>Debugger</strong>:1. Select Tools from the main menu to display the Tools menu.2. Select Include Commands from File... to display the Select File to IncludeCommands from dialog box.3. Highlight the required .inc file and then click Open. This loads the selectedmacro into <strong>RealView</strong> <strong>Debugger</strong>.If there is an error in the .inc file, an error message is generated in the Output paneand the macro is undefined.4. Select Tools → Add/Edit <strong>Debugger</strong> Macros... to display the Add/Edit Macrosdialog box where your macro is now shown in the Existing Macros display list.You can load in several macros in this way ready for use in your debugging session.When a macro is displayed in the Add/Edit Macros dialog box, it can be changed asdescribed previously and re-used, and resaved if required.Loading macros on connectionYou can load one or more macros automatically when you connect to a given target. Dothis by specifying the macros to be loaded using the Connection Properties window.Enter the calling command using the Commands setting in the Advanced_<strong>Information</strong>block, shown in Figure 9-3 on page 9-15.9-14 Copyright © 2002-2005 <strong>ARM</strong> Limited. All rights reserved. <strong>ARM</strong> DUI 0153G
Working with MacrosFigure 9-3 Loading macros on connectionIf <strong>RealView</strong> <strong>Debugger</strong> cannot locate one of the specified files, it displays a message boxand gives you the option to abort the connection.For full details on how to specify these commands using the Connection Propertieswindow, see the chapter that describes how to configure custom connections in<strong>RealView</strong> <strong>Debugger</strong> v1.8 Target Configuration <strong>Guide</strong>.Loading macros from a projectYou can load one or more macros automatically when you open a project that binds toa connection. Do this by specifying the macros to be loaded using the Project Propertieswindow. Enter the calling command using the Open_conn setting in theCommand_Open_Close group, shown in Figure 9-4.Figure 9-4 Loading macros from a projectIf <strong>RealView</strong> <strong>Debugger</strong> cannot locate one of the specified files, it displays a messagebox. The project then opens and binds as normal.<strong>ARM</strong> DUI 0153G Copyright © 2002-2005 <strong>ARM</strong> Limited. All rights reserved. 9-15
Working with MacrosThis might be useful if combined with the Open_load setting in the SETTINGS group, forexample to load the associated image and all symbols when the project binds.For full details on how to specify these commands using the Project Properties window,see the chapter that describes how to customize your projects in <strong>RealView</strong> <strong>Debugger</strong>v1.8 Project Management <strong>User</strong> <strong>Guide</strong>.9-16 Copyright © 2002-2005 <strong>ARM</strong> Limited. All rights reserved. <strong>ARM</strong> DUI 0153G
Working with Macros9.3 Getting more informationSee <strong>RealView</strong> <strong>Debugger</strong> v1.8 Command Line Reference <strong>Guide</strong> for more information onhow to use macros:• see the chapter that describes working with the CLI for details on writing yourown scripts• see the chapter that describes <strong>RealView</strong> <strong>Debugger</strong> commands for full details onusing the DEFINE command• see the chapter that describes predefined macros for full details on predefined anduser interaction macros in <strong>RealView</strong> <strong>Debugger</strong>.<strong>ARM</strong> DUI 0153G Copyright © 2002-2005 <strong>ARM</strong> Limited. All rights reserved. 9-17
Working with Macros9-18 Copyright © 2002-2005 <strong>ARM</strong> Limited. All rights reserved. <strong>ARM</strong> DUI 0153G
Chapter 10Configuring Workspace SettingsThis chapter explains how to use workspaces in <strong>RealView</strong> ® <strong>Debugger</strong>, and describeshow to configure your workspace settings. Read this chapter in conjunction withAppendix A Workspace Settings Reference that contains a detailed description of theworkspace settings.This chapter contains the following sections:• Using workspaces on page 10-2• Viewing workspace settings on page 10-9• Configuring workspace settings on page 10-15.<strong>ARM</strong> DUI 0153G Copyright © 2002-2005 <strong>ARM</strong> Limited. All rights reserved. 10-1
Configuring Workspace Settings10.1 Using workspaces<strong>RealView</strong> <strong>Debugger</strong> uses a workspace to define:• connection information• a list of projects to open when the next session starts• debugger behavior• windows (sizes and positions) and their attachment• window contents and panes• user-defined editor settings and view options.It is not compulsory to use a workspace when working with <strong>RealView</strong> <strong>Debugger</strong>.However, using a workspace enables you to maintain persistence between debuggingsessions.Working without a workspace might be useful to debug an executable file from anotherdeveloper or for compatibility with other tools. This means that some persistence detailsare not available.This section describes workspaces in <strong>RealView</strong> <strong>Debugger</strong>. It includes:• Initializing the workspace• Workspace menu on page 10-3• Opening workspaces on page 10-5• Closing workspaces on page 10-5• Projects in workspaces on page 10-6• Creating an empty workspace on page 10-7.For details on setting up multiple Code windows and attaching to different debugtargets, see the multiprocessing chapter in <strong>RealView</strong> <strong>Debugger</strong> v1.8 Extensions <strong>User</strong><strong>Guide</strong>.10.1.1 Initializing the workspaceThe first time you run <strong>RealView</strong> <strong>Debugger</strong> after installation, it creates a defaultworkspace to define your initial working environment. Two files are created in your<strong>RealView</strong> <strong>Debugger</strong> home directory to store settings:rvdebug.aws Contains workspace-specific settings that apply to the current workspace.rvdebug.ini Contains global configuration options that apply to all workspaces, or areused when working without a workspace.10-2 Copyright © 2002-2005 <strong>ARM</strong> Limited. All rights reserved. <strong>ARM</strong> DUI 0153G
Configuring Workspace SettingsBy default, at the end of your session, the .aws file is updated to save the currentworkspace and is used when you start your next session. The global configuration fileis updated when it is edited or at the end of your session if you are working without aworkspace.Start-up optionsYou can start <strong>RealView</strong> <strong>Debugger</strong> with a specified workspace from the command line,or by using a desktop shortcut, for example:rvdebug.exe -aws=“D:\<strong>ARM</strong>\RVD\home\my_user_name\myws_rvdebug.aws”You can start a debugging session without a workspace, for example:rvdebug.exe -aws=-10.1.2 Workspace menuIn a debugging session you can:• edit your workspace settings and resave them ready for the next session• set up specific workspaces containing custom settings for use during selecteddebugging sessions or with particular application programs• switch between workspaces, without exiting the debugger, to continue previousdebugging sessions• close the current workspace and continue the session without a workspace.To manage your current workspace, select File → Workspace from the Code windowmenu to display the Workspace menu:Open Workspace...Displays a dialog box where you can locate a workspace to open, seeOpening workspaces on page 10-5 for details.If you are already using a workspace, select this option to close thecurrent workspace before the new workspace opens, see Closingworkspaces on page 10-5 for details.Save WorkspaceSaves the current workspace to disk. This is useful if you have madechanges since your debugging session began. The workspace file, forexample rvdebug.aws, is saved with the same name and the workspacebackup file is updated.<strong>ARM</strong> DUI 0153G Copyright © 2002-2005 <strong>ARM</strong> Limited. All rights reserved. 10-3
Configuring Workspace SettingsSave As Workspace...Saves the current workspace to disk using a new name. This is useful ifyou have made changes since your debugging session began and want tosave this new setup in a new workspace. This displays a dialog box whereyou can specify the new filename, for example test_workspace.aws.The newly-specified workspace becomes the current workspace.Workspace Options...Displays the Workspace Options window where you can view the currentworkspace settings or make changes. See Viewing workspace settings onpage 10-9 and Configuring workspace settings on page 10-15 for moredetails.Save Settings on ExitSelected by default, this option saves selected user-configured settingsand the current workspace when you exit <strong>RealView</strong> <strong>Debugger</strong>. Thisenables you to start your next debugging session in the same state.If selected, settings are saved in your start-up file, using the .savextension by default, for use next time and the current workspace file isupdated.Same Workspace on StartupSelected by default, this option saves the current workspace pathname inyour .sav file so that the same workspace is used at the next start-up.You can unselect this option so that the current workspace is not openedby default when you next start <strong>RealView</strong> <strong>Debugger</strong>. Unless you specify aworkspace on the command line, <strong>RealView</strong> <strong>Debugger</strong> then runs withouta workspace.Close WorkspaceCloses the current workspace. After the workspace closes, <strong>RealView</strong><strong>Debugger</strong> displays a list box so you can close any open objects. SeeClosing workspaces on page 10-5 for more details.Recent WorkspacesDisplays the Recent Workspace menu that lists any previous workspacesthat you have saved. Select a workspace from this menu to use thoseworkspace setting.10-4 Copyright © 2002-2005 <strong>ARM</strong> Limited. All rights reserved. <strong>ARM</strong> DUI 0153G
Configuring Workspace Settings10.1.3 Opening workspacesIf you open a new workspace, <strong>RealView</strong> <strong>Debugger</strong> adds the objects specified in the newworkspace to all existing objects. This usually means that at least one more Codewindow opens on your desktop.If you open a new workspace, you might see many new Code windows on your desktop.To avoid this, close open windows before opening the new workspace, see Closingworkspaces for details.When you open a new workspace, it might contain settings that override the currentconfiguration. Where there is a conflict, a warning message is displayed and the newworkspace settings are used.10.1.4 Closing workspacesYou can explicitly close your current workspace, either:• select File → Workspace → Close Workspace• select File → Workspace → Open Workspace... to close the current workspacebefore the new one opens.If you close your current workspace, the following applies:• The contents of the default Code window do not change.• If there are open objects, these do not change (see Closing objects for details).• Any open objects are saved in the workspace before it closes so that they can bere-used when it next opens.• If there are no open objects, the current workspace closes immediately.• If the Workspace Options window is open, this closes automatically before thecurrent workspace closes. If you have changed any workspace settings, these aresaved.• If the Options window is open, this is not affected when the workspace closes.Closing objectsIf you close a workspace, <strong>RealView</strong> <strong>Debugger</strong> enables you to close any open objects.This might be useful to restore a clean desktop for the session, or before you open a newworkspace.After the current workspace closes, <strong>RealView</strong> <strong>Debugger</strong> displays a list selection boxwhere you can specify the open objects you want to close, shown in Figure 10-1.<strong>ARM</strong> DUI 0153G Copyright © 2002-2005 <strong>ARM</strong> Limited. All rights reserved. 10-5
Configuring Workspace SettingsNoteThe Close Open Objects selection box is not displayed if there are no open objects.The display list shows the open objects, that is:• connections to debug targetsFigure 10-1 Close Open Objects selection box• any Code windows open in addition to the default Code window• open projects including user-defined projects and auto-projects (see Projects inworkspaces on page 10-6 for details).Each entry has an associated check box that is ticked by default. Select the check boxto unselect objects. The list selection box contains the controls:OKCancelHelpClick this button to close selected objects and then close the selectionbox.Click this button to ignore the status of any check boxes in the list andclose the selection box. Use Cancel to maintain all open objects.Click this button to display the online help.You can use the Close icon to close the selection box. This is the same as clickingCancel.10.1.5 Projects in workspaces<strong>RealView</strong> <strong>Debugger</strong> saves a project load list when the current workspace closes. This isa list of open projects maintained when the debugger starts with this workspace or whenyou open this workspace in a session. This list includes user-defined projects and anyauto-projects where you have saved the settings.10-6 Copyright © 2002-2005 <strong>ARM</strong> Limited. All rights reserved. <strong>ARM</strong> DUI 0153G
Configuring Workspace SettingsWhere you are using a project load list, you must be aware of the following when theworkspace opens:• Where a project was bound to a connection when the workspace closed, bindingdetails are saved and this is maintained when the connection is restored.• Project binding details saved in the workspace take precedence. This applies evenwhere the load list opens an autobound project that is unbound, that is where youhave defined a Specific_device setting.• Where there is no connection, the order in which projects open defines the activeproject.If you are already running a debugging session and you open a new workspace, theproject environment might change depending on the project load list (if any). <strong>RealView</strong><strong>Debugger</strong> forces the project binding as defined in the workspace even if this meansunbinding open projects. This is the case even if the open projects include an autoboundproject, that is a project where you have defined a Specific_device setting.If the workspace opens with no saved binding details, the current project environmentdoes not change. This is the case even if the project load list contains a project whereyou have defined a Specific_device setting.NoteThere is no warning when the project environment changes as a result of opening aworkspace into a debugging session.If you are licensed to work with multiple projects in multiprocessor debugging mode,the workspace restores the project environment based on:• your connections• the order in which projects open• saved project binding details• open Code windows and their attachment.See <strong>RealView</strong> <strong>Debugger</strong> v1.8 Project Management <strong>User</strong> <strong>Guide</strong> for full details onworking with projects and project binding.10.1.6 Creating an empty workspaceYou can create a blank workspace settings file at any point during your debuggingsession. To do this, select File → Workspace → New Workspace... from the Codewindow main menu. This displays the New Workspace dialog box.<strong>ARM</strong> DUI 0153G Copyright © 2002-2005 <strong>ARM</strong> Limited. All rights reserved. 10-7
Configuring Workspace SettingsUse this to create an empty file, for example New_workspace.aws, in the new location.This becomes the current workspace. You must save settings to this new workspacesettings file if you want it to be available at the next start-up.If you are already working with a workspace this closes and then the new workspaceopens ready for you to use. This does not override the current configuration.10-8 Copyright © 2002-2005 <strong>ARM</strong> Limited. All rights reserved. <strong>ARM</strong> DUI 0153G
Configuring Workspace Settings10.2 Viewing workspace settings<strong>RealView</strong> <strong>Debugger</strong> provides the Workspace Options window to enable you toexamine, and change, workspace settings. Use this interface to see the contents of the.aws file and the .ini file.There are descriptions of the general layout and controls of the <strong>RealView</strong> <strong>Debugger</strong>Settings windows in the <strong>RealView</strong> <strong>Debugger</strong> online help topic Changing Settings. Thischapter assumes familiarity with the procedures documented in that topic.This section contains:• Using Settings windows• Options window• Workspace Options window on page 10-10• Groups and settings on page 10-13.10.2.1 Using Settings windows10.2.2 Options windowTo access your current workspace settings or global configuration options:File → Workspace → Workspace Options...Displays the Workspace Options window where you can view the currentworkspace settings or make changes.Tools → Options...Displays the Options window where you can view the globalconfiguration options, used by the current workspace, or make changes.You have access to the global options when you are working without aworkspace.The Options window enables you to examine, and change, your current globalconfiguration options. These settings are saved in the file rvdebug.ini and are includedwhen the default workspace opens for the first time.If you are working without a workspace, use this window to make the changes describedin the rest of this chapter.<strong>ARM</strong> DUI 0153G Copyright © 2002-2005 <strong>ARM</strong> Limited. All rights reserved. 10-9
Configuring Workspace Settings10.2.3 Workspace Options windowThe Workspace Options window enables you to examine your current workspacesettings and edit these settings to change the workspace or to create your ownworkspace files. The first time <strong>RealView</strong> <strong>Debugger</strong> opens the default workspace file,rvdebug.aws, the Workspace Options window contains only the start-up settings, shownin Figure 10-2.The main interface components of this window are:Figure 10-2 Workspace Options windowMain menu This contains:File Displays the File menu where you can save the workspace fileafter you have made changes.View Displays the View menu to toggle the display to show all thesettings or only those that have been edited.Help Displays the online Help menu.Save iconClick this icon to save the workspace settings file to disk. The name ofthe current file is shown as the first entry in the left pane.Description This field displays a one-line description about an entry selected in theList of Entries pane or Settings Values pane.List of Entries paneThe left pane is the List of Entries pane, and shows configuration entriesas a hierarchical tree with node controls (see List of Entries pane onpage 10-11).10-10 Copyright © 2002-2005 <strong>ARM</strong> Limited. All rights reserved. <strong>ARM</strong> DUI 0153G
Configuring Workspace SettingsSettings Values paneThe right pane is the Settings Values pane, and shows the settings for thegroup selected in the List of Entries pane (see Settings Values pane onpage 10-12).When you close down <strong>RealView</strong> <strong>Debugger</strong>, your workspace settings file is updated withthe current configuration, for example projects, connections, and open windows.NoteSee the <strong>RealView</strong> <strong>Debugger</strong> online help topic Changing Settings for details on all theentries in the Workspace Options window.List of Entries paneThe left pane of the Workspace Options window, the List of Entries pane, showsworkspace entries as a hierarchical tree with node controls (see Figure 10-3 onpage 10-12). Groups of settings are associated with an icon to explain their function:Red diskThis is a container disk file.<strong>RealView</strong> <strong>Debugger</strong> uses this, for example, to specify an include file.Yellow folderThis is a parent group containing other groups (rules pages) and/orentries.Rules pageA rules page is a container for settings values that you can change in theright pane. When unselected, the pencil disappears (see Figure 10-3 onpage 10-12).This icon only appears in the left pane.An asterisk (*) is placed at the front of an entry to show that it has changed from thedefault or was created by <strong>RealView</strong> <strong>Debugger</strong>. Figure 10-3 on page 10-12 shows anexample settings file that specifies a multiprocessor debugging session.<strong>ARM</strong> DUI 0153G Copyright © 2002-2005 <strong>ARM</strong> Limited. All rights reserved. 10-11
Configuring Workspace SettingsFigure 10-3 Example Workspace OptionsIf you click on an entry in the left pane, a red box is drawn around it and the Descriptionfield is updated. At the same time, the right pane, the Settings Values pane, is updatedto show the contents of the highlighted group (see Settings Values pane).Settings Values paneIf you click on an entry in the left pane, a red box is drawn around it and the Descriptionfield is updated. At the same time, the right pane, the Settings Values pane, is updatedto show the contents of the highlighted group. Groups of settings are associated with anicon to explain their function:Red diskThis specifies a disk file.<strong>RealView</strong> <strong>Debugger</strong> uses this, for example, to specify a board file.Yellow folderThis is a parent group or rules page containing other groups (rules pages)and/or entries.String value This is a text string. If more than one value can be assigned to the setting,a new setting is created with the chosen value, and is colored blue. Theoriginal setting remains available for you to add other values if required.Numerical valueThis is a numerical value.10-12 Copyright © 2002-2005 <strong>ARM</strong> Limited. All rights reserved. <strong>ARM</strong> DUI 0153G
Configuring Workspace SettingsTrue/False valueThis has a value that is either True or False. To change the value, either:• click on the switch button in the Value field• right-click on the setting, and select True or False from the contextmenu.Preset selections valueThis enables you to select the value from a list that is defined by<strong>RealView</strong> <strong>Debugger</strong>. If more than one value can be assigned to thesetting, a new setting is created with the chosen value, and is colored blue.The original setting remains available for you to add other values ifrequired.An asterisk (*) is placed at the front of a setting to show that it has changed from thedefault or that it was changed by <strong>RealView</strong> <strong>Debugger</strong>.10.2.4 Groups and settingsWorkspace settings, in the left pane, are grouped according to their function:Workspace fileThis is the current workspace settings file. Click on this entry to see thefull pathname in the Description field.Global configuration fileThis is the global configuration file, rvdebug.ini, included in the currentworkspace.You can set up DEBUGGER, CODE, or ALL groups in your workspace settingsfile or in your global configuration file. <strong>RealView</strong> <strong>Debugger</strong> issues awarning if conflicts are detected when the workspace opens and usessettings from the new workspace file.DEBUGGERThese settings govern the behavior of generic actions in the debugger.These controls are used in conjunction with other processor-specificcontrols.CODEThese settings govern the behavior of all Code windows. They control thedisplay characteristics of windows, including size and position, and anyuser-defined buttons created on the toolbars (not available in this release).<strong>ARM</strong> DUI 0153G Copyright © 2002-2005 <strong>ARM</strong> Limited. All rights reserved. 10-13
Configuring Workspace SettingsALLThese settings govern the behavior of the editor, the editor display, andaccess to source code. The settings in the ALL group are used inconjunction with the settings in the DEBUGGER group and the CODE groupand might be overridden by settings in either of these two groups.PROJECTSThis specifies a project load list, that is a project, or projects, openedwhen the debugger starts with this workspace or when you open thisworkspace in a session. This list includes user-defined projects and anyauto-projects where you have saved the settings.This group is created automatically when <strong>RealView</strong> <strong>Debugger</strong> closesdown with open projects, or if you close the current workspace.WINDOWThis is a special group of windows internals maintained by <strong>RealView</strong><strong>Debugger</strong>. An entry is created for each open window. Entries cannot beedited.You must not delete these entries.CONNECT When you close down, you have the option to save connection details sothat the same connections are used when <strong>RealView</strong> <strong>Debugger</strong> starts upwith the same workspace.This is a special group, to specify connections, maintained by <strong>RealView</strong><strong>Debugger</strong>. An entry is created for each connection. Entries cannot beedited.You must not delete these entries.For a full description of all the workspace settings you can change see Appendix AWorkspace Settings Reference.10-14 Copyright © 2002-2005 <strong>ARM</strong> Limited. All rights reserved. <strong>ARM</strong> DUI 0153G
Configuring Workspace Settings10.3 Configuring workspace settingsThe following notes apply to changing your workspace settings:• Settings are applied in the order they are shown in the settings hierarchy in the leftpane. This means that settings in the workspace file take priority over globalconfiguration settings if a conflict arises when you open a workspace.• If you edit the workspace settings, the .aws file is updated when you save thechange. This change takes effect in any new Code windows you open in thecurrent session.• Use the Options window to make changes to global configuration options savedin the rvdebug.ini file.• If you edit the global configuration options, the .ini file is updated when yousave the workspace file. This change takes effect when the workspace next opens.• Do not change the same setting in the Workspace Options window and theOptions window at the same time because the views might not be consistent.This section describes:• Restoring settings• Changing settings on page 10-16• Copying entries on page 10-17• Pasting entries on page 10-17• Cutting entries on page 10-19• Resetting entries on page 10-19.10.3.1 Restoring settingsIf you have made changes to your workspace settings file, or your global configurationfile, and you want to restore the factory settings:1. Exit <strong>RealView</strong> <strong>Debugger</strong> in the normal way.2. Locate the .aws and the .ini files in your <strong>RealView</strong> <strong>Debugger</strong> home directory.3. Delete both files.4. Start <strong>RealView</strong> <strong>Debugger</strong> and accept the option to create a new .aws file.<strong>ARM</strong> DUI 0153G Copyright © 2002-2005 <strong>ARM</strong> Limited. All rights reserved. 10-15
Configuring Workspace Settings10.3.2 Changing settingsThis section includes examples of changes that you can make to your currentworkspace. Select File → Workspace → Workspace Options... to display theWorkspace Options window to edit the workspace file. This means that changes takeeffect in the current workspace:• Configuring the Code window• Setting up debugger options.When you have saved a change, select View → New Code Window to display a newCode window to see the effect.Configuring the Code windowTo change the size of the Code window:1. Expand the CODE group.2. Expand the Pos_size group.3. Right-click on the default Num_lines setting.4. Select Edit Value from the context menu.5. Use in-place editing to set the value to 0x040.6. Press Enter to confirm your setting.7. Save the updated version of the workspace settings file.NoteTo restore the Code window, select the option Reset to Empty.Setting up debugger optionsTo change the height of the Output pane:1. Expand the DEBUGGER group.2. Expand the Command group.3. Right-click on the default Num_lines setting.4. Select Edit Value from the context menu.5. Use in-place editing to set the value to 10.10-16 Copyright © 2002-2005 <strong>ARM</strong> Limited. All rights reserved. <strong>ARM</strong> DUI 0153G
Configuring Workspace Settings6. Press Enter to confirm your setting.7. Save the updated version of the workspace settings file.NoteTo restore the Code window, select the option Reset to Empty.10.3.3 Copying entriesWhen you are working in the Workspace Options window, context menus includeoptions to enable you to copy settings so that you can make changes quickly. Theoptions that are available depend on the:• pane you are working in• contents of the clipboard• relationship between what is on the clipboard and the entry under the cursor whenyou right-click.The available options are:CopySelect this option to make a copy of an entry to the clipboard ready forpasting.This option is always available in the left pane to copy settings groups.When you are working in the right pane, this option depends on the entryunder the cursor.10.3.4 Pasting entriesMake Copy...Where permitted, this option enables you to make a copy of the chosengroup. A dialog box enables you to define a new name for the copy.When you are working in the Workspace Options window, context menus includeoptions to enable you to paste settings so that you can make changes quickly. Like thecopy options, the paste options that are available depend on the:• pane you are working in• contents of the clipboard• relationship between what is on the clipboard and the entry under the cursor whenyou right-click.<strong>ARM</strong> DUI 0153G Copyright © 2002-2005 <strong>ARM</strong> Limited. All rights reserved. 10-17
Configuring Workspace SettingsThe available options are:Paste Group IntoThis option is only available if you right-click on a settings group, or acontainer disk file, with a settings group already copied to the clipboard.This option is usually available in the left pane to paste settings groupsinto the settings file, or to copy between the workspace settings file andthe global configuration file.When you are working in the right pane, this option depends on the entryunder the cursor. This means that you might not be able to paste thecontents of the clipboard into the chosen location.Paste Rule HereCertain settings in the right pane are classed as rules. In particular, youcan use rules to specify settings for projects when you are working in theProject Properties window. See the chapter that describes customizingprojects in <strong>RealView</strong> <strong>Debugger</strong> v1.8 Project Management <strong>User</strong> <strong>Guide</strong> fordetails.This option is only available if you right-click on a settings group, or acontainer disk file, with a single rule setting already copied to theclipboard.This option is available in the left or right pane if you select a settingsgroup that can accept the rule currently on the clipboard. This means thatyou might not be able to paste the contents of the clipboard into thechosen location.Paste as 1st ChildTo see this option, you must right-click on a parent group with a childgroup already copied to the clipboard.Use this option, in the left pane, to paste a settings group into a parentgroup, that is to create a sibling group.When you are working in the right pane, use this option to paste a childgroup. The paste only succeeds if the chosen parent group can accept thechild. This means that you might not be able to paste the contents of theclipboard into the chosen location.This option might be replaced by Paste After. This depends on the entryunder the cursor.Paste After Use this option, like Paste as 1st Child, to paste a settings group into aparent group, that is to create a sibling group.10-18 Copyright © 2002-2005 <strong>ARM</strong> Limited. All rights reserved. <strong>ARM</strong> DUI 0153G
Configuring Workspace Settings10.3.5 Cutting entriesThis option enables you to specify the relationship between the newgroup and other siblings. This determines the order in which settings areused.Paste String This option is only available in the right pane if you right-click on asettings group, or a container disk file, with a string setting already copiedto the clipboard.The paste only succeeds if you select a setting that can accept the stringcurrently on the clipboard. This means that you might not be able to pastethe contents of the clipboard into the chosen location.Paste Value This option is only available in the right pane if you right-click on asettings group, or a container disk file, with a value setting already copiedto the clipboard.The paste only succeeds if you select a setting that can accept the valuecurrently on the clipboard. This means that you might not be able to pastethe contents of the clipboard into the chosen location.When you are working in the Workspace Options window, context menus include theoption Cut to enable you to mark an entry for deletion. The entry is grayed out until youpaste it into a new location.If you cut another entry before you paste the first entry, the first entry is restored.If you cut an entry, do not delete it until it has been pasted. If you delete the cut entry, itis no longer available to paste. This also applies to entries that you copy.Always use a Delete option to remove unwanted entries.10.3.6 Resetting entriesAn asterisk is placed at the front of any entry that you edit in the workspace settings fileto show that it has changed from the default. This also applies to entries maintained by<strong>RealView</strong> <strong>Debugger</strong>. You can reset all values using the File → Reset option from thewindow menu. This updates the window with the settings currently saved on disk. Youare warned that any changes made since you last saved are lost.When you have changed a value, right-click to see the context menu showing the optionReset to Default. Select this to change the value to the default and cancel any changes.Right-click on a group of settings and select Delete Contents from the context menu toreset it back to empty. This deletes all the changed settings and restores the defaults.There is no undo.<strong>ARM</strong> DUI 0153G Copyright © 2002-2005 <strong>ARM</strong> Limited. All rights reserved. 10-19
Configuring Workspace Settings10-20 Copyright © 2002-2005 <strong>ARM</strong> Limited. All rights reserved. <strong>ARM</strong> DUI 0153G
Appendix AWorkspace Settings ReferenceThis appendix contains reference details about settings that define the <strong>RealView</strong> ®<strong>Debugger</strong> workspace and global configuration options. It contains the followingsections:• DEBUGGER on page A-2• CODE on page A-6• ALL on page A-8.<strong>ARM</strong> DUI 0153G Copyright © 2002-2005 <strong>ARM</strong> Limited. All rights reserved. A-1
Workspace Settings ReferenceA.1 DEBUGGERSettings in this group govern the behavior of generic actions in the debugger. Thesecontrols are then used in conjunction with other processor-specific controls.DEBUGGER contains two second-level groups and a file:• Command• Disassembler on page A-3• Board_file on page A-5.A.1.1CommandSettings in this group control the behavior and appearance of the Code windowcommand line and Output pane. Use these to customize the input and output formatused in this area.When <strong>RealView</strong> <strong>Debugger</strong> starts, it uses the last-used settings unless overridden bysettings in this group. These settings can be overridden dynamically by issuing CLIcommands.Saving changes takes immediate effect or at next start-up.Table A-1 describes the settings.Table A-1 Command settingsNameNum_linesRadix_inRadix_outPropertiesThe height of the Output pane. The default setting is 5 lines. Valuescan be entered in hex or decimal, for example 15 or 0x000F.This setting specifies the format of number input options at start-up.The default format is decimal. However, you can enter hex numbers,for example ce number=0xABCD.Switching to hex also enables you to enter decimal numbers, forexample ce number=01234t.This setting specifies number format output options at start-up. Thedefault format is decimal.A-2 Copyright © 2002-2005 <strong>ARM</strong> Limited. All rights reserved. <strong>ARM</strong> DUI 0153G
Workspace Settings ReferenceTable A-1 Command settings (continued)NameCharUcharBuffer_heightPropertiesThe way that char* and char[] values are displayed, for example asstrings or values, for the PRINT command.The way that unsigned char* values are displayed, for example asstrings or values, for the PRINT command.The number of lines of scrollback available in the Command area.The default is 1024 lines. Values must be greater than 32.Changing this takes effect when <strong>RealView</strong> <strong>Debugger</strong> next starts.A.1.2DisassemblerSettings in this group control how the disassembly view is displayed in the Codewindow. This can be set for all processors or for specific processors only. The defaultsettings apply to all processors.When <strong>RealView</strong> <strong>Debugger</strong> starts, it uses the last-used settings unless overridden bythese settings. These settings can be overridden dynamically by issuing CLI commands.Saving changes takes immediate effect.NoteSome processor disassemblers do not support features configured with these settings,and the settings are ignored.Table A-2 describes the settings.Table A-2 Disassembler settingsNameSymbolsLabelsSourcePropertiesWhen instructions reference direct memory locations, either relativeto the PC or as absolute references, the debugger tries to show thesymbol at that location. Use this to disable this property.When an instruction has a label associated with the address, thedebugger shows it inline. Use this to disable this property.By default, high-level source code is interleaved with disassemblycode when available. Use this to disable this property.<strong>ARM</strong> DUI 0153G Copyright © 2002-2005 <strong>ARM</strong> Limited. All rights reserved. A-3
Workspace Settings ReferenceTable A-2 Disassembler settings (continued)NameAsm_sourceSource_line_cntStack_symsRegister_symsFormatInstr_valuePropertiesBy default, assembler source code is interleaved with disassemblycode when available. This is isolated from high-level language sourcecode display because the assembly source is usually of less interest inthis mode. Not all assemblers produce the information to enableassembly tagging. This setting does not affect what is shown in theSrc tab in the File Editor pane.By default, interleaved display shows eight lines of source code forany instruction. If there are more source lines associated with theinstruction, they are not shown. Use this to define how many lines areshown, or to specify that all are shown.Some disassemblers identify frame or stack offset references in theoperand fields. Use this to display the corresponding stack-basedvariable when possible.Not available with <strong>ARM</strong> ® tools.Some disassemblers identify register usage in the operand fields. Usethis to show the corresponding register-based variable when possible.Some disassemblers include alternate format which isprocessor-specific. By default, <strong>RealView</strong> <strong>Debugger</strong> shows the formatthat is most appropriate for the given processor context. Use this tochange the default format.You can also change the format dynamically using the DISASSEMBLEcommand, that is DISASSEMBLE /D, for default format, or DISASSEMBLE/A, for alternate formatWhen debugging <strong>ARM</strong> processors, use this toforce the disassembler to display 16-bit values, as opposed toshowing the appropriate format for the given processor context, thatis mixed 16-bit and 32-bit values.Some DSPs use this to differentiate mnemonic and algebraic format.In general, disassemblers show instructions as values and as opcodesor operands. Use this to suppress the value display where possible.A-4 Copyright © 2002-2005 <strong>ARM</strong> Limited. All rights reserved. <strong>ARM</strong> DUI 0153G
Workspace Settings ReferenceA.1.3Board_fileChange this setting to specify a different board file for the current session.Changing this value takes immediate effect. The specified board file is read and thecontents used to populate the configuration details.Resetting the value back to Empty does not take effect until the next time <strong>RealView</strong><strong>Debugger</strong> starts.<strong>ARM</strong> DUI 0153G Copyright © 2002-2005 <strong>ARM</strong> Limited. All rights reserved. A-5
Workspace Settings ReferenceA.2 CODESettings in this group govern the behavior of all Code windows when running adebugging session. These settings control the display characteristics of windows, theirsize and position, and any user-defined buttons created on the toolbars (not available inthis release).CODE contains two second-level groups and a settings rule:• Pos_size• Button• Asm_type on page A-7.A.2.1Pos_sizeSettings in this group control the position on screen and the size of Code windows inlines and characters. Use these to customize the size and position of Code windows inthe debugger.On start-up, <strong>RealView</strong> <strong>Debugger</strong> uses the last-used settings unless overridden by thesesettings. As you open new Code windows in the session, they are controlled by thesesettings.Table A-3 describes the settings.Table A-3 Pos_size settingsNameNum_linesNum_charsX_posY_posPropertiesUse this to specify window height as a given number of lines. Thedefault is 0x0200.Use this to specify window width as a given number of characters.The default is 0x02A0.Use this to specify the X position of the top-left corner of the window.The default is 0x010F.Use this to specify the Y position of the top-left corner of the window.The default is 0x0066.A.2.2ButtonNoteThese settings are not available in this release.A-6 Copyright © 2002-2005 <strong>ARM</strong> Limited. All rights reserved. <strong>ARM</strong> DUI 0153G
Workspace Settings ReferenceA.2.3Asm_typeWhen an assembler source file opens, <strong>RealView</strong> <strong>Debugger</strong> decides what type ofprocessor is in use. However, the processor type is unknown if:• there are no active connections• there are no user-defined projects currently open• there are no auto-projects currently open.In this case, <strong>RealView</strong> <strong>Debugger</strong> does not know the format of instructions and so cannotdefine source coloring rules. This generates a selection box where you can specify theprocessor type.Change this to specify a default processor type on start-up, for example <strong>ARM</strong>.Saving a change to this setting takes immediate effect on new assembler source filesopened following the update.<strong>ARM</strong> DUI 0153G Copyright © 2002-2005 <strong>ARM</strong> Limited. All rights reserved. A-7
Workspace Settings ReferenceA.3 ALLThis group contains three second-level groups:• Text• Search on page A-11• Edit on page A-12.A.3.1TextSettings in this group control the File Editor pane and editor functions within the Codewindow.Saving changes might not take effect until the next time <strong>RealView</strong> <strong>Debugger</strong> starts, orwhen a new Code window opens.The Text group contains third-level groups and a series of settings:HeightWidthUse this setting to specify the height, in number of lines, for textdisplayed in the File Editor pane.Use this setting to specify the width, in number of characters, for textdisplayed in the File Editor pane.Src_color_disSource coloring is used to make it easier to read source of high-level andlow-level languages. All source coloring can be disabled in which case alltext is the same color (usually black).By default, source coloring is enabled, that is this setting is False.InternationalizationSettings in this group configure multiple language support.A-8 Copyright © 2002-2005 <strong>ARM</strong> Limited. All rights reserved. <strong>ARM</strong> DUI 0153G
Workspace Settings ReferenceTable A-4 describes these settings.Table A-4 Internationalization settingsNameEnabledLanguageDefault_encodingPropertiesUse this to enable or disable internationalization. By default,internationalization is disabled, that is this setting is False.Use this to specify the language to use for text. The options are:• English (default)• Japanese• Chinese.For Chinese and Japanese languages, see the font recommendationsin the <strong>RealView</strong> <strong>Debugger</strong> v1.8 Essentials <strong>Guide</strong>.Use this to specify the default text encoding. The options are:• ASCII (default)• UTF-8• Locale.Font_informationThis group contains the Pane_font setting to set the font used in panes:• On Windows, a Font dialog box is displayed to enable you tochange the font settings shown in Table A-5. This table also showsthe default font settings.Table A-5 Default font settings (Windows)SettingFontFont styleDefault ValueCourier NewRegularSize 9ScriptWestern• On Sun Solaris and Red Hat Linux, a dialog box is displayed whereyou must type in the font information directly. The default font isCourier New. The font information must be in the following format:font_name,n,n,n,n,n,n,n,n,n,n,n,n,nFor example, to set the equivalent font settings to those given inTable A-5, enter:<strong>ARM</strong> DUI 0153G Copyright © 2002-2005 <strong>ARM</strong> Limited. All rights reserved. A-9
Workspace Settings ReferenceCourier New,-12,0,0,0,400,0,0,0,0,3,2,1,49Source_coloringThese settings control the colors used to identify source tokens. Thedefaults have been chosen to be easy to read and work well to isolatedifferent program areas. The coloring choices are made relative to thebuilt-in color models.If you attempt to set the same foreground and background color, then<strong>RealView</strong> <strong>Debugger</strong> uses the foreground color but uses the default colorfor the background.Table A-6 describes the settings.Table A-6 Source_coloring settingsNameFile_extensionsSchemeNumbers_textNumbers_bkgrndStrings_textStrings_bkgrndKeywords_textKeywords_bkgrndComments_textPropertiesThe standard C/C++ source coloring is auto-enabled based on fileextension. Use this to specify a comma-separated list of fileextensions that, when loaded, trigger source code coloring.The color scheme you want to use for source coloring. You can selectone of:• Default for the <strong>RealView</strong> <strong>Debugger</strong> v1.8 coloring scheme• VisualStudio for the Visual Studio coloring scheme• CodeWarrior for the CodeWarrior coloring scheme• RVD.1.7 for the <strong>RealView</strong> <strong>Debugger</strong> v1.7 coloring scheme.Use this to specify the foreground color for numbers displayed in theFile Editor pane.Use this to specify the background color for numbers displayed in theFile Editor pane.Use this to specify the foreground color for strings displayed in theFile Editor pane.Use this to specify the background color for strings displayed in theFile Editor pane.Use this to specify the foreground color for C/C++ keywordsdisplayed in the File Editor pane.Use this to specify the background color for C/C++ keywordsdisplayed in the File Editor pane.Use this to specify the foreground color for comments displayed inthe File Editor pane.A-10 Copyright © 2002-2005 <strong>ARM</strong> Limited. All rights reserved. <strong>ARM</strong> DUI 0153G
Workspace Settings ReferenceTable A-6 Source_coloring settings (continued)NameComments_bkgrndIdentifiers_textIdentifiers_bkgrnd<strong>User</strong>_text<strong>User</strong>_bkgrndPreprocessor_textPreprocessor_bkgrndOperator_textOperator_bkgrnd<strong>User</strong>_keywordsPropertiesUse this to specify the background color for comments displayed inthe File Editor pane.Use this to specify the foreground color for identifiers displayed inthe File Editor pane.Use this to specify the background color for identifiers displayed inthe File Editor pane.Use this to specify the foreground color for user-defined keywordsdisplayed in the File Editor pane.Use this to specify the background color for user-defined keywordsdisplayed in the File Editor pane.Use this to specify the foreground color for preprocessor keywords(#keyword) displayed in the File Editor pane.Use this to specify the background color for preprocessor keywords(#keyword) displayed in the File Editor pane.Use this to specify the foreground color for operators displayed in theFile Editor pane.Use this to specify the background color for operators displayed inthe File Editor pane.Use this to specify a list of user-defined keywords that are highlightedwhen they appear in the File Editor pane.A.3.2SearchSettings in this group control the searching behavior when working with source files inthe File Editor pane.These settings can be overridden dynamically using the menus and toggles in the FileEditor.<strong>ARM</strong> DUI 0153G Copyright © 2002-2005 <strong>ARM</strong> Limited. All rights reserved. A-11
Workspace Settings ReferenceTable A-7 describes these settings.Table A-7 Search settingsNameDirectionWrapSensitiveRegexpFailPropertiesUse this to specify the search direction. The default is to searchforwards, that is, from the top to the bottom of the file.Use this to specify search behavior when the end of file is reached.The default is to wrap during a search, that is, to search to the end ofthe file and then to start again at the top until the starting point isreached.Use this to specify whether uppercase and lowercase characters aretreated as identical in searches. By default, searches arecase-sensitive.When set to True, full grep-style regular expressions are used insearches. The default is False, not enabled.Use this to specify editor behavior when a search fails. Set to dialogby default, you can change this to flash.A.3.3EditSettings in this group control general editor behavior when working with source files inthe File Editor pane.These settings can be overridden dynamically using the menus and toggles in the FileEditor.The Edit group contains three third-level groups and a series of settings:BackupThese settings control the backup behavior when working with sourcefiles in the File Editor pane.A-12 Copyright © 2002-2005 <strong>ARM</strong> Limited. All rights reserved. <strong>ARM</strong> DUI 0153G
Workspace Settings ReferenceTable A-8 describes these settings.Table A-8 Backup settingsNameDisableBackup_dirBackup_extPropertiesBy default, a backup file is created when a file is edited. This providesa useful safety feature. Use this to disable this feature if required.By default, backup files are saved in the same directory as the originalfile. Use this to specify a pathname to a new location, for example tokeep all backup files in one special directory.By default, backup files are saved with the .bak extension appendedto the original filename.Tab_convSettings in this group control the display behavior when working withsource files in the File Editor pane. These settings are used to handle tabsand spaces.Tabs are permitted in files and are left untouched, by default. Use thesesettings to convert tabs to spaces when writing to the file, that is saving,and to convert spaces to tabs when reading the file.Spaces are not converted to tabs inside “ and “ quoting blocks on a line.Table A-9 describes these settings.Table A-9 Tab_conv settingsNameTabs_to_spacesSpaces_to_tabsTo_spaces_extTo_tabs_extPropertiesConverts tabs to spaces when the file is saved.Converts spaces to tabs when the file is read.Use this to specify file extensions where tab conversions take place.Specify a list separated by semi-colons (;)Use this to specify file extensions where space conversions takeplace. Specify a list separated by semi-colons (;).Src_ctrlSettings in this group control source control access tools when workingin the File Editor pane and in the debugger. The editor attempts to detectany source control system in use, where possible, but you might have tospecify it before <strong>RealView</strong> <strong>Debugger</strong> can use it.<strong>ARM</strong> DUI 0153G Copyright © 2002-2005 <strong>ARM</strong> Limited. All rights reserved. A-13
Workspace Settings ReferenceUse these settings to specify complete source control commands, and tooverride commands for known systems.The Src_ctrl group contains a low-level group and a series of settings:Cmds Use these to specify source control commands for use with<strong>RealView</strong> <strong>Debugger</strong>.Src_ctrl settingsUse these to specify the source control system to be used with<strong>RealView</strong> <strong>Debugger</strong> to control access to files.For full details on these settings see the chapter that describes versioncontrol in <strong>RealView</strong> <strong>Debugger</strong> v1.8 Project Management <strong>User</strong> <strong>Guide</strong>.EditSettings in this group configure editor behavior when working withsource files in the File Editor pane.Table A-10 describes these settings.Table A-10 Edit settingsNameDrag_drop_disViIndentUndoTabShiftLine_numberPropertiesUse this to disable drag-and-drop editing when working in the FileEditor pane.Not used.Use this to set indenting so that a specified number of spaces areinserted as you open a new line. By default, auto-indent inserts thesame number of spaces as on the previous line. If the previous line isa left curly bracket ({) the shift is increased. If the previous line is aright curly bracket (}), shift spaces are subtracted.Use this to specify the levels of undo and redo. By default, this is setto 64.Use this to specify the size of TAB settings when working in the FileEditor. By default, this is set to 8. Use a value between 1 and 16.Use this to specify the size of shift spaces as used in the Indent ruleand accessed through the Code window Edit menu options. Bydefault, this is set to 2. Use a value between 2 and 32.By default, line numbering is disabled in the debugger and the FileEditor. Use this to change the editor default to show line numbers atstart-up.A-14 Copyright © 2002-2005 <strong>ARM</strong> Limited. All rights reserved. <strong>ARM</strong> DUI 0153G
Workspace Settings ReferenceTable A-10 Edit settings (continued)NameNo_tooltipTimerTool_saveStartupTemplateRestore_statePropertiesBy default, tooltip evaluation of variables and registers is enabled.Change this setting to True to disable this feature.During file editing, the editor periodically checks to see if anothertool has edited or deleted the files being tested. A warning is shownif an update is detected.Use this to specify the number of seconds between checks. Thedefault is 60 seconds. Use values greater than 30 seconds. Set to -1 todisable this feature.When performing a build, you are prompted to resave any files thathave been edited. Use this to specify automatic resaving of changedfiles at build time to ensure that your latest sources are included. Youcan also set a no-save, no-ask value.The default start-up file, that is rvdebug.sav in your home directory,contains a list of previously edited files and information fromprevious debugging or editing sessions. This enables historicalinformation to be separated from your current session.Use this to specify a different start-up file, in a new location. Set thisto - (dash) to specify that no start-up file is used.During file editing, you can use templates to speed up codedevelopment. The template file contains templates that you can use oredit as required.By default, the file is named rvdebug.tpl and is saved in your homedirectory, or in the default settings directory \etc. Use this to changethis pathname.Not used.<strong>ARM</strong> DUI 0153G Copyright © 2002-2005 <strong>ARM</strong> Limited. All rights reserved. A-15
Workspace Settings ReferenceA-16 Copyright © 2002-2005 <strong>ARM</strong> Limited. All rights reserved. <strong>ARM</strong> DUI 0153G
Appendix B<strong>RealView</strong> <strong>Debugger</strong> on Sun Solaris and Red HatLinuxThis appendix provides supplementary information for developers using <strong>RealView</strong> ®<strong>Debugger</strong> on Sun Solaris and Red Hat Linux. It contains the following sections:• About this Appendix on page B-2• Getting more information on page B-3• X-Windows configuration change required on Sun Solaris on page B-4• Changes to target configuration details on page B-5• Changes to GUI and general user information on page B-7.<strong>ARM</strong> DUI 0153G Copyright © 2002-2005 <strong>ARM</strong> Limited. All rights reserved. B-1
<strong>RealView</strong> <strong>Debugger</strong> on Sun Solaris and Red Hat LinuxB.1 About this AppendixThis appendix describes features that are specific to using <strong>RealView</strong> <strong>Debugger</strong> v1.8 onSun Solaris and Red Hat Linux, and contains corrections and additions to thedocumentation suite. It covers:• <strong>RealView</strong> <strong>Debugger</strong> Essentials <strong>Guide</strong>• <strong>RealView</strong> <strong>Debugger</strong> <strong>User</strong> <strong>Guide</strong>• <strong>RealView</strong> <strong>Debugger</strong> Project Management <strong>User</strong> <strong>Guide</strong>• <strong>RealView</strong> <strong>Debugger</strong> Target Configuration <strong>Guide</strong>• <strong>RealView</strong> <strong>Debugger</strong> Command Line Reference <strong>Guide</strong>• <strong>RealView</strong> <strong>Debugger</strong> Extensions <strong>User</strong> <strong>Guide</strong>.B-2 Copyright © 2002-2005 <strong>ARM</strong> Limited. All rights reserved. <strong>ARM</strong> DUI 0153G
<strong>RealView</strong> <strong>Debugger</strong> on Sun Solaris and Red Hat LinuxB.2 Getting more informationThis section describes how to get more information on <strong>RealView</strong> <strong>Debugger</strong>:• Online resources• Feedback on <strong>RealView</strong> <strong>Debugger</strong>.B.2.1Online resources<strong>ARM</strong> ® Limited provides a range of services to support developers using <strong>RealView</strong><strong>Debugger</strong>. Among the downloads available are:• enhanced support for different hardware platforms through technical informationand board description files• product Release Notes• updates to documentation• Frequently Asked Questions.You can access these resources from the <strong>ARM</strong> web site at http://www.arm.com.B.2.2Feedback on <strong>RealView</strong> <strong>Debugger</strong>If you have any problems with <strong>RealView</strong> <strong>Debugger</strong>, submit a Software Problem Report(SPR):1. Select Help → Send a Problem Report... from the <strong>RealView</strong> <strong>Debugger</strong> mainmenu.2. Complete all sections of the Software Problem Report.3. To get a rapid and useful response, give:• a small standalone sample of code that reproduces the problem, ifapplicable• a clear explanation of what you expected to happen, and what actuallyhappened• the commands you used, including any command-line options• sample output illustrating the problem.4. Email the report to your supplier.<strong>ARM</strong> DUI 0153G Copyright © 2002-2005 <strong>ARM</strong> Limited. All rights reserved. B-3
<strong>RealView</strong> <strong>Debugger</strong> on Sun Solaris and Red Hat LinuxB.3 X-Windows configuration change required on Sun SolarisIf you are using <strong>RealView</strong> <strong>Debugger</strong> on Sun Solaris, you must modify the X-Windowsconfiguration file (.Xdefaults) located in your $HOME directory. The file must contain thefollowing line:Dtwm*secondariesOnTop: TrueThe case is important so enter the line exactly as shown. If the .Xdefaults file does notexist then you must create it.If you do not do this, then when you change focus from a floating pane to the Codewindow, the floating pane is hidden behind the Code window.B-4 Copyright © 2002-2005 <strong>ARM</strong> Limited. All rights reserved. <strong>ARM</strong> DUI 0153G
<strong>RealView</strong> <strong>Debugger</strong> on Sun Solaris and Red Hat LinuxB.4 Changes to target configuration detailsThis section describes additions to <strong>RealView</strong> <strong>Debugger</strong> v1.8 Target Configuration<strong>Guide</strong>:• Default configuration files• Target configuration entries.B.4.1Default configuration filesBecause you are using <strong>RealView</strong> Connection Broker connections to <strong>RealView</strong><strong>ARM</strong>ulator ® ISS (RVISS), the RDI configuration files, described in the documentationsuite, are not installed when running <strong>RealView</strong> <strong>Debugger</strong> on Sun Solaris or Red HatLinux, for example *.rbe or *.cnf files. Other configuration files are installed in:install_directory/RVD/Core/.../solaris-sparc/etc (Sun Solaris)install_directory/RVD/Core/.../linux-pentium/etc (Red Hat Linux)These files are:• board file, for example rvdebug.brd• JTAG files, for example arm.jtg• Board/Chip definition files, for example CM940T.bcd.For full details on these files and the settings they contain, see the chapter that describesconfiguring custom targets in <strong>RealView</strong> <strong>Debugger</strong> v1.8 Target Configuration <strong>Guide</strong>.B.4.2Target configuration entries<strong>RealView</strong> Connection Broker enables you to connect to local or remote simulators, suchas RVISS. You can also connect to local or remote On-Chip Debugging (OCD) basedemulators such as Multi-ICE ® direct connect.This means that target configuration entries related to remote connections are fullysupported by <strong>RealView</strong> <strong>Debugger</strong>, for example the Remote group, shown in Figure B-1on page B-6.<strong>ARM</strong> DUI 0153G Copyright © 2002-2005 <strong>ARM</strong> Limited. All rights reserved. B-5
<strong>RealView</strong> <strong>Debugger</strong> on Sun Solaris and Red Hat LinuxFigure B-1 Remote entries in the Connection Properties windowSee the chapter that describes working with remote targets in <strong>RealView</strong> <strong>Debugger</strong> v1.8Target Configuration <strong>Guide</strong> for details on how to make connections using these settings.Using the DSPThe DSP support in <strong>RealView</strong> <strong>Debugger</strong> is invoked by connecting the debugger to aDSP processor. Developers working on Sun Solaris or Red Hat Linux can connect to asimulated target on a remote workstation or connect to target hardware using Multi-ICEdirect connect or <strong>RealView</strong> ICE. See the chapter that describes working with remotetargets in <strong>RealView</strong> <strong>Debugger</strong> v1.8 Target Configuration <strong>Guide</strong> for details.Note<strong>RealView</strong> <strong>Debugger</strong> DSP support is a separately licensed component. See the chapterthat describes DSP support in <strong>RealView</strong> <strong>Debugger</strong> v1.8 Extensions <strong>User</strong> <strong>Guide</strong> for fulldetails on using this extension.B-6 Copyright © 2002-2005 <strong>ARM</strong> Limited. All rights reserved. <strong>ARM</strong> DUI 0153G
<strong>RealView</strong> <strong>Debugger</strong> on Sun Solaris and Red Hat LinuxB.5 Changes to GUI and general user informationThis section describes:• Getting started with <strong>RealView</strong> <strong>Debugger</strong>• Column resizing on page B-8• Saving favorites on page B-10• Changes to the desktop on page B-10• <strong>RealView</strong> <strong>Debugger</strong> examples on page B-11.B.5.1Getting started with <strong>RealView</strong> <strong>Debugger</strong>The <strong>RealView</strong> <strong>Debugger</strong> Control Panel, RVDEBUGCP, provides access to the debugger fordevelopers using Sun Solaris and Red Hat Linux. Start the debugger to see this window,shown in Figure B-2.Figure B-2 <strong>RealView</strong> <strong>Debugger</strong> Control PanelBy default, launching the Control Panel starts <strong>RealView</strong> <strong>Debugger</strong> without a splashscreen.Click on the rvdebug icon to access startup options for <strong>RealView</strong> <strong>Debugger</strong>:• Double-click on this icon to start the debugger in default mode and display theCode window.• Left-click on this icon to specify arguments when using the command-linemethod of starting <strong>RealView</strong> <strong>Debugger</strong>:Start With Arguments...Displays a dialog box where you can specify startup options, forexample to specify a workspace to use in this session or to write to alog file.<strong>ARM</strong> DUI 0153G Copyright © 2002-2005 <strong>ARM</strong> Limited. All rights reserved. B-7
<strong>RealView</strong> <strong>Debugger</strong> on Sun Solaris and Red Hat LinuxSet Default Arguments...Displays the Tools Attributes dialog box where you can specify thestart directory and arguments for running <strong>RealView</strong> <strong>Debugger</strong>. If youset these, they are used each time the debugger runs from the ControlPanel.You can also start <strong>RealView</strong> <strong>Debugger</strong> from the command line with the rvdebugcommand. See Starting from the command line on page 1-2 for details of startup optionsand command-line arguments.NoteIf you are using Sun Solaris or Red Hat Linux, you can use the -cmd argument to startthe command-line debugger, for example rvdebug -cmd.B.5.2Column resizingWhen using the Code window, the following panes use two columns to display debugdata:• Call Stack• Break/Tracepoints• Watch• Process Control.To make the display easier to read, you can change the size of the first column using anew menu option available only on Sun Solaris and Red Hat Linux:1. Select Target → Reload Image to Target to reload the image dhrystone.axf.2. Click on the Src tab to view the source file dhry_1.c.3. Set a default breakpoint by double-clicking on line 183.4. Click Run to start execution.5. Enter 5000 when asked for the number of runs.The program starts and then stops when execution reaches the breakpoint at line183. The red box marks the location of the Program Counter (PC) when executionstops.6. If you do not have a Watch pane visible, select View → Watch to display theWatch pane.7. Right-click somewhere in the header columns to display the context menu, shownin Figure B-3 on page B-9.B-8 Copyright © 2002-2005 <strong>ARM</strong> Limited. All rights reserved. <strong>ARM</strong> DUI 0153G
<strong>RealView</strong> <strong>Debugger</strong> on Sun Solaris and Red Hat LinuxFigure B-3 Column resizing in the Watch pane8. Select the option Set Width Of Column 1 to display the prompt box where youcan specify the size you want, shown in Figure B-4.Figure B-4 Column resizing prompt boxWhen the prompt box first appears, it contains the current setting. Enter a valuebetween 1 and 128.9. Click Set to confirm the new setting. Click Cancel to leave the size unchanged.If you change the size of a column, it holds for all windows in the current session.Default sizes are restored at each start up.You cannot change the size of columns in the following panes:• Register• Stack• Symbol Browser• Memory.If you resize columns be aware of the following:• You can only resize the first column in any two-column display.• Columns can only be adjusted to within one monospaced character position.• The second column is automatically set to accommodate the longest item.• Changing the column size applies to all tabs in a multitab display, that is theWatch, Call Stack, and Process Control panes.<strong>ARM</strong> DUI 0153G Copyright © 2002-2005 <strong>ARM</strong> Limited. All rights reserved. B-9
<strong>RealView</strong> <strong>Debugger</strong> on Sun Solaris and Red Hat LinuxB.5.3Saving favoritesBe aware of the following when working on Sun Solaris or Red Hat Linux:• The history file, exphist.sav, is only created if you create and save a favorite, forexample a breakpoint or watchpoint.• The history file is not controlled in the same way when you access an Open...dialog.When the file has been created and saved, it is updated at the end of each debuggingsession in the usual way.B.5.4Changes to the desktopThis section summarizes differences when using the <strong>RealView</strong> <strong>Debugger</strong> desktop onSun Solaris or Red Hat Linux.Code windowBe aware of the following when working in the Code window:• Code windows are identified by a title bar. This changes as you open newwindows, for example RVDEBUG, RVDEBUG_1, RVDEBUG_2.• The Code window title bar identifies the vehicle you are using to make theconnection and the connection number. However, the target processor is notshown.• The Code window includes a Color Box to identify the connection associatedwith the window. Other windows, such as the Resource Viewer, do not include aColor Box to identify the calling Code window.• Tooltips are not available if you hover the mouse cursor over a toolbar button.However, a button description is displayed in the Status line.• The pane name is not displayed if you hover the mouse cursor over the paneReposition control.• The editing control called Tooltip Evaluation that provides hover-styleevaluation in different code views is not available.• Select Help → About... from the <strong>RealView</strong> <strong>Debugger</strong> main menu to display theAbout Box <strong>Information</strong> dialog. This also enables you to submit a SoftwareProblem Report.B-10 Copyright © 2002-2005 <strong>ARM</strong> Limited. All rights reserved. <strong>ARM</strong> DUI 0153G
<strong>RealView</strong> <strong>Debugger</strong> on Sun Solaris and Red Hat Linux• Developers working on Red Hat Linux must use the keyboard shortcutCtrl+Shift+F10 to step over functions (see Using shortcuts on page 3-9).B.5.5<strong>RealView</strong> <strong>Debugger</strong> examplesBe aware of the following when working on Sun Solaris or Red Hat Linux.Depending on your installation, the <strong>RealView</strong> <strong>Debugger</strong> examples for developingapplications on <strong>ARM</strong> targets, are installed in the examples directory in:install_directory/RVDS/Examples/...The dhrystone example project, and the executable built by this project, are used in thedocumentation suite.See the tutorial in <strong>RealView</strong> <strong>Debugger</strong> v1.8 Essentials <strong>Guide</strong> for more details onbuilding this example project.This location is also used, by default, if you choose a Custom installation and specifythat the <strong>RealView</strong> <strong>Debugger</strong> examples are installed.Tools support examplesIf you choose a Custom installation to install <strong>RealView</strong> <strong>Debugger</strong> Tools support forCEVA-Oak and CEVA-TeakLite, DSP examples are installed in the examples directory:install_directory/RVD/Tools/Oak-Teaklite/.../demo_DSPG<strong>ARM</strong> DUI 0153G Copyright © 2002-2005 <strong>ARM</strong> Limited. All rights reserved. B-11
<strong>RealView</strong> <strong>Debugger</strong> on Sun Solaris and Red Hat LinuxB-12 Copyright © 2002-2005 <strong>ARM</strong> Limited. All rights reserved. <strong>ARM</strong> DUI 0153G
GlossaryThe items in this glossary are listed in alphabetical order, with any symbols andnumerics appearing at the end.Access-provider connectionA debug target connection item that can connect to one or more target processors. Theterm is normally used when describing the <strong>RealView</strong> <strong>Debugger</strong> Connection Controlwindow.Address breakpointA type of breakpoint.See also Breakpoint.ADSAngelSee <strong>ARM</strong> Developer Suite.Angel is a software debug monitor that runs on the target and enables you to debugapplications running on <strong>ARM</strong> architecture-based hardware. Angel is commonly usedwhere a JTAG emulator is not available.<strong>ARM</strong> Developer Suite (ADS)A suite of software development applications, together with supporting documentationand examples, that enable you to write and debug applications for the <strong>ARM</strong> family ofRISC processors. ADS is superseded by <strong>RealView</strong> Developer Suite (RVDS).See also <strong>RealView</strong> Developer Suite.<strong>ARM</strong> DUI 0153G Copyright © 2002-2005 <strong>ARM</strong> Limited. All rights reserved. Glossary-1
Glossary<strong>ARM</strong> instruction<strong>ARM</strong> stateA word that encodes an operation for an <strong>ARM</strong> processor operating in <strong>ARM</strong> state. <strong>ARM</strong>instructions must be word-aligned.A processor that is executing <strong>ARM</strong> instructions is operating in <strong>ARM</strong> state. Theprocessor switches to Thumb state (and to recognizing Thumb instructions) whendirected to do so by a state-changing instruction such as BX, BLX.See also Thumb state.BacktracingBig-endianSee Call Stack.Memory organization where the least significant byte of a word is at the highest addressand the most significant byte is at the lowest address in the word.See also Little-endian.BoardBoard fileBreakpoint<strong>RealView</strong> <strong>Debugger</strong> uses the term board to refer to a target processor, memory,peripherals, and debugger connection method.The board file is the top-level configuration file, normally called rvdebug.brd, thatreferences one or more other files.A user defined point at which execution stops in order that a debugger can examine thestate of memory and registers.See also Conditional breakpoint, Default breakpoint, Hardware breakpoint, Softwarebreakpoint, and Unconditional breakpoint.Call StackThis is a list of procedure or function call instances on the current program stack. Itmight also include information about call parameters and local variables for eachinstance.Conditional breakpointA breakpoint that has a condition qualifier assigned, and so halts execution when thatcondition becomes True. The condition normally references the values of programvariables that are in scope at the breakpoint location.See also Breakpoint, Default breakpoint, Hardware breakpoint, Software breakpoint,and Unconditional breakpoint.Context menuCore moduleSee Pop-up menu.In the context of Integrator, an add-on development board that contains an <strong>ARM</strong>processor and local memory. Core modules can run stand-alone, or can be stacked ontoIntegrator motherboards.See also Integrator.Glossary-2 Copyright © 2002-2005 <strong>ARM</strong> Limited. All rights reserved. <strong>ARM</strong> DUI 0153G
GlossaryCurrent Program Status Register (CPSR)See Program Status Register.DCCDebug Agent (DA)See Debug Communications Channel.The Debug Agent resides on the target to provide target-side support for RunningSystem Debug (RSD). The Debug Agent can be a thread or built into the RTOS. TheDebug Agent and <strong>RealView</strong> <strong>Debugger</strong> communicate with each other using the debugcommunications channel (DCC). This enables data to be passed between the debuggerand the target using the ICE interface, without stopping the program or entering debugstate.See also Running System Debug.Debug Communications Channel (DCC)A debug communications channel enables data to be passed between <strong>RealView</strong><strong>Debugger</strong> and the EmbeddedICE logic on the target using the JTAG interface, withoutstopping the program flow or entering debug state.Debug With Arbitrary Record Format (DWARF)<strong>ARM</strong> code generation tools generate debug information in DWARF2 format by default.From RVCT v2.2, you can optionally generate DWARF3 format (Draft Standard 9).Default breakpointA breakpoint that does not have a condition qualifier or an action assigned. A defaultbreakpoint is always an unconditional breakpoint.See also Breakpoint, Conditional breakpoint, Hardware breakpoint, Softwarebreakpoint, and Unconditional breakpoint.DeprecatedA deprecated option or feature is one that you are strongly discouraged from using.Deprecated options and features are to be removed in future versions of the product.Digital Signal Processor (DSP)DSPs are special processors designed to execute repetitive, maths-intensive algorithms.Embedded applications might use both <strong>ARM</strong> processor cores and DSPs.DoublewordDSPDWARFELFA 64-bit unit of information.See Digital Signal Processor.See Debug With Arbitrary Record Format.Executable and Linking Format. <strong>ARM</strong> code generation tools produce objects andexecutable images in ELF format.<strong>ARM</strong> DUI 0153G Copyright © 2002-2005 <strong>ARM</strong> Limited. All rights reserved. Glossary-3
GlossaryEmbedded Trace Macrocell (ETM)A block of logic, embedded in the hardware, that is connected to the address, data, andstatus signals of the processor. It broadcasts branch addresses, and data and statusinformation in a compressed protocol through the trace port. It contains the resourcesused to trigger and filter the trace output.EmbeddedICE logicThe EmbeddedICE logic is an on-chip logic block that provides TAP-based debugsupport for <strong>ARM</strong> processor cores. It is accessed through the TAP controller on the <strong>ARM</strong>core using the JTAG interface.See also IEEE1149.1.EmulatorEndpoint connectionETMETVIn the context of target connection hardware, an emulator provides an interface to thepins of a real core (emulating the pins to the external world) and enables you to controlor manipulate signals on those pins.A debug target processor, normally accessed through an access-provider connection.See Embedded Trace Macrocell.See Extended Target Visibility.Extended Target Visibility (ETV)Extended Target Visibility enables <strong>RealView</strong> <strong>Debugger</strong> to access features of theunderlying target, such as chip-level details provided by the hardware manufacturer orSoC designer.Floating Point Emulator (FPE)Software that emulates the action of a hardware unit dedicated to performing arithmeticoperations on floating-point values.FPEHalfwordSee Floating Point Emulator.A 16-bit unit of information.Halted System Debug (HSD)Usually used for RTOS aware debugging, Halted System Debug (HSD) means that youcan only debug a target when it is not running. This means that you must stop yourdebug target before carrying out any analysis of your system. With the target stopped,the debugger presents RTOS information to you by reading and interpreting targetmemory.See also Running System Debug.Glossary-4 Copyright © 2002-2005 <strong>ARM</strong> Limited. All rights reserved. <strong>ARM</strong> DUI 0153G
GlossaryHardware breakpointA breakpoint that is implemented using non-intrusive additional hardware. Hardwarebreakpoints are the only method of halting execution when the location is in Read OnlyMemory (ROM). Using a hardware breakpoint often results in the processor haltingcompletely. This is usually undesirable for a real-time system.See also Breakpoint, Conditional breakpoint, Default breakpoint, Software breakpoint,and Unconditional breakpoint.HSDIEEE 1149.1See Halted System Debug.The IEEE Standard that defines TAP. Commonly (but incorrectly) referred to as JTAG.See also Test Access PortIntegratorA range of <strong>ARM</strong> hardware development platforms. Core modules are available thatcontain the processor and local memory.Joint Test Action Group (JTAG)An IEEE group focussed on silicon chip testing methods. Many debug andprogramming tools use a Joint Test Action Group (JTAG) interface port to communicatewith processors. For more information see IEEE Standard, Test Access Port andBoundary-Scan Architecture specification 1149.1 (JTAG).JTAGJTAG interface unitLittle-endianSee Joint Test Action Group.A protocol converter that converts low-level commands from <strong>RealView</strong> <strong>Debugger</strong> intoJTAG signals to the processor, for example to the EmbeddedICE logic and the ETM.Memory organization where the least significant byte of a word is at the lowest addressand the most significant byte is at the highest address of the word.See also Big-endian.Multi-ICEPop-up menuProcessor coreProfilingA JTAG-based tool for debugging embedded systems.Also known as Context menu. A menu that is displayed temporarily, offering itemsrelevant to your current situation. Obtainable in most <strong>RealView</strong> <strong>Debugger</strong> windows orpanes by right-clicking with the mouse pointer inside the window. In some windows thepop-up menu can vary according to the line the mouse pointer is on and the tabbed pagethat is currently selected.The part of a microprocessor that reads instructions from memory and executes them,including the instruction fetch unit, arithmetic and logic unit and the register bank. Itexcludes optional coprocessors, caches, and the memory management unit.Accumulation of statistics during execution of a program being debugged, to measureperformance or to determine critical areas of code.<strong>ARM</strong> DUI 0153G Copyright © 2002-2005 <strong>ARM</strong> Limited. All rights reserved. Glossary-5
GlossaryProgram Status Register (PSR)Contains information about the current execution context. It is also referred to as theCurrent PSR (CPSR), to emphasize the distinction between it and the Saved PSR(SPSR), which records information about an alternate processor mode.PSRRDISee Program Status Register.See Remote Debug Interface.<strong>RealView</strong> <strong>ARM</strong>ulator ISS (RVISS)The most recent version of the <strong>ARM</strong> simulator, <strong>RealView</strong> <strong>ARM</strong>ulator ISS is suppliedwith <strong>RealView</strong> Developer Suite. It communicates with a debug target using RV-msg,through the <strong>RealView</strong> Connection Broker interface, and RDI.See also RDI and <strong>RealView</strong> Connection Broker.<strong>RealView</strong> Compilation Tools (RVCT)<strong>RealView</strong> Compilation Tools is a suite of tools, together with supporting documentationand examples, that enables you to write and build applications for the <strong>ARM</strong> family ofRISC processors.<strong>RealView</strong> Connection Broker<strong>RealView</strong> Connection Broker is an execution vehicle that enables you to connect tosimulator targets on your local system, or on a remote system. It also enables you tomake multiple connections to the simulator.See also <strong>RealView</strong> <strong>ARM</strong>ulator ISS.<strong>RealView</strong> <strong>Debugger</strong> TracePart of the <strong>RealView</strong> <strong>Debugger</strong> product that extends the debugging capability with theaddition of real-time program and data tracing. It is available from the Code window.<strong>RealView</strong> ICE (RVI)A JTAG-based debug solution to debug software running on <strong>ARM</strong> processors.Remote Debug Interface (RDI)The Remote Debug Interface (RDI) is an <strong>ARM</strong> standard procedural interface betweena debugger and the debug agent. RDI gives the debugger a uniform way to communicatewith:• a simulator running on the host (for example, RVISS)• a debug monitor running on hardware that is based on an <strong>ARM</strong> core accessedthrough a communication link (for example, Angel)• a debug agent controlling an <strong>ARM</strong> processor through hardware debug support(for example, <strong>RealView</strong> ICE or Multi-ICE).Remote_ARemote_A is a software protocol converter and configuration interface. It convertsbetween the RDI 1.5 software interface of a debugger and the Angel Debug Protocolused by Angel targets. It can communicate over a serial or Ethernet interface.Glossary-6 Copyright © 2002-2005 <strong>ARM</strong> Limited. All rights reserved. <strong>ARM</strong> DUI 0153G
GlossaryRSDRTOSSee Running System Debug.Real Time Operating System.Running System Debug (RSD)Used for RTOS aware debugging, Running System Debug (RSD) means that you candebug a target when it is running. This means that you do not have to stop your debugtarget before carrying out any analysis of your system. RSD gives access to theapplication using a Debug Agent (DA) that resides on the target. The Debug Agent isscheduled along with other tasks in the system.See also Debug Agent and Halted System Debug.RVCTRVISSScan chainScopeScriptSemihostingSimulatorSoftware breakpointSee <strong>RealView</strong> Compilation Tools.See <strong>RealView</strong> <strong>ARM</strong>ulator ISS.A scan chain is made up of serially-connected devices that implement boundary-scantechnology using a standard JTAG TAP interface. Each device contains at least one TAPcontroller containing shift registers that form the chain. Processors might containseveral shift registers to enable you to access selected parts of the device.The range within which it is valid to access such items as a variable or a function.A file specifying a sequence of debugger commands that you can submit to thecommand-line interface using the include command.A mechanism whereby I/O requests made in the application code are communicated tothe host system, rather than being executed on the target.A simulator executes non-native instructions in software (simulating a core).A breakpoint that is implemented by replacing an instruction in memory with one thatcauses the processor to take exceptional action. Because instruction memory must bealtered software breakpoints cannot be used where instructions are stored in read-onlymemory. Using software breakpoints can enable interrupt processing to continue duringthe breakpoint, making them more suitable for use in real-time systems.See also Breakpoint, Conditional breakpoint, Default breakpoint, Hardware breakpoint,and Unconditional breakpoint.Software Interrupt (SWI)An instruction that causes the processor to call a programmer-specified subroutine.Used by the <strong>ARM</strong> standard C library to handle semihosting.SPSRSaved Program Status Register.See also Program Status Register.<strong>ARM</strong> DUI 0153G Copyright © 2002-2005 <strong>ARM</strong> Limited. All rights reserved. Glossary-7
GlossarySWITargetTarget vehicleSee Software Interrupt.The target hardware, including processor, memory, and peripherals, real or simulated,on which the target application is running.Target vehicles provide <strong>RealView</strong> <strong>Debugger</strong> with a standard interface to disparatetargets so that the debugger can connect easily to new target types without having tomake changes to the debugger core software.Target Vehicle Server (TVS)Essentially the debugger itself, this contains the basic debugging functionality. TVScontains the run control, base multitasking support, much of the command handling,and target knowledge, such as memory mapping, lists, rule processing, board file and.bcd files, and data structures to track the target environment.Thumb instructionThumb stateOne halfword or two halfwords that encode an operation for an <strong>ARM</strong> processoroperating in Thumb state. Thumb instructions must be halfword-aligned.A processor that is executing Thumb instructions is operating in Thumb state. Theprocessor switches to <strong>ARM</strong> state (and to recognizing <strong>ARM</strong> instructions) when directedto do so by a state-changing instruction such as BX, BLX.See also <strong>ARM</strong> state.TracepointTracingTriggerA tracepoint can be a line of source code, a line of assembly code, or a memory address.In <strong>RealView</strong> <strong>Debugger</strong>, you can set a variety of tracepoints to determine exactly whatprogram information is traced.The real-time recording of processor activity (including instructions and data accesses)that occurs during program execution. Trace information can be stored either in a tracebuffer of a processor, or in an external trace hardware unit. Captured trace informationis returned to the Analysis window in <strong>RealView</strong> <strong>Debugger</strong> where it can be analyzed tohelp identify a defect in program code.In the context of breakpoints, a trigger is the action of noticing that the breakpoint hasbeen reached by the target and that any associated conditions are met.In the context of tracing, a trigger is an event that instructs the debugger to stopcollecting trace and display the trace information around the trigger position, withouthalting the processor. The exact information that is displayed depends on the positionof the trigger within the buffer.TVSSee Target Vehicle Server.Glossary-8 Copyright © 2002-2005 <strong>ARM</strong> Limited. All rights reserved. <strong>ARM</strong> DUI 0153G
GlossaryUnconditional breakpointA breakpoint that does not have a conditional qualifier assigned, and so always haltsexecution.See also Breakpoint, Conditional breakpoint, Default breakpoint, Hardware breakpoint,and Software breakpoint.Vector Floating Point (VFP)A standard for floating-point coprocessors where several data values can be processedby a single instruction.VFPWatchWatchpointWordSee Vector Floating Point.A watch is a variable or expression that you require the debugger to display at every stepor breakpoint so that you can see how its value changes. The Watch pane is part of the<strong>RealView</strong> <strong>Debugger</strong> Code window that displays the watchpoints you have defined.In <strong>RealView</strong> <strong>Debugger</strong>, this is a hardware breakpoint.A 32-bit unit of information.<strong>ARM</strong> DUI 0153G Copyright © 2002-2005 <strong>ARM</strong> Limited. All rights reserved. Glossary-9
GlossaryGlossary-10 Copyright © 2002-2005 <strong>ARM</strong> Limited. All rights reserved. <strong>ARM</strong> DUI 0153G
IndexAAbout this book xActionsspecifying for breakpoints 4-53using with condition qualifiers 4-59Address rangesspecifying 4-7Add/Copy/Edit Memory Mapdialog 5-5Add/Edit Macrosdialog 9-8Audience, intended xAuto-projectschanging settings 2-15closing 2-17creating for images 2-13displaying settings 2-14in the Process Control pane 2-12,2-13see also Projectsproperties 2-13, 2-14saving settings 2-16Autoscope 3-3in assembly language 3-3red box 3-3BBanksof registers 6-9, 6-10BCD filememory map configuration 5-2Board file 2-2Book, about this xBreakpoint units 4-10in Break/Tracepoints pane 4-10Breakpoints 4-2Access 4-65actions 4-53, 4-59and memory mapping 4-9and stepping 4-3attaching macros 4-56BREAKEXECUTION command 4-65BREAKINSTRUCTION command 4-65breakpoint types 4-2breakpoint units 4-10chaining 4-13class 4-43clearing 4-72, 4-73clearing all 4-20, 4-73clearing quickly 4-11condition qualifiers 4-52, 4-59conditional 4-5, 4-59controlling behavior 4-52, 4-59copying in the Break/Tracepointspane 4-69creating a favorite 4-76Debug menu mappings 4-70default 4-4, 4-5deleting 4-73deleting all 4-73disable at cursor 4-20disabling 4-72editing in the Break/Tracepointspane 4-69enable at cursor 4-20EXEC 4-65<strong>ARM</strong> DUI 0153G Copyright © 2002-2005 <strong>ARM</strong> Limited. All rights reserved. Index-1
Indexfunction entry point 4-8hardware 4-3, 4-13, 4-17, 4-24hardware limitations 4-13hardware support in a DSP 4-48,4-49, 4-50icons 4-10in the Break/Tracepoints pane 4-63,4-65INSTR 4-65line number references 4-7managing actions 4-53, 4-54managing qualifiers 4-52markers 4-10, 4-65mode tests 4-13module name references 4-7operations 4-20pass counts 4-13, 4-36, 4-48, 4-49,4-52Processor exceptions 4-33qualifiers 4-34Read 4-65recording the triggering of 4-6red disc 4-16red icon 4-10removing 4-73removing all 4-73saving as favorites 4-76, 4-77saving as history 4-75see also Chaining breakpointssetting hardware breakpoints for aDSP 4-49setting hardware tests 4-48setting in disassembly-level view4-17setting in other ways 4-19, 4-39setting in source-level view 4-16setting in the Memory pane 4-22,4-39setting in the Stack pane 4-22, 4-39setting on a branch 4-18setting on a function 4-17setting on a symbol 4-17setting on an instruction 4-18setting on inline functions 4-10setting on multiple statements 4-10setting on the statement 4-16setting using drag-and-drop 4-19,4-39size tests 4-13software 4-3, 4-13, 4-17standard 4-10, 4-43toggle at cursor 4-20unconditional 4-4using a mask 4-50using a range 4-50using hardware breakpoints 4-46viewing in disassembly-level view4-10viewing in source-level view 4-10watchpoints 4-13Write 4-65yellow icon 4-10@entry location specifier 4-8Browsersaccessing 8-2applying a filter 8-7, 8-28browsing C++ classes 8-17browsing functions 8-19browsing variables 8-21Data Navigator pane 8-5filter metacharacters 8-7, 8-28Function List 8-19in <strong>RealView</strong> debugger 8-2Module/File List 8-23Register List 8-25scope 8-2Symbol Browser pane 8-17using filters 8-27Variable List 8-17, 8-21CCall Stack 6-36see also StackCancel buttonin the Code window 3-2Chaining breakpoints 4-30command qualifiers 4-31converting existing breakpoints4-31Channel viewers 6-17Code patchingassembly patching 7-3Code views 2-10, 2-23, 3-3Dsm tab 2-10, 2-23, 3-3setting disassembly mode 3-5source code tab 2-10, 2-23, 3-3Src tab 2-10, 2-23, 3-3toggling 3-13Code windowon Red Hat Linux B-10on Sun Solaris B-10Colorsin memory map 5-8in Memory pane 6-24in Register pane 6-4Column resizingRed Hat Linux B-8Sun Solaris B-8Command linearguments for <strong>RealView</strong> ConnectionBroker 1-9arguments for <strong>RealView</strong> <strong>Debugger</strong>1-3starting <strong>RealView</strong> ConnectionBroker 1-9starting <strong>RealView</strong> Network Broker1-9Command line arguments-aws 1-3-bat 1-3-cmd 1-3-exec 1-3-home 1-4-inc 1-4-init 1-4-install 1-4, 1-9-jou 1-4-log 1-5-nologo 1-5-s 1-5-user 1-9-user 1-5, 1-9Commandsin a journal file 3-15logging 3-18logging from your application 3-15pending 3-2purging 3-2queue 3-2queue rules 3-2to the debugger 3-15Comments from users xvConditional breakpoints 4-5Connecting 2-2Connection Broker 1-8Index-2 Copyright © 2002-2005 <strong>ARM</strong> Limited. All rights reserved. <strong>ARM</strong> DUI 0153G
Indexlocal host connection 1-8remote host connection 1-10shut down in remote mode 1-10Contextcontrols 6-34see also ScopeControl Panelon Red Hat Linux B-7on Sun Solaris B-7Customizingregisters 6-18Cyclesin Register pane 6-11<strong>RealView</strong> <strong>ARM</strong>ulator ISS 6-11,6-14C++browsing classes 8-17classes in the Symbol Browser 8-18finding a class definition 8-18viewing classes 8-18DDADebug Agent 4-12Data Navigator pane 8-5filtering 8-6Data valuessaving as favorites 6-48DCC 6-17DCC semihosting 6-17enabling 6-17Debug Agent 4-12Debug communications channel 6-17Debug menu 3-11Debug targetconfiguration 2-2connecting 2-2Connection Broker 1-8memory mapping 5-2, 5-7, 5-8resetting processor 2-22, 3-11<strong>Debugger</strong>defining in workspace 10-16internal variables 6-11internals 6-11, 6-12, 6-14internals in <strong>RealView</strong> <strong>ARM</strong>ulatorISS 6-11, 6-14statistics 6-11, 6-14Default breakpoints 4-4overview 4-5Dialog boxAdd/Copy/Edit Memory Map 5-5Add/Edit Macros 9-8Favorites Chooser/Editor 8-29Fill Memory with Pattern 7-17Find in Files 8-18Flash Memory Control 7-7, 7-8Function List 8-19HW Break if in Range 4-24HW Break if X, then if Y 4-27HW Break on Data Value match4-29HW While in func/range, Break if X4-26Interactive Memory Setting 7-10Interactive Register Setting 7-13Load File to Target 2-3Module/File List 8-23, 8-24, 8-26New/Edit Favorite 4-77Register List 8-25Select File to Include Commandsfrom 3-18Select File to Journal to 3-15Select File to log the STDIO to 3-15Select File to Log to 3-15Simple Break if X 4-21Upload/Download file from/toMemory 7-14, 7-19Variable List 8-21Digital Signal Processorsee DSPDirectoriesexamples 1-12Flash examples 1-12home 1-11, 1-12home and the user ID 1-11home and the Windows login ID1-12installation 1-11used in <strong>RealView</strong> <strong>Debugger</strong> 1-11DSPassembly patching 7-3breakpoint support 4-48disassembly format A-4linker command file 5-14memory map 5-7Patch Assembly... option 7-3Estack addresses 6-32Environment variablesJOULOG_UNBUF 3-18RVDEBUG_HOME 1-7RVDEBUG_SHARE 1-7EXEChardware breakpoints 4-65in Break/Tracepoints pane 4-65Execution controls 3-7submitting commands 3-2using shortcuts 3-9Expression pointer 6-34FFavoritesbreakpoint 4-75, 4-76categories 8-30, 8-32data value 6-48list 8-31managing 8-29watch 6-46Favorites Category 8-32Favorites Chooser/Editor dialog boxcategories 8-32components 8-30displaying 8-30overview 8-29Favorites List 8-31Feedback xvFilesboard file 2-2including from the Debug menu3-18*.apr 2-12*.aws 10-2, 10-10*.brd 2-2*.ini 10-2, 10-9, 10-13*.prj 2-12*.sav 4-75, 4-76, 4-78, 6-46, 6-48,8-29Fill Memory with Patterndialog 7-17Filtering<strong>ARM</strong> DUI 0153G Copyright © 2002-2005 <strong>ARM</strong> Limited. All rights reserved. Index-3
Indexfunctions 8-6metacharacters 8-7module naming conventions 4-7modules 8-6syntax rules for 8-6variables 8-6Find in FilesC++ Class definition 8-18dialog 8-18Flashdirectories 1-12examples 1-12see also FME filessetting interactively 7-5Flash Memory Controldialog 7-7, 7-8Flash MEthod files 7-5FME files 7-5Force scope 3-4Frame pointer 6-31, 6-34Function entry pointspecifying 4-8Function Listdialog 8-19GGlobal optionsin workspace 10-2, 10-13Glossary Glossary-1Go buttonsee Run buttonGo to Cursor buttonsee Run to Cursor buttonGo until Return buttonsee Run until Return buttonHHalted System Debugsee HSDHardware breakpointssee BreakpointsHeap 5-13see MemoryHigh-level Step Into buttonin the Code window 3-7High-level Step Over buttonin the Code window 3-8Homesee DirectoriesHSDdefined 4-12switching to RSD 4-12HW Break if in Rangedialog 4-24HW Break if X, then if Ydialog 4-27HW Break on Data Value matchdialog 4-29HW While in func/range, Break if Xdialog 4-26IImagesauto-set PC on load 2-4connecting on loading 2-6debugging multiple images 2-20disconnecting when loaded 2-23load settings in project 2-15loading 2-2, 5-5loading above 0x8000 2-21loading from a user-defined project2-3loading from the command line 2-6loading from the Load File to Targetdialog box 2-3loading from the Process Controlpane 2-5loading multiple 2-20loading progress 2-8managing 2-9passing arguments on loading 2-4,2-7passing arguments on reloading2-24passing sections on loading 2-4Processor status 2-8quick loading 2-5reloading 2-22, 2-24removing all details 2-23runtime indicator 2-8set PC to entry point on load 2-5setting PC manually 2-21setting PC on load 2-4symbol data 2-19unloading 2-22unloading and auto-projects 2-23viewing in the Code window 2-9viewing in the Process Control pane2-11Include files 3-18from the Debug menu 3-18Journal files 3-15Log files 3-15STDIOlog files 3-15INSTRin Break/Tracepoints pane 4-65software breakpoints 4-65Intended audience xInteractive Memory Settingdialog 7-10Interactive Register Settingdialog 7-13Internationalization A-8settings for A-9JJOULOG_UNBUF 3-18Journal filesat start-up 3-17, 3-18closing 3-16in the Status line 3-16output buffering 3-18viewing 3-17LLine numberssetting breakpoints 4-16turning on 2-10, 3-4, 3-8, 4-15, 6-2,7-10, 9-8Linker command filesgenerating 5-14Linuxsee Red Hat LinuxLoad File to Targetdialog 2-3Loadingappending 2-4Index-4 Copyright © 2002-2005 <strong>ARM</strong> Limited. All rights reserved. <strong>ARM</strong> DUI 0153G
Indeximages 2-2, 5-5images and loading progress 2-8images and Processor status 2-8images and runtime indicator 2-8multiple images 2-20replace image 2-4Localizationsee InternationalizationLog filesat start-up 3-17, 3-18closing 3-16in the Status line 3-16output buffering 3-18viewing 3-17Low-level Step Into buttonin the Code window 3-8Low-level Step Over buttonin the Code window 3-9MMacros 9-2attaching 9-7calling 9-5, 9-14calling from the Debug menu 9-14copying 9-13creating 9-8declaring variables 9-9defining 9-5deleting 9-13editing 9-11in symbol table 9-2, 9-5, 9-9, 9-14in the symbol table 2-19including a definition file 9-5, 9-14loading from a project 9-15loading on connection 9-14precedence 9-6properties 9-3return values 9-6stopping 9-7using debugger commands 9-3, 9-9using with breakpoints 4-56viewing 9-10Mappingsource files 3-22Marginbreakpoint markers 4-10red icon 4-10setting breakpoints 4-16white icon 4-10yellow icon 4-10Memoryand breakpoints 4-9changing contents 6-25, 6-28data formats 6-23data sizes 6-23disabling memory mapping 5-4display colors 6-24downloading to a file 7-14, 7-18editing map entries 5-5enabling memory mapping 5-4filling with a pattern 7-16formatting options 6-21generating linker command files5-14in <strong>RealView</strong> <strong>ARM</strong>ulator ISS 5-13interactive operations 7-2interactive operations examples7-10interactive operations from theDebug menu 7-3interactive operations from theMemory pane 7-4interactive operations from the Stackpane 7-4map configuration 5-8mapping 5-2mapping and breakpoints 4-9setting access size 5-6, 6-27setting interactively 7-10setting stack and heap 5-13setting top_of_memory 5-13specifying range 7-15verifying against a file 7-16viewing contents 6-19viewing for multiple targets 6-29viewing the map 5-7working with Flash 7-5Memory mapin BCD file 5-2display colors 5-8editing 5-5setting up 5-5update based on processor registers5-12MenusBreak/Tracepoints 4-66, 4-67C++ Class 8-18C++ Function 8-18Debug 3-11Disassembly View 3-5Memory/Register Operations 7-3New Actions 4-54New Qualifiers 4-52Pane 4-70Target 2-3Tools 10-9View 2-5Workspace 10-3Metacharactersin browser filters 8-7, 8-28using in browsers 8-7, 8-28Mode testsused in hardware breakpoints 4-13Module naming conventions 4-7Module/File Listdialog 8-23, 8-24, 8-26Multibyte charactersdisplaying in the Locals tab 6-39displaying Watch variables 6-44,6-45see InternationalizationMulti-ICEDCC 6-17DCC semihosting 6-17debugger internals 6-12Standard semihosting 6-17NNetwork Broker 1-8, 1-10New/Edit Favoritedialog 4-77Numbersturn on lines 2-10, 3-4, 3-8, 4-15,6-2, 7-10, 9-8OObjectsclosing open 10-5Options window 10-9<strong>ARM</strong> DUI 0153G Copyright © 2002-2005 <strong>ARM</strong> Limited. All rights reserved. Index-5
IndexPPanesBreak/Tracepoints 4-11, 4-63, 4-64Call Stack 6-36Data Navigator 8-5File Editor 3-3Memory 6-19Process Control 2-11Register 6-2Stack 6-31, 6-33Symbol Browser 8-17Watch 6-40Pass countsused in hardware breakpoints 4-13,4-36, 4-48, 4-49used in software breakpoints 4-52PC 2-4see Program CounterPendingcommands 3-2Persistence infobreakpoints history 4-75favorites 4-76, 6-46Processin Process Control pane 2-11, 2-21multiple images 2-20Process Controlproperties 2-13tabs 2-11Process Control panetype ahead 2-13Processorreset 2-22resetting 2-22Processor exceptionssee BreakpointsProcessor modein register view 6-9privileged mode 6-9Program Counter 2-4, 3-3locating 3-4red box 3-3, 3-4reset to entry point 3-5see also Scopesetting on load 2-4Projectsassociated images 2-17auto-projects 2-13, 2-14Qclosing 2-17defining in workspace 10-6Project Properties window 3-21searching source files 3-19source files mapping 3-22Queuecommand handling 3-2commands 3-2R<strong>RealView</strong> <strong>ARM</strong>ulator ISSand the RESET command 4-73core models 6-4cycle counting 6-11, 6-14CycleCount tab 6-11debugger internals 6-11, 6-14hardware breakpoints 4-13in examples xloading images 2-2Semihost tab 6-13stopping during semihosting input3-7top of stack 5-3top_of_memory 5-13<strong>RealView</strong> Connection Brokerarguments 1-9starting from the command line 1-9<strong>RealView</strong> <strong>Debugger</strong>arguments 1-3connecting to a target 2-2debugger internals 6-11, 6-12directories 1-11image loading 5-5memory mapping 5-2starting 1-2, 1-8target configuration 2-2using macros 9-2using on Red Hat Linux B-2using on Sun Solaris B-2<strong>RealView</strong> ICEDCC 6-17DCC semihosting 6-17debugger internals 6-12Standard semihosting 6-17<strong>RealView</strong> Network Broker 1-8starting from the command line 1-9<strong>RealView</strong> Simulator Broker 1-8Red Hat Linuxchanges to the Code window B-10changes to the desktop B-10Code window B-10column resizing B-8configuration files for <strong>RealView</strong><strong>ARM</strong>ulator ISS B-5configuration files for SimulatorBroker B-5Control Panel B-7creating the history file B-10exphist.sav B-10Front Panel B-7installing examples B-11saving favorites B-10target configuration B-5tools support examples on B-11using DSP B-6using the examples on B-11Register Listdialog 8-25Registers<strong>ARM</strong> processors 6-9banked out 6-9, 6-10banks 6-9, 6-10changing contents 6-6cycle counting 6-11DCC semihosting 6-17defining custom registers 6-18different views 6-7display colors 6-4formatting options 6-4interactive operations 7-2interactive operations examples7-10interactive operations from theDebug menu 7-3processor mode 6-9semihosting 6-17setting interactively 7-12updating contents 6-7viewing 6-9viewing contents 6-2viewing debugger internals 6-11,6-12Index-6 Copyright © 2002-2005 <strong>ARM</strong> Limited. All rights reserved. <strong>ARM</strong> DUI 0153G
Indexviewing for multiple targets 6-9Reloadingimages 2-24using arguments 2-24RSDdefined 4-12switching to HSD 4-12RTOSDebug Agent 4-12see also HSDsee also RSDRun buttonin the Code window 3-7Run to Cursor buttonin the Code window 3-9Run until Return buttonin the Code window 3-9Running System Debugsee RSDRun-time stacksee StackRVDEBUG_HOME 1-7RVDEBUG_SHARE 1-7SScope 3-3autoscope 3-3blue pointer 3-4context 3-3controls 6-34, 6-39filled blue arrow 3-4, 3-5forcing 3-4in browsers 8-2PC 3-3red box 3-4, 3-5, 3-7Scopingto a file 8-24, 8-26to a function 8-20to a module 8-24, 8-26Search rules 3-19, 3-20autoconfiguring 3-20configuring 3-21Searchingsource files 3-19, 3-22source search rules 3-19Select File to Include Commands fromdialog 3-18Select File to Journal todialog 3-15Select File to log the STDIO todialog 3-15Select File to Log todialog 3-15SemihostingDCC 6-17Standard 6-17Settingsin Workspace A-1save on exit 10-4Settings options 10-4Simple Break if Xdialog 4-21Simulator Broker 1-8Software breakpointssee BreakpointsSolarissee Sun SolarisSource coloringsettings for A-8, A-10Source search prompt 3-20Stackbreakpoints 6-34changing contents 6-33context controls 6-34, 6-39data formats 6-33EP 6-34formatting options 6-32FP 6-31, 6-34in <strong>RealView</strong> <strong>ARM</strong>ulator ISS 5-3in the Stack pane 6-30, 6-31see also Memorypointer 6-30SP 6-31, 6-34Stack down buttonin the Code window 6-34Stack pointer 6-31, 6-34default 6-34Stack up buttonin the Code window 6-34Standard breakpoint 4-10, 4-43Starting<strong>RealView</strong> <strong>Debugger</strong> 1-2, 1-8STDIOlog filesat start-up 3-17, 3-18closing 3-16in the Status line 3-16output buffering 3-18viewing 3-17Stop Execution buttonin the Code window 3-7Structure of this book xiSun Solarischanges to the Code window B-10changes to the desktop B-10Code window B-10column resizing B-8configuration files for <strong>RealView</strong><strong>ARM</strong>ulator ISS B-5configuration files for SimulatorBroker B-5Control Panel B-7creating the history file B-10exphist.sav B-10Front Panel B-7installing examples B-11saving favorites B-10target configuration B-5tools support examples on B-11using DSP B-6using the examples on B-11Symbol Browser pane 8-17Symbolsloading 2-4, 2-19macros in the symbol table 2-19symbol table 2-19TTargetsee Debug targetTarget configurationon Red Hat Linux B-5on Sun Solaris B-5Terminology Glossary-1Threadsin the Break/Tracepoints pane 4-64,4-69see also Halted System Debugsee also Running System DebugToolbarscustomizing 10-13Tracepoints 3-13class 4-43clearing 4-73<strong>ARM</strong> DUI 0153G Copyright © 2002-2005 <strong>ARM</strong> Limited. All rights reserved. Index-7
IndexUclearing all 4-20, 4-73deleting 4-73deleting all 4-73disabling 4-72in the Break/Tracepoints pane 4-63,4-64, 4-69removing 4-73removing all 4-73type 4-44Unconditional breakpoints 4-4UNIXsee Red Hat Linuxsee Sun SolarisUnloadingimages 2-22Upload/Download file from/to Memorydialog 7-14, 7-19<strong>User</strong> IDcreating the home directory 1-11<strong>User</strong>’s comments xvVVariable Listdialog 8-21WWatchescreating a favorite 6-46editing 6-46in the Watch pane 6-40managing 6-42saving as favorites 6-47setting 6-40setting from favorites 6-45viewing expressions 6-42WindowsOptions 10-9Project Properties 3-21Workspace Options 10-9Windows login IDcreating the home directory 1-12WorkspaceALL group 10-14, A-8see also Appendix AAsm_type setting A-7Backup group A-13Backup settings A-13Board_file setting A-5Button group A-6Button settings A-6changing settings 10-15closing 10-5closing objects 10-5Cmds group A-14CODE group 10-13, A-6Command group A-2Command settings A-2connection details 10-14copying entries 10-17creating an empty file 10-7cutting entries 10-19DEBUGGER group 10-13, A-2debugger settings 10-16defining Code windows 10-16deleting settings 10-19Disassembler group A-3Disassembler settings A-3Edit group A-12, A-14Edit settings A-14Font_information group A-9Font_information settings A-9global options 10-2, 10-13in Tools menu 10-9in Workspace Options window 10-9initializing 10-2Internationalization group A-9Internationalization settings A-9List of Entries pane 10-11not using 10-2open projects 10-6opening 10-3, 10-5Pane_font settings A-9pasting entries 10-17Pos_size group A-6Pos_size settings A-6project load list 10-6PROJECTS group 10-14resetting entries 10-19restoring settings 10-15same on start-up 10-4saving 10-3Search group A-12Search settings A-12settings 10-2, 10-13settings conflict 10-5, 10-13settings file 10-13settings saved 10-2Settings Values pane 10-11Source_coloring group A-10Source_coloring settings A-10Src_ctrl group A-14Src_ctrl settings A-14start-up options 10-3Tab_conv group A-13Tab_conv settings A-13text color settings A-10Text group A-8text Height setting A-8text Internationalization settingA-8text Src_color_dis setting A-8text Width setting A-8undoing changes 10-19using 10-2viewing settings 10-9window internals 10-14Workspace menuin the Code window 10-3Workspace Options window 10-10Symbols@entrybreakpoint location specifier 4-8Index-8 Copyright © 2002-2005 <strong>ARM</strong> Limited. All rights reserved. <strong>ARM</strong> DUI 0153G