- Page 1 and 2: ®RealViewDebuggerVersion 1.8User G
- Page 3 and 4: Web Addresshttp://www.arm.comARM DU
- Page 5 and 6: ContentsRealView Debugger User Guid
- Page 7 and 8: Contents8.6 Using the Module/File L
- Page 9 and 10: PrefaceThis preface introduces the
- Page 11 and 12: PrefaceUsing this bookThis book is
- Page 13 and 14: Prefacemonospace italicmonospace bo
- Page 15 and 16: PrefaceFeedbackARM Limited welcomes
- Page 17 and 18: Chapter 1Starting to use RealView D
- Page 19 and 20: Starting to use RealView DebuggerSy
- Page 21 and 22: Starting to use RealView Debugger-l
- Page 23 and 24: Starting to use RealView Debugger1.
- Page 25 and 26: Starting to use RealView Debugger1.
- Page 27 and 28: Starting to use RealView Debugger1.
- Page 29 and 30: Chapter 2Working with ImagesThis ch
- Page 31 and 32: Working with Images2.1.1 Loading fr
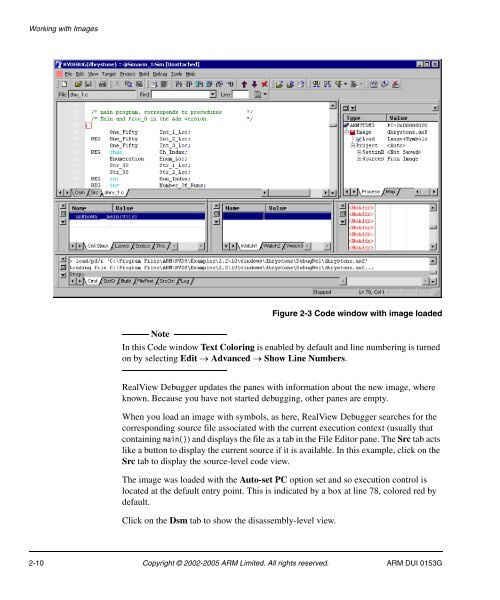
- Page 33 and 34: Working with ImagesThis is the defa
- Page 35 and 36: Working with ImagesFigure 2-2 Conne
- Page 37: Working with Images2.2 Managing ima
- Page 41 and 42: Working with Imagesto view. RealVie
- Page 43 and 44: Working with ImagesChanging project
- Page 45 and 46: Working with ImagesClosing auto-pro
- Page 47 and 48: Working with Images2.3 Working with
- Page 49 and 50: Working with ImagesIn this example,
- Page 51 and 52: Working with ImagesIf there are any
- Page 53 and 54: Chapter 3Controlling ExecutionThere
- Page 55 and 56: Controlling Execution3.2 Defining e
- Page 57 and 58: Controlling ExecutionThe PC is at t
- Page 59 and 60: Controlling Execution3.3 Using exec
- Page 61 and 62: Controlling ExecutionLow-level Step
- Page 63 and 64: Controlling Execution3.4 Working wi
- Page 65 and 66: Controlling ExecutionStep Until Con
- Page 67 and 68: Controlling Execution3.5 Automating
- Page 69 and 70: Controlling ExecutionFigure 3-3 Clo
- Page 71 and 72: Controlling Execution3.6 Searching
- Page 73 and 74: Controlling ExecutionNoteAbsolute p
- Page 75 and 76: Chapter 4Working with BreakpointsTh
- Page 77 and 78: Working with Breakpoints• Recordi
- Page 79 and 80: Working with Breakpointshardware de
- Page 81 and 82: Working with Breakpoints4.1.2 Quali
- Page 83 and 84: Working with Breakpoints4.1.5 Break
- Page 85 and 86: Working with BreakpointsFigure 4-1
- Page 87 and 88: Working with BreakpointsFor full de
- Page 89 and 90:
Working with Breakpoints4.2 Setting
- Page 91 and 92:
Working with BreakpointsSetting a b
- Page 93 and 94:
Working with Breakpoints4.2.4 Setti
- Page 95 and 96:
Working with Breakpoints4.4 Setting
- Page 97 and 98:
Working with BreakpointsYou can use
- Page 99 and 100:
Working with BreakpointsDebug → B
- Page 101 and 102:
Working with BreakpointsEnter Data
- Page 103 and 104:
Working with Breakpoints4.5.4 Using
- Page 105 and 106:
Working with Breakpoints— Convert
- Page 107 and 108:
Working with Breakpoints4.6 Specify
- Page 109 and 110:
Working with Breakpoints4.7.2 Using
- Page 111 and 112:
Working with Breakpoints4.7.3 Using
- Page 113 and 114:
Working with BreakpointsIf you have
- Page 115 and 116:
Working with Breakpoints4.8 Using t
- Page 117 and 118:
Working with Breakpoints• a funct
- Page 119 and 120:
Working with BreakpointsActionsOKCa
- Page 121 and 122:
Working with Breakpoints• HW Supp
- Page 123 and 124:
Working with BreakpointsFigure 4-16
- Page 125 and 126:
Working with BreakpointsNoteThese m
- Page 127 and 128:
Working with Breakpoints4.8.11 Spec
- Page 129 and 130:
Working with BreakpointsMessage Out
- Page 131 and 132:
Working with Breakpoints4.9.2 Attac
- Page 133 and 134:
Working with Breakpoints4.10 Contro
- Page 135 and 136:
Working with BreakpointsStopped at
- Page 137 and 138:
Working with Breakpoints4.11 Using
- Page 139 and 140:
Working with Breakpoints4.11.2 View
- Page 141 and 142:
Working with BreakpointsDisableThis
- Page 143 and 144:
Working with BreakpointsYou can als
- Page 145 and 146:
Working with BreakpointsNoteThe Bre
- Page 147 and 148:
Working with Breakpoints4.12.2 Clea
- Page 149 and 150:
Working with BreakpointsThe Functio
- Page 151 and 152:
Working with BreakpointsBreak/Trace
- Page 153 and 154:
Chapter 5Memory MappingThis chapter
- Page 155 and 156:
Memory Mapping5.1.2 Memory map cons
- Page 157 and 158:
Memory Mapping5.3 Setting up a memo
- Page 159 and 160:
Memory Mapping5.4 Viewing the memor
- Page 161 and 162:
Memory MappingFigure 5-3 Colors in
- Page 163 and 164:
Memory MappingProperties...Displays
- Page 165 and 166:
Memory Mapping5.6 Setting top_of_me
- Page 167 and 168:
Memory MappingExample 5-1/* Linker
- Page 169 and 170:
Chapter 6Working with Debug ViewsTh
- Page 171 and 172:
Working with Debug Views7. Enter 50
- Page 173 and 174:
Working with Debug ViewsGlobal form
- Page 175 and 176:
Working with Debug Views3. Double-c
- Page 177 and 178:
Working with Debug ViewsManaging mu
- Page 179 and 180:
Working with Debug Views6.1.6 Viewi
- Page 181 and 182:
Working with Debug ViewsFigure 6-7
- Page 183 and 184:
Working with Debug ViewsStack_Base
- Page 185 and 186:
Working with Debug ViewsDCC semihos
- Page 187 and 188:
Working with Debug Views6.2 Working
- Page 189 and 190:
Working with Debug Views11. Double-
- Page 191 and 192:
Working with Debug ViewsFormatDispl
- Page 193 and 194:
Working with Debug ViewsNoteIf the
- Page 195 and 196:
Working with Debug ViewsIncrementDe
- Page 197 and 198:
Working with Debug Views7. Change t
- Page 199 and 200:
Working with Debug Views6.3.1 Using
- Page 201 and 202:
Working with Debug ViewsShow ASCII
- Page 203 and 204:
Working with Debug ViewsRealView De
- Page 205 and 206:
Working with Debug ViewsThe program
- Page 207 and 208:
Working with Debug ViewsGo toThis c
- Page 209 and 210:
Working with Debug ViewsUsing the P
- Page 211 and 212:
Working with Debug ViewsFigure 6-16
- Page 213 and 214:
Working with Debug ViewsFormat...Se
- Page 215 and 216:
Working with Debug Views4. Click OK
- Page 217 and 218:
Chapter 7Reading and Writing Memory
- Page 219 and 220:
Reading and Writing Memory, Registe
- Page 221 and 222:
Reading and Writing Memory, Registe
- Page 223 and 224:
Reading and Writing Memory, Registe
- Page 225 and 226:
Reading and Writing Memory, Registe
- Page 227 and 228:
Reading and Writing Memory, Registe
- Page 229 and 230:
Reading and Writing Memory, Registe
- Page 231 and 232:
Reading and Writing Memory, Registe
- Page 233 and 234:
Reading and Writing Memory, Registe
- Page 235 and 236:
Reading and Writing Memory, Registe
- Page 237 and 238:
Reading and Writing Memory, Registe
- Page 239 and 240:
Chapter 8Working with Browsers and
- Page 241 and 242:
Working with Browsers and Favorites
- Page 243 and 244:
Working with Browsers and Favorites
- Page 245 and 246:
Working with Browsers and Favorites
- Page 247 and 248:
Working with Browsers and Favorites
- Page 249 and 250:
Working with Browsers and Favorites
- Page 251 and 252:
Working with Browsers and Favorites
- Page 253 and 254:
Working with Browsers and Favorites
- Page 255 and 256:
Working with Browsers and Favorites
- Page 257 and 258:
Working with Browsers and Favorites
- Page 259 and 260:
Working with Browsers and Favorites
- Page 261 and 262:
Working with Browsers and Favorites
- Page 263 and 264:
Working with Browsers and Favorites
- Page 265 and 266:
Working with Browsers and Favorites
- Page 267 and 268:
Working with Browsers and Favorites
- Page 269 and 270:
Working with Browsers and Favorites
- Page 271 and 272:
Working with Browsers and Favorites
- Page 273 and 274:
Chapter 9Working with MacrosIn Real
- Page 275 and 276:
Working with Macros9.1.1 Properties
- Page 277 and 278:
Working with MacrosIf you require a
- Page 279 and 280:
Working with MacrosError: Cannot pe
- Page 281 and 282:
Working with MacrosWhen creating a
- Page 283 and 284:
Working with Macros9.2.4 Editing a
- Page 285 and 286:
Working with MacrosThis displays th
- Page 287 and 288:
Working with MacrosFigure 9-3 Loadi
- Page 289 and 290:
Working with Macros9.3 Getting more
- Page 291 and 292:
Chapter 10Configuring Workspace Set
- Page 293 and 294:
Configuring Workspace SettingsBy de
- Page 295 and 296:
Configuring Workspace Settings10.1.
- Page 297 and 298:
Configuring Workspace SettingsWhere
- Page 299 and 300:
Configuring Workspace Settings10.2
- Page 301 and 302:
Configuring Workspace SettingsSetti
- Page 303 and 304:
Configuring Workspace SettingsTrue/
- Page 305 and 306:
Configuring Workspace Settings10.3
- Page 307 and 308:
Configuring Workspace Settings6. Pr
- Page 309 and 310:
Configuring Workspace Settings10.3.
- Page 311 and 312:
Appendix AWorkspace Settings Refere
- Page 313 and 314:
Workspace Settings ReferenceTable A
- Page 315 and 316:
Workspace Settings ReferenceA.1.3Bo
- Page 317 and 318:
Workspace Settings ReferenceA.2.3As
- Page 319 and 320:
Workspace Settings ReferenceTable A
- Page 321 and 322:
Workspace Settings ReferenceTable A
- Page 323 and 324:
Workspace Settings ReferenceTable A
- Page 325 and 326:
Workspace Settings ReferenceTable A
- Page 327 and 328:
Appendix BRealView Debugger on Sun
- Page 329 and 330:
RealView Debugger on Sun Solaris an
- Page 331 and 332:
RealView Debugger on Sun Solaris an
- Page 333 and 334:
RealView Debugger on Sun Solaris an
- Page 335 and 336:
RealView Debugger on Sun Solaris an
- Page 337 and 338:
RealView Debugger on Sun Solaris an
- Page 339 and 340:
GlossaryThe items in this glossary
- Page 341 and 342:
GlossaryCurrent Program Status Regi
- Page 343 and 344:
GlossaryHardware breakpointA breakp
- Page 345 and 346:
GlossaryRSDRTOSSee Running System D
- Page 347 and 348:
GlossaryUnconditional breakpointA b
- Page 349 and 350:
IndexAAbout this book xActionsspeci
- Page 351 and 352:
Indexlocal host connection 1-8remot
- Page 353 and 354:
Indeximages 2-2, 5-5images and load
- Page 355 and 356:
Indexviewing for multiple targets 6