Foundation
Foundation
Foundation

You also want an ePaper? Increase the reach of your titles
YUMPU automatically turns print PDFs into web optimized ePapers that Google loves.
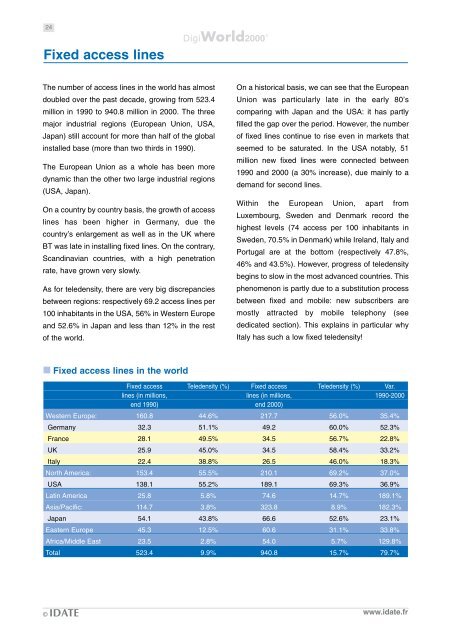
24Fixed access linesWorld2000 The number of access lines in the world has almostdoubled over the past decade, growing from 523.4million in 1990 to 940.8 million in 2000. The threemajor industrial regions (European Union, USA,Japan) still account for more than half of the globalinstalled base (more than two thirds in 1990).The European Union as a whole has been moredynamic than the other two large industrial regions(USA, Japan).On a country by country basis, the growth of accesslines has been higher in Germany, due thecountry’s enlargement as well as in the UK whereBT was late in installing fixed lines. On the contrary,Scandinavian countries, with a high penetrationrate, have grown very slowly.As for teledensity, there are very big discrepanciesbetween regions: respectively 69.2 access lines per100 inhabitants in the USA, 56% in Western Europeand 52.6% in Japan and less than 12% in the restof the world.On a historical basis, we can see that the EuropeanUnion was particularly late in the early 80’scomparing with Japan and the USA: it has partlyfilled the gap over the period. However, the numberof fixed lines continue to rise even in markets thatseemed to be saturated. In the USA notably, 51million new fixed lines were connected between1990 and 2000 (a 30% increase), due mainly to ademand for second lines.Within the European Union, apart fromLuxembourg, Sweden and Denmark record thehighest levels (74 access per 100 inhabitants inSweden, 70.5% in Denmark) while Ireland, Italy andPortugal are at the bottom (respectively 47.8%,46% and 43.5%). However, progress of teledensitybegins to slow in the most advanced countries. Thisphenomenon is partly due to a substitution processbetween fixed and mobile: new subscribers aremostly attracted by mobile telephony (seededicated section). This explains in particular whyItaly has such a low fixed teledensity! Fixed access lines in the worldFixed access Teledensity (%) Fixed access Teledensity (%) Var.lines (in millions, lines (in millions, 1990-2000end 1990) end 2000)Western Europe: 160.8 44.6% 217.7 56.0% 35.4%Germany 32.3 51.1% 49.2 60.0% 52.3%France 28.1 49.5% 34.5 56.7% 22.8%UK 25.9 45.0% 34.5 58.4% 33.2%Italy 22.4 38.8% 26.5 46.0% 18.3%North America: 153.4 55.5% 210.1 69.2% 37.0%USA 138.1 55.2% 189.1 69.3% 36.9%Latin America 25.8 5.8% 74.6 14.7% 189.1%Asia/Pacific: 114.7 3.8% 323.8 8.9% 182.3%Japan 54.1 43.8% 66.6 52.6% 23.1%Eastern Europe 45.3 12.5% 60.6 31.1% 33.8%Africa/Middle East 23.5 2.8% 54.0 5.7% 129.8%Total 523.4 9.9% 940.8 15.7% 79.7%© IDATE www.idate.fr