Download Presentation (PDF 1.24 MB) - Linde Engineering
Download Presentation (PDF 1.24 MB) - Linde Engineering
Download Presentation (PDF 1.24 MB) - Linde Engineering
- No tags were found...

Create successful ePaper yourself
Turn your PDF publications into a flip-book with our unique Google optimized e-Paper software.
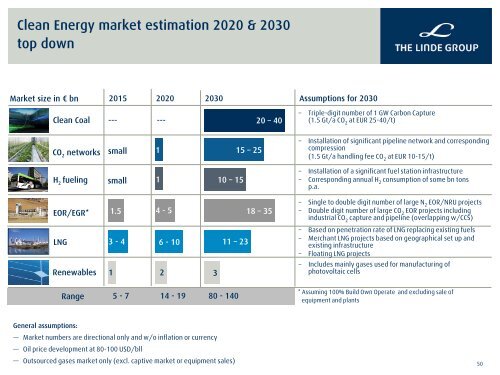
Clean Energy market estimation 2020 & 2030top downMarket size in € bn2015 2020 2030 Assumptions for 2030Clean Coal --- ---20 – 40– Triple-digit number of 1 GW Carbon Capture(1.5 Gt/a CO 2at EUR 25-40/t)CO 2networks small 115 – 25– Installation of significant pipeline network and correspondingcompression(1.5 Gt/a handling fee CO 2at EUR 10-15/t)H 2fueling small 110 – 15EOR/EGR* 1.5 4 - 518 – 35LNG 3 - 4 6 - 1011 – 23Renewables 1 2Range 5 - 7 14 - 19 80 - 1403– Installation of a significant fuel station infrastructure– Corresponding annual H 2consumption of some bn tonsp.a.– Single to double digit number of large N 2EOR/NRU projects– Double digit number of large CO 2EOR projects includingindustrial CO 2capture and pipeline (overlapping w/CCS)– Based on penetration rate of LNG replacing existing fuels– Merchant LNG projects based on geographical set up andexisting infrastructure– Floating LNG projects– Includes mainly gases used for manufacturing ofphotovoltaic cells* Assuming 100% Build Own Operate and excluding sale ofequipment and plantsGeneral assumptions:— Market numbers are directional only and w/o inflation or currency— Oil price development at 80-100 USD/bll— Outsourced gases market only (excl. captive market or equipment sales)50