Evaluation and Utilisation of Fish Protein Isolate Products
Evaluation and Utilisation of Fish Protein Isolate Products
Evaluation and Utilisation of Fish Protein Isolate Products
- No tags were found...

Create successful ePaper yourself
Turn your PDF publications into a flip-book with our unique Google optimized e-Paper software.
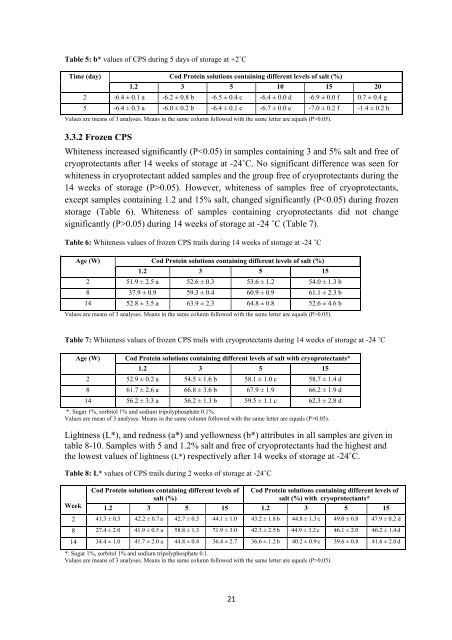
Table 5: b* values <strong>of</strong> CPS during 5 days <strong>of</strong> storage at +2˚CTime (day) Cod <strong>Protein</strong> solutions containing different levels <strong>of</strong> salt (%)1.2 3 5 10 15 202 -6.4 ± 0.1 a -6.2 ± 0.8 b -6.5 ± 0.4 c -6.4 ± 0.0 d -6.9 ± 0.0 f 0.7 ± 0.4 g5 -6.4 ± 0.3 a -6.0 ± 0.2 b -6.4 ± 0.1 c -6.7 ± 0.0 e -7.0 ± 0.2 f -1.4 ± 0.2 hValues are means <strong>of</strong> 3 analyses. Means in the same column followed with the same letter are equals (P>0.05).3.3.2 Frozen CPSWhiteness increased significantly (P0.05). However, whiteness <strong>of</strong> samples free <strong>of</strong> cryoprotectants,except samples containing 1.2 <strong>and</strong> 15% salt, changed significantly (P0.05) during 14 weeks <strong>of</strong> storage at -24 ˚C (Table 7).Table 6: Whiteness values <strong>of</strong> frozen CPS trails during 14 weeks <strong>of</strong> storage at -24 ˚CAge (W)2814Cod <strong>Protein</strong> solutions containing different levels <strong>of</strong> salt (%)1.2351551.9 ± 2.5 a 52.6 ± 0.3 53.6 ± 1.254.0 ± 1.3 b37.9 ± 0.9 59.3 ± 0.4 60.9 ± 0.961.1 ± 2.3 b52.8 ± 3.5 a 63.9 ± 2.3 64.8 ± 0.852.6 ± 4.6 bValues are means <strong>of</strong> 3 analyses. Means in the same column followed with the same letter are equals (P>0.05).Table 7: Whiteness values <strong>of</strong> frozen CPS trails with cryoprotectants during 14 weeks <strong>of</strong> storage at -24 ˚CAge (W)2814Cod <strong>Protein</strong> solutions containing different levels <strong>of</strong> salt with cryoprotectants*1.2351552.9 ± 0.2 a 54.5 ± 1.6 b 58.1 ± 1.0 c 58.7 ± 1.4 d61.7 ± 2.6 a 66.8 ± 3.6 b 67.9 ± 1.966.2 ± 1.9 d56.2 ± 3.3 a 56.2 ± 1.3 b 59.5 ± 1.1 c 62.3 ± 2.8 d*: Sugar 1%, sorbitol 1% <strong>and</strong> sodium tripolyphosphate 0.1%.Values are mean <strong>of</strong> 3 analyses. Means in the same column followed with the same letter are equals (P>0.05).Lightness (L*), <strong>and</strong> redness (a*) <strong>and</strong> yellowness (b*) attributes in all samples are given intable 8-10. Samples with 5 <strong>and</strong> 1.2% salt <strong>and</strong> free <strong>of</strong> cryoprotectants had the highest <strong>and</strong>the lowest values <strong>of</strong> lightness (L*) respectively after 14 weeks <strong>of</strong> storage at -24˚C.Table 8: L* values <strong>of</strong> CPS trails during 2 weeks <strong>of</strong> storage at -24˚CCod <strong>Protein</strong> solutions containing different levels <strong>of</strong>salt (%)Cod <strong>Protein</strong> solutions containing different levels <strong>of</strong>salt (%) with cryoprotectants*Week 1.2 3 5 15 1.2 3 5 152 41.3 ± 0.3 42.2 ± 0.7 a 42.7 ± 0.5 44.1 ± 1.0 43.2 ± 1.8 b 44.8 ± 1.3 c 49.0 ± 0.8 47.9 ± 0.2 d8 27.4 ± 2.0 41.9 ± 0.5 a 58.8 ± 1.3 71.9 ± 3.0 42.3 ± 2.5 b 44.9 ± 3.2 c 46.1 ± 2.0 46.2 ± 1.4 d14 34.4 ± 1.0 41.7 ± 2.0 a 44.8 ± 0.4 36.4 ± 2.7 36.6 ± 1.2 b 40.2 ± 0.9 c 39.6 ± 0.8 41.6 ± 2.0 d*: Sugar 1%, sorbitol 1% <strong>and</strong> sodium tripolyphosphate 0.1.Values are means <strong>of</strong> 3 analyses. Means in the same column followed with the same letter are equals (P>0.05).21