Evaluation and Utilisation of Fish Protein Isolate Products
Evaluation and Utilisation of Fish Protein Isolate Products
Evaluation and Utilisation of Fish Protein Isolate Products
- No tags were found...

Create successful ePaper yourself
Turn your PDF publications into a flip-book with our unique Google optimized e-Paper software.
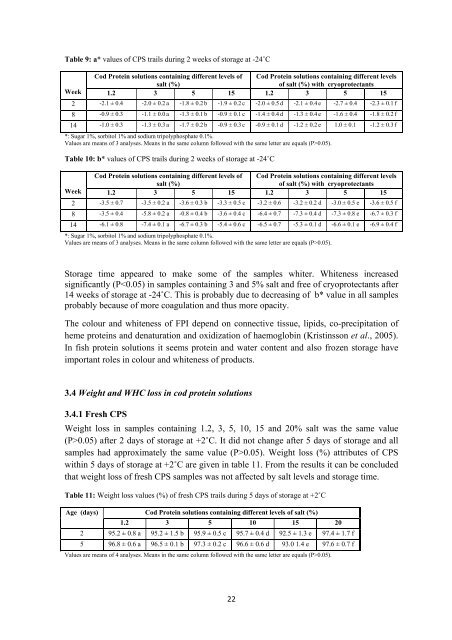
Table 9: a* values <strong>of</strong> CPS trails during 2 weeks <strong>of</strong> storage at -24˚CCod <strong>Protein</strong> solutions containing different levels <strong>of</strong>salt (%)Cod <strong>Protein</strong> solutions containing different levels<strong>of</strong> salt (%) with cryoprotectantsWeek 1.2 3 5 15 1.2 3 5 152 -2.1 ± 0.4 -2.0 ± 0.2 a -1.8 ± 0.2 b -1.9 ± 0.2 c -2.0 ± 0.5 d -2.1 ± 0.4 e -2.7 ± 0.4 -2.3 ± 0.1 f8 -0.9 ± 0.3 -1.1 ± 0.0 a -1.3 ± 0.1 b -0.9 ± 0.1 c -1.4 ± 0.4 d -1.3 ± 0.4 e -1.6 ± 0.4 -1.8 ± 0.2 f14 -1.0 ± 0.3 -1.3 ± 0.3 a -1.7 ± 0.2 b -0.9 ± 0.3 c -0.9 ± 0.1 d -1.2 ± 0.2 e 1.0 ± 0.1 -1.2 ± 0.3 f*: Sugar 1%, sorbitol 1% <strong>and</strong> sodium tripolyphosphate 0.1%.Values are means <strong>of</strong> 3 analyses. Means in the same column followed with the same letter are equals (P>0.05).Table 10: b* values <strong>of</strong> CPS trails during 2 weeks <strong>of</strong> storage at -24˚CCod <strong>Protein</strong> solutions containing different levels <strong>of</strong>salt (%)Cod <strong>Protein</strong> solutions containing different levels<strong>of</strong> salt (%) with cryoprotectantsWeek 1.2 3 5 15 1.2 3 5 152 -3.5 ± 0.7 -3.5 ± 0.2 a -3.6 ± 0.3 b -3.3 ± 0.5 c -3.2 ± 0.6 -3.2 ± 0.2 d -3.0 ± 0.5 e -3.6 ± 0.5 f8 -3.5 ± 0.4 -5.8 ± 0.2 a -0.8 ± 0.4 b -3.6 ± 0.4 c -6.4 ± 0.7 -7.3 ± 0.4 d -7.3 ± 0.8 e -6.7 ± 0.3 f14 -6.1 ± 0.8 -7.4 ± 0.1 a -6.7 ± 0.3 b -5.4 ± 0.6 c -6.5 ± 0.7 -5.3 ± 0.1 d -6.6 ± 0.1 e -6.9 ± 0.4 f*: Sugar 1%, sorbitol 1% <strong>and</strong> sodium tripolyphosphate 0.1%.Values are means <strong>of</strong> 3 analyses. Means in the same column followed with the same letter are equals (P>0.05).Storage time appeared to make some <strong>of</strong> the samples whiter. Whiteness increasedsignificantly (P0.05) after 2 days <strong>of</strong> storage at +2˚C. It did not change after 5 days <strong>of</strong> storage <strong>and</strong> allsamples had approximately the same value (P>0.05). Weight loss (%) attributes <strong>of</strong> CPSwithin 5 days <strong>of</strong> storage at +2˚C are given in table 11. From the results it can be concludedthat weight loss <strong>of</strong> fresh CPS samples was not affected by salt levels <strong>and</strong> storage time.Table 11: Weight loss values (%) <strong>of</strong> fresh CPS trails during 5 days <strong>of</strong> storage at +2˚CAge (days) Cod <strong>Protein</strong> solutions containing different levels <strong>of</strong> salt (%)1.2 3 5 10 15 202 95.2 ± 0.8 a 95.2 ± 1.5 b 95.9 ± 0.5 c 95.7 ± 0.4 d 92.5 ± 1.3 e 97.4 ± 1.7 f5 96.8 ± 0.6 a 96.5 ± 0.1 b 97.3 ± 0.2 c 96.6 ± 0.6 d 93.0 1.4 e 97.6 ± 0.7 fValues are means <strong>of</strong> 4 analyses. Means in the same column followed with the same letter are equals (P>0.05).22