Pre-Lab 7 Assignment: Capacitors and RC Circuits
Pre-Lab 7 Assignment: Capacitors and RC Circuits
Pre-Lab 7 Assignment: Capacitors and RC Circuits
- No tags were found...

You also want an ePaper? Increase the reach of your titles
YUMPU automatically turns print PDFs into web optimized ePapers that Google loves.
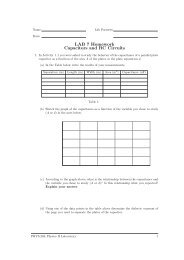
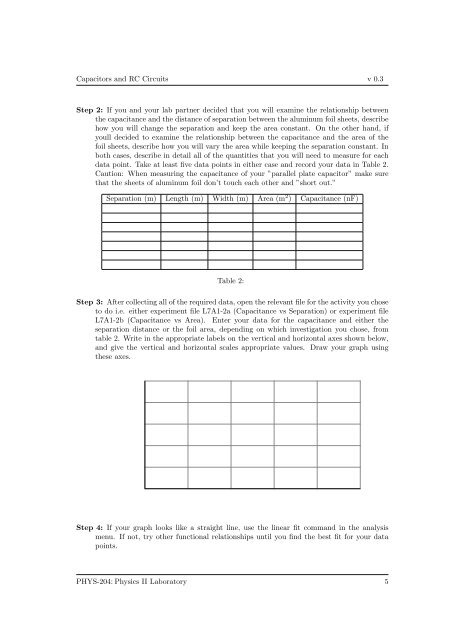
<strong>Capacitors</strong> <strong>and</strong> <strong>RC</strong> <strong>Circuits</strong> v 0.3Step 2: If you <strong>and</strong> your lab partner decided that you will examine the relationship betweenthe capacitance <strong>and</strong> the distance of separation between the aluminum foil sheets, describehow you will change the separation <strong>and</strong> keep the area constant. On the other h<strong>and</strong>, ifyoull decided to examine the relationship between the capacitance <strong>and</strong> the area of thefoil sheets, describe how you will vary the area while keeping the separation constant. Inboth cases, describe in detail all of the quantities that you will need to measure for eachdata point. Take at least five data points in either case <strong>and</strong> record your data in Table 2.Caution: When measuring the capacitance of your ”parallel plate capacitor” make surethat the sheets of aluminum foil don’t touch each other <strong>and</strong> ”short out.”Separation (m) Length (m) Width (m) Area (m 2 ) Capacitance (nF)Table 2:Step 3: After collecting all of the required data, open the relevant file for the activity you choseto do i.e. either experiment file L7A1-2a (Capacitance vs Separation) or experiment fileL7A1-2b (Capacitance vs Area). Enter your data for the capacitance <strong>and</strong> either theseparation distance or the foil area, depending on which investigation you chose, fromtable 2. Write in the appropriate labels on the vertical <strong>and</strong> horizontal axes shown below,<strong>and</strong> give the vertical <strong>and</strong> horizontal scales appropriate values. Draw your graph usingthese axes.Step 4: If your graph looks like a straight line, use the linear fit comm<strong>and</strong> in the analysismenu. If not, try other functional relationships until you find the best fit for your datapoints.PHYS-204:Physics II <strong>Lab</strong>oratory 5