Pre-Lab 13 Assignment: Radioactive Decay
Pre-Lab 13 Assignment: Radioactive Decay
Pre-Lab 13 Assignment: Radioactive Decay

Create successful ePaper yourself
Turn your PDF publications into a flip-book with our unique Google optimized e-Paper software.
Name:<br />
<strong>Lab</strong> Partners:<br />
Date:<br />
<strong>Pre</strong>-<strong>Lab</strong> <strong>13</strong> <strong>Assignment</strong>:<br />
<strong>Radioactive</strong> <strong>Decay</strong><br />
(Due at the beginning of lab)<br />
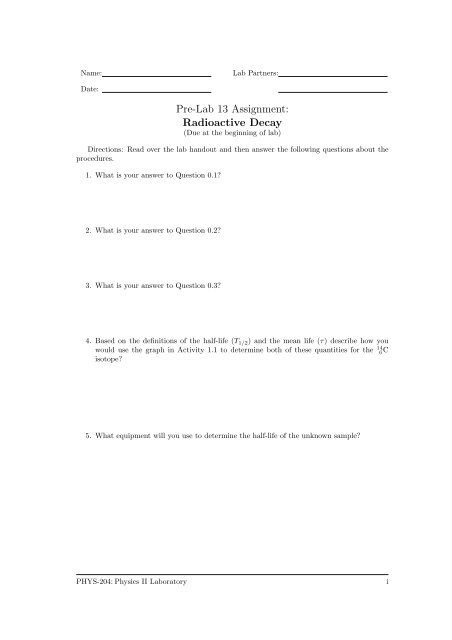
Directions: Read over the lab handout and then answer the following questions about the<br />
procedures.<br />
1. What is your answer to Question 0.1?<br />
2. What is your answer to Question 0.2?<br />
3. What is your answer to Question 0.3?<br />
4. Based on the definitions of the half-life (T 1/2 ) and the mean life (τ) describe how you<br />
would use the graph in Activity 1.1 to determine both of these quantities for the 14 6C<br />
isotope?<br />
5. What equipment will you use to determine the half-life of the unknown sample?<br />
PHYS-204:Physics II <strong>Lab</strong>oratory<br />
i
Name:<br />
<strong>Lab</strong> Partners:<br />
Date:<br />
<strong>Lab</strong> <strong>13</strong>:<br />
<strong>Radioactive</strong> <strong>Decay</strong><br />
Objectives<br />
• To understand phenomena that have an exponential behavior.<br />
• To determine the relationship between the decay constant and the half-life.<br />
• To determine the half-life of an unknown radioactive sample.<br />
Overview<br />
In <strong>Lab</strong> 7 (Capacitors and RC Circuits) we learned that when a resistor and a capacitor are<br />
connected to a battery and a switch the capacitor will charge and discharge following an exponential<br />
behavior. During the charging process the voltage in the capacitor is given by the<br />
following equation:<br />
V = V 0 (1−e −t/τ ), (1)<br />
where τ = RC, and R is the resistance of the resistor and C is the capacitance of the capacitor.<br />
The discharge is given by<br />
V = V 0 e −t/τ . (2)<br />
The constant τ called the characteristic time (or ”time constant”) tells how fast or slowly<br />
the capacitor will be charged. The larger the value of τ the more time it will take to charge<br />
the capacitor and this will depend on the values of R and C. The constant τ also tells how<br />
fast or slowly the capacitor will be discharged. For example, from Eq. (2), at time t = τ,<br />
V = V 0 e −τ/τ = V 0 e −1 = 0.37V 0 ; that is, after τ seconds, the voltage is reduced to 37% of the<br />
original value.<br />
Question 0.1 In the axes below an exponential decay of an RC circuit with a 100Ω resistor and<br />
a capacitor of unknown capacitance is shown. Determine the time constant τ for the circuit.<br />
Show all your work.<br />
PHYS-204:Physics II <strong>Lab</strong>oratory 1
<strong>Radioactive</strong> <strong>Decay</strong> v 0.1<br />
10<br />
9<br />
8<br />
7<br />
6<br />
Voltage (V)<br />
5<br />
4<br />
3<br />
2<br />
1<br />
0<br />
0 1 2 3 4 5 6 7 8 9 10<br />
Time (s)<br />
Question 0.2 Using the result from Question 0.1 determine the capacitance of the capacitor.<br />
show your work<br />
Question 0.3 Using the graph above determine at what time the voltage dropped to about 5%<br />
of its original value. This value corresponds to approximately how many time constants (τ)?<br />
Many other phenomena have exponential behavior such as population growth and decay and<br />
radioactive decay. In this lab we will examine the exponential decay of a radioactive sample<br />
with a short characteristic time. Radioactivity is a result of the disintegration or decay of<br />
unstable nuclei. Because of this instability the nucleus will decay with the emission of some<br />
kind of radiation which can be a particle or electromagnetic radiation. The rate of decay of a<br />
PHYS-204:Physics II <strong>Lab</strong>oratory 2
<strong>Radioactive</strong> <strong>Decay</strong> v 0.1<br />
sample is proportional to the number of nuclei in the sample<br />
∆N<br />
∆t<br />
= −λN, (3)<br />
the number of nuclei remaining in the sample will follow an exponential law:<br />
N = N 0 e −λt (4)<br />
where λ is the decay constant and has unit of inverse time, and N 0 is the number of nuclei<br />
present in the sample before any decays occur. In this lab we will investigate the decay of<br />
radioactive samples and the relationship between the decay constant and the half-life and mean<br />
life of a radioactive material.<br />
Investigation 1:<br />
Half-Life and Mean Life of an Isotope<br />
Eq. (4) describes the exponential decay in terms of the decay constant λ, however one can<br />
rewrite it in a way very similar to the decay in the RC circuit described by Eq. (2). The mean<br />
life (τ) of a certain unstable nuclei is defined as τ = 1/λ. And Eq. (4) becomes<br />
N = N 0 e −t/τ . (1.5)<br />
Just like the RC circuit τ is the time constant that tells us how fast or how slow the sample will<br />
decay. Its meaning is that one expects, on average, that a particular nuclei will decay within<br />
this characteristic time. But, of course, some nuclei will decay faster and others will decay<br />
slower than τ. τ is determined exactly the same way as we did for the RC circuit, that is we<br />
determine how long it takes the sample to have 37 % of the original number of nuclei. Another<br />
quantity of interest is the half-life of the isotope, which is defined as the time it takes for the<br />
sample to have 50 % of the original number of parent nuclei N 0 to decay. By solving Eq. (4)<br />
for T 1/2 we obtain<br />
T 1/2 = ln2<br />
λ = 0.693<br />
λ . (1.6)<br />
Question 1.1 Solve Eq. (4) with the condition that at t = T 1/2 , N = N 0 /2 and prove Eq. (1.6).<br />
Show all your work<br />
One of the common uses of radioactive decays is carbon dating. Carbon dating is done by<br />
measuring the rate of decay (or ”activity”, the number of decays per unit time) of the 14 6C<br />
isotope in a sample of an artifact made of organic material. It can be shown that the activity<br />
follows the same exponential law as the number of parent nuclei in the sample, i.e.<br />
(<br />
∆N ∆N<br />
∆t = ∆t<br />
)<br />
e −λt , (1.7)<br />
0<br />
where (∆N/∆t) 0 is the initial activity of the sample. In the axes below we show the activity<br />
of a sample of 14 6C as a function of time.<br />
PHYS-204:Physics II <strong>Lab</strong>oratory 3
<strong>Radioactive</strong> <strong>Decay</strong> v 0.1<br />
4<br />
3<br />
Activity (×10 10 <strong>Decay</strong>s/sec)<br />
2<br />
1<br />
0<br />
0 5 10 15 20<br />
Time (1000 years)<br />
Question 1.2 Based on the definition of the half-life (T 1/2 ) and the mean life (τ) describe how<br />
you would use the graph above to determine both of these quantities.<br />
Question 1.3 Determine T 1/2 , λ and τ using the graph above. Show your work.<br />
PHYS-204:Physics II <strong>Lab</strong>oratory 4
<strong>Radioactive</strong> <strong>Decay</strong> v 0.1<br />
Question 1.4 Compare the value you obtained in Question (1.3) with the accepted value of the<br />
half-life of 14 6C of 5730yr. Do they agree?<br />
Now that you know how to determine the half-life, the mean life, and the decay constant of a<br />
given isotope by looking at the activity of the radioactive sample as a function of time you are<br />
ready to determine the half-life of an unknown isotope by measuring its activity over a period<br />
of time.<br />
Investigation 2:<br />
Determining the Half-Life of a <strong>Radioactive</strong> Sample<br />
In this section we will determine the half-life, the mean life and the decay constant of a radioactive<br />
sample of an unknown isotope.<br />
For the activities in this investigation you will need:<br />
• computer-based laboratory system<br />
• experiment configuration files<br />
• radioactivity probe<br />
• small beaker<br />
• radioactive sample (handled by the lab technician)<br />
<strong>Pre</strong>caution The level of radioactivity in the samples is very low, and will not cause any harm,<br />
provided they are not ingested or allowed to come into contact with the skin. However, care<br />
should always be exercised when handling any radioactive substance. If a spill should occur, it<br />
should be wiped up immediately and the paper towels discarded in a container provided. DO<br />
NOT EAT OR DRINK while handling radioactive material.<br />
Activity 2.1: Measuring the Activity of the Sample<br />
Step 1: Open the <strong>Lab</strong> file <strong>Lab</strong><strong>13</strong> A 1<br />
Step 2: Connect the radioactivity probe to the socket named Dig.1 in the Vernier adapter.<br />
Step 3: Place the measuring window of the probe directly in front of the clean beaker.<br />
Step 4: When you are ready to start your experiment request that the lab technician put the<br />
sample in your beaker.<br />
Step 5: Immediately after your sample is poured in the beaker click the collect button in the<br />
Logger Pro software. Be patient as the total collection time is 20 minutes. Once the<br />
collect button appears again, you are ready to analyze your results. The probe will be<br />
collecting raw counts of the activity of the sample. These are the number of decays over<br />
a period of 5 seconds.<br />
PHYS-204:Physics II <strong>Lab</strong>oratory 5
<strong>Radioactive</strong> <strong>Decay</strong> v 0.1<br />
Step 6: In the axes below draw the graph you obtained in Step 5. Make sure to indicate the<br />
scale in the axes.<br />
Activity (counts)<br />
Time (s)<br />
Step 7: Using the software curve fit tools try a few different fits, for example inverse (A/t),<br />
inverse square (A/t 2 ), and natural exponent (Aexp(−Ct)+B).<br />
Question 2.1 Which of the curves best fit the data? And what are the values of the constants<br />
obtained in the fit?<br />
If the experiment went according to plan your best fit should have been the natural exponent.<br />
But, as you might have noticed that instead of the expression in Eq. (1.7) which goes to zero<br />
as times becomes very large (t → ∞) there was an extra constant (B).<br />
Question 2.2 In the expression y = Ae −Ct +B what is the value of y as t → ∞?<br />
PHYS-204:Physics II <strong>Lab</strong>oratory 6
<strong>Radioactive</strong> <strong>Decay</strong> v 0.1<br />
In the experiment the values of the fitting function y corresponds to the activity ∆N/∆t and<br />
the variable x corresponds to time t.<br />
Question 2.3 What is the meaning of the constants B and C?<br />
As you might have concluded the value of C corresponds to the decay constant λ and the<br />
value of B, which is the activity as t → ∞, is the activity of the background, often referred as<br />
the background radiation.<br />
Question 2.4 From the values obtained in question 2.1 what is the decay constant and the<br />
background activity (note: In the plot the software gives a raw count that is taken over a period<br />
of 5 s. To obtain the activity you have to divide C by 5.)<br />
<strong>Decay</strong> Constant λ from curve fit: .<br />
Background Activity from curve fit: .<br />
Question 2.5 Determine the half-life and the mean life of the measured sample using the decay<br />
constant determined in Question 2.4.<br />
Half-Life (T 1/2 ): .<br />
Mean Life (τ): .<br />
Nowthatyoudeterminedthehalf-lifebydoingabestfittothegraphobtainedusingthesoftware<br />
you will determine the half-life directly from the graph just like you did in Investigation 1. In<br />
the axes above draw a curve that best fits your data points and from that extract the half-life<br />
of your sample. Compare your result with the one obtained in Question 2.5. Do they agree?<br />
Why or why not?<br />
Repeat steps 1-7, draw the new graph in the above axes (preferably in a different color) and<br />
determine the half-life, decay constant and mean life of the second sample. Write the values<br />
below and compare them with the numbers determined in the first run.<br />
PHYS-204:Physics II <strong>Lab</strong>oratory 7
<strong>Radioactive</strong> <strong>Decay</strong> v 0.1<br />
Question 2.6 Are your values from the second run in agreement with the ones obtained in the<br />
first run? If not determine the possible source of errors.<br />
Question 2.7 The sample you used is of <strong>13</strong>7<br />
56Ba. The accepted value of its half-life is about 156<br />
seconds. Compare your measured results with the results obtained in the lab. Roughly estimate<br />
the error in your estimate of the half-life. Are your results in agreement (within error bars)<br />
with the accepted value? If not, determine the possible sources of errors.<br />
Question 2.8 What modifications in the described procedure could lead to smaller errors in<br />
the determination of the half-life? Explain your answer.<br />
Investigation 3:<br />
Background Radiation<br />
As noted in Investigation 2 the best fit to your experimental data was one where the activity<br />
did not go to zero as t → ∞. This is due to what is called background radiation, which is<br />
radiation that we are exposed to everyday. The sources of this radiation are cosmic rays as<br />
well as sources from our soil such as radon gas. This background radiation will change from<br />
one place to another. However, if no other artificial sources are brought to a given site the<br />
background radiation on that site should be nearly constant. In this activity we will measure<br />
the background radiation in our lab and compare to the values we determined in investigation<br />
2.<br />
For the activities in this investigation you will need:<br />
• computer-based laboratory system<br />
• experiment configuration files<br />
• radioactivity probe<br />
PHYS-204:Physics II <strong>Lab</strong>oratory 8
<strong>Radioactive</strong> <strong>Decay</strong> v 0.1<br />
• small beaker<br />
Step 1: Open the <strong>Lab</strong> file <strong>Lab</strong><strong>13</strong> A 1<br />
Step 2: Connect the radioactivity probe to the socket named Dig.1 in the Vernier adapter.<br />
Step 3: Point the measuring window to of the probe directly in front of the clean empty<br />
beaker. The probe will be collecting raw counts of the activity of the sample. These are<br />
the number of decays over a period of 5 seconds.<br />
Step 4: Start collecting your data. Run your experiment for two minutes and then stop.<br />
Step 5: In the axes below draw the graph you obtained in Step 4. Make sure to indicate the<br />
scale in the axes.<br />
Activity (counts)<br />
Time (s)<br />
Step 6: Using the analysis tools in the software determine the average activity in the lab and<br />
write your answer below:<br />
Background activity: .<br />
Question 3.1 Is the answer you obtained in agreement with the results obtained in Activity<br />
2? If not, determine the probable causes for the difference. (note: In the plot the<br />
software gives a raw count that is taken over a period of 5 s. To obtain the activity you<br />
have to divide C by 5.)<br />
PHYS-204:Physics II <strong>Lab</strong>oratory 9
<strong>Radioactive</strong> <strong>Decay</strong> v 0.1<br />
Question 3.2 Is the background activity obtained in Question 3.1 in agreement with the<br />
number displayed in the window of the radioactivity probe?<br />
PHYS-204:Physics II <strong>Lab</strong>oratory 10