Final Report on Torque with Cross Force Comparison No. MT01 ...
Final Report on Torque with Cross Force Comparison No. MT01 ...
Final Report on Torque with Cross Force Comparison No. MT01 ...
- No tags were found...
You also want an ePaper? Increase the reach of your titles
YUMPU automatically turns print PDFs into web optimized ePapers that Google loves.
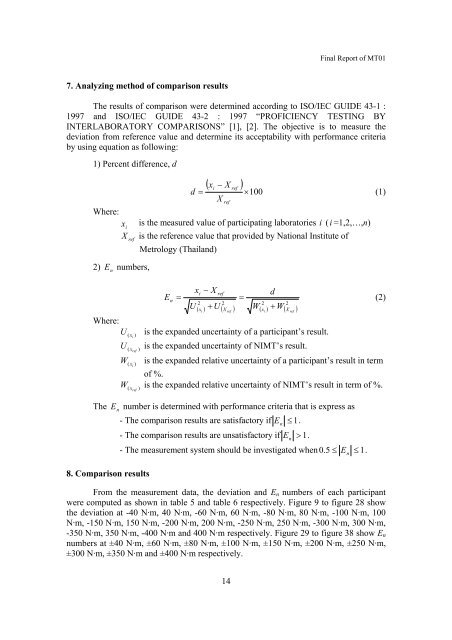
<str<strong>on</strong>g>Final</str<strong>on</strong>g> <str<strong>on</strong>g>Report</str<strong>on</strong>g> of <strong>MT01</strong>7. Analyzing method of comparis<strong>on</strong> resultsThe results of comparis<strong>on</strong> were determined according to ISO/IEC GUIDE 43-1 :1997 and ISO/IEC GUIDE 43-2 : 1997 “PROFICIENCY TESTING BYINTERLABORATORY COMPARISONS” [1], [2]. The objective is to measure thedeviati<strong>on</strong> from reference value and determine its acceptability <strong>with</strong> performance criteriaby using equati<strong>on</strong> as following:1) Percent difference, d( x − X )irefd = ×100(1)XrefWhere:x is the measured value of participating laboratories i (i =1,2,…,n)iXrefis the reference value that provided by Nati<strong>on</strong>al Institute ofMetrology (Thailand)2) Ennumbers,xi− XrefdEn= =(2)2 22 2U ( xi) + U ( X ref ) W( xi) + W( X ref )Where:U is the expanded uncertainty of a participant’s result.The( x i)U is the expanded uncertainty of NIMT’s result.( x ref)W( x i )is the expanded relative uncertainty of a participant’s result in termof %.W is the expanded relative uncertainty of NIMT’s result in term of %.( x ref)Ennumber is determined <strong>with</strong> performance criteria that is express as- The comparis<strong>on</strong> results are satisfactory if En≤ 1.- The comparis<strong>on</strong> results are unsatisfactory if En> 1.- The measurement system should be investigated when 0.5≤ E ≤ 1.8. Comparis<strong>on</strong> resultsFrom the measurement data, the deviati<strong>on</strong> and E n numbers of each participantwere computed as shown in table 5 and table 6 respectively. Figure 9 to figure 28 showthe deviati<strong>on</strong> at -40 N·m, 40 N·m, -60 N·m, 60 N·m, -80 N·m, 80 N·m, -100 N·m, 100N·m, -150 N·m, 150 N·m, -200 N·m, 200 N·m, -250 N·m, 250 N·m, -300 N·m, 300 N·m,-350 N·m, 350 N·m, -400 N·m and 400 N·m respectively. Figure 29 to figure 38 show E nnumbers at ±40 N·m, ±60 N·m, ±80 N·m, ±100 N·m, ±150 N·m, ±200 N·m, ±250 N·m,±300 N·m, ±350 N·m and ±400 N·m respectively.n14


