PowerLogic ION7550 / ION7650 User Guide - Schneider Electric
PowerLogic ION7550 / ION7650 User Guide - Schneider Electric
PowerLogic ION7550 / ION7650 User Guide - Schneider Electric

You also want an ePaper? Increase the reach of your titles
YUMPU automatically turns print PDFs into web optimized ePapers that Google loves.
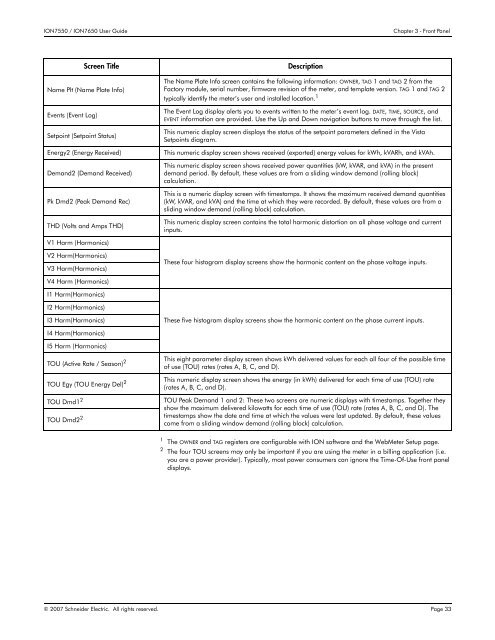
<strong>ION7550</strong> / <strong>ION7650</strong> <strong>User</strong> <strong>Guide</strong>Chapter 3 - Front PanelScreen TitleName Plt (Name Plate Info)Events (Event Log)Setpoint (Setpoint Status)Energy2 (Energy Received)Demand2 (Demand Received)Pk Dmd2 (Peak Demand Rec)THD (Volts and Amps THD)V1 Harm (Harmonics)V2 Harm(Harmonics)V3 Harm(Harmonics)V4 Harm (Harmonics)I1 Harm(Harmonics)I2 Harm(Harmonics)I3 Harm(Harmonics)I4 Harm(Harmonics)I5 Harm (Harmonics)TOU (Active Rate / Season) 2TOU Egy (TOU Energy Del) 2TOU Dmd1 2TOU Dmd2 2DescriptionThe Name Plate Info screen contains the following information: OWNER, TAG 1 and TAG 2 from theFactory module, serial number, firmware revision of the meter, and template version. TAG 1 and TAG 2typically identify the meter’s user and installed location. 1The Event Log display alerts you to events written to the meter’s event log. DATE, TIME, SOURCE, andEVENT information are provided. Use the Up and Down navigation buttons to move through the list.This numeric display screen displays the status of the setpoint parameters defined in the VistaSetpoints diagram.This numeric display screen shows received (exported) energy values for kWh, kVARh, and kVAh.This numeric display screen shows received power quantities (kW, kVAR, and kVA) in the presentdemand period. By default, these values are from a sliding window demand (rolling block)calculation.This is a numeric display screen with timestamps. It shows the maximum received demand quantities(kW, kVAR, and kVA) and the time at which they were recorded. By default, these values are from asliding window demand (rolling block) calculation.This numeric display screen contains the total harmonic distortion on all phase voltage and currentinputs.These four histogram display screens show the harmonic content on the phase voltage inputs.These five histogram display screens show the harmonic content on the phase current inputs.This eight parameter display screen shows kWh delivered values for each all four of the possible timeof use (TOU) rates (rates A, B, C, and D).This numeric display screen shows the energy (in kWh) delivered for each time of use (TOU) rate(rates A, B, C, and D).TOU Peak Demand 1 and 2: These two screens are numeric displays with timestamps. Together theyshow the maximum delivered kilowatts for each time of use (TOU) rate (rates A, B, C, and D). Thetimestamps show the date and time at which the values were last updated. By default, these valuescome from a sliding window demand (rolling block) calculation.1 The OWNER and TAG registers are configurable with ION software and the WebMeter Setup page.2 The four TOU screens may only be important if you are using the meter in a billing application (i.e.you are a power provider). Typically, most power consumers can ignore the Time-Of-Use front paneldisplays.© 2007 <strong>Schneider</strong> <strong>Electric</strong>. All rights reserved. Page 33