<strong>PT</strong> CIPUTRA DEVELOPMENT <strong>Tbk</strong> AND SUBSIDIARIESNOTES TO CONSOLIDATED FINANCIAL STATEMENTS (Continued)For Nine Months Ended 30 September 2006 and 2005(In Rupiah)On 9 May 2005, the Company submitted a Debt Composition Plan to its creditors. Pursuant to the DebtComposition Plan, all interest, penalties and other accrued expenses shall be waived by the creditors, while thedebt principal shall be settled through the following scheme:DescriptionAmount (USD)Tranche IDebt to equity conversion 104,187,809Tranche II***Debt to equity conversion 32,095,529Debt settlement through assets transferred 45,000,000Total 181,283,338*** Transferred/managed by Artupic International B.V. (a special purpose vehicle of the creditors) on behalf of the creditors.The debt to equity conversion was executed at the exchange rate of Rp 8,465 per USD 1, with a conversionvalue of Rp 500 per share. As a result, the number of new shares to be issued to the creditors amounted to2,307,276,912 shares (which represents an increase of 58.86% of the Company’s share capital).In addition to the issue of shares, the following assets were relinquished by the Company to the followingcreditors for subsequent sale:• 20.45% share ownership in <strong>PT</strong> <strong>Ciputra</strong> Liang Court, an associated company• 99.98% share ownership in <strong>PT</strong> Cakradigdaya Lokaraya, a subsidiary• 99.94% share ownership in <strong>PT</strong> Citra Adyapataka, a subsidiary• 99.84% share ownership in <strong>PT</strong> Sarananeka Indahpancar, a subsidiary• 99.60% share ownership in <strong>PT</strong> Putraindah Jasabangun, a subsidiary• 39.90% share ownership in <strong>PT</strong> <strong>Ciputra</strong> Adigraha, a subsidiary• Two lots areas of land (each with an area of 7,874 sqm and 5,024 sqm, respectively) located at PerumahanCitra, JakartaOn 15 June 2005, the Debt Composition Plan was ratified by the Commerce Court at the District Court of CentralJakarta, with the Decision No. 02/PKPU/2005/PN.NIAGA.JKT.PST. On 29 March 2006, after the fulfillment ofconditions precedent as stated in the Debt Composition Plan, the process of the Company’s debt settlement wasdeclared effective.For the settlement of the aforementioned debt, the Company recorded the following:• Debt to equity conversionThe value of debt converted amounted to USD 136,283,338 (approximately Rp 1,226,072,210,020), throughthe issue of 2,307,276,912 new shares. On conversion date, the Company recorded an increase in sharecapital amounting to Rp 1,153,638,456,000 and a gain on debt restructuring of Rp 112,433,754,020.• Debt settlement through assets transferred and the write-off of accrued interestThe value of the debt settled through assets transferred amounted to USD 45,000,000 (approximately Rp418,050,000,000, while the value of accrued interest which was written-off amounted to USD 75,550,067(approximately Rp 701,860,122,430 and the value of the assets transferred amounted Rp 754,631,093,637.As a result, the Company recorded a gain on debt restructuring of Rp 365,279,028,793.Therefore, total gain on debts restructuring is amounting to Rp 477,712,782,813, and presented underExtraordinary Items account (see Note 23).27. ESTIMATED LIABILITIES ON EMPLOYEE BENEFITSThis account represents estimated liabilities on employee benefits based on Labor Law No. 13 year 2003 dated25 March 2003, which calculated by <strong>PT</strong> Rileos Pratama, independent actuarial.31
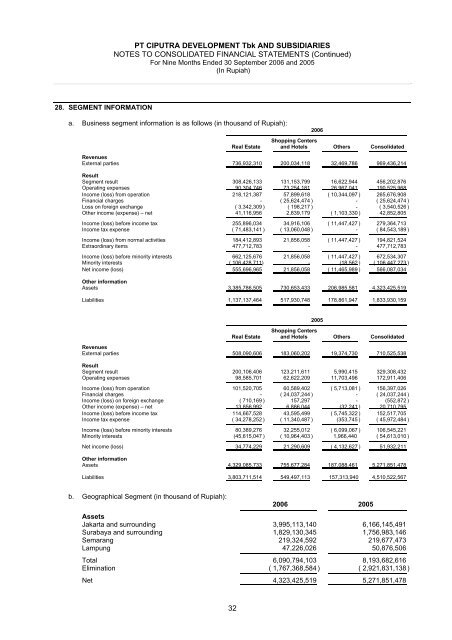
<strong>PT</strong> CIPUTRA DEVELOPMENT <strong>Tbk</strong> AND SUBSIDIARIESNOTES TO CONSOLIDATED FINANCIAL STATEMENTS (Continued)For Nine Months Ended 30 September 2006 and 2005(In Rupiah)28. SEGMENT INFORMATIONa. Business segment information is as follows (in thousand of Rupiah):2006Shopping CentersReal Estate and Hotels Others ConsolidatedRevenuesExternal parties 736,932,310 200,034,118 32,469,786 969,436,214ResultSegment result 308,426,133 131,153,799 16,622,944 456,202,876Operating expenses 90,304,746 73,254,181 26,967,041 190,525,968Income (loss) from operation 218,121,387 57,899,618 ( 10,344,097 ) 265,676,908Financial charges - ( 25,624,474 ) - ( 25,624,474 )Loss on foreign exchange ( 3,342,309 ) ( 198,217 ) - ( 3,540,526 )Other income (expense) – net 41,116,956 2,839,179 ( 1,103,330 ) 42,852,805Income (loss) before income tax 255,896,034 34,916,106 ( 11,447,427 ) 279,364,713Income tax expense ( 71,483,141 ) ( 13,060,048 ) - ( 84,543,189 )Income (loss) from normal activities 184,412,893 21,856,058 ( 11,447,427 ) 194,821,524Extraordinary items 477,712,783 - - 477,712,783Income (loss) before minority interests 662,125,676 21,856,058 ( 11,447,427 ) 672,534,307Minority interests ( 106,428,711) - (18,562 ) ( 106,447,273 )Net income (loss) 555,696,965 21,856,058 ( 11,465,989 ) 566,087,034Other informationAssets 3,385,786,505 730,653,433 206,985,581 4,323,425,519Liabilities 1,137,137,464 517,930,748 178,861,947 1,833,930,1592005Shopping CentersReal Estate and Hotels Others ConsolidatedRevenuesExternal parties 508,090,606 183,060,202 19,374,730 710,525,538ResultSegment result 200,106,406 123,211,611 5,990,415 329,308,432Operating expenses 98,585,701 62,622,209 11,703,496 172,911,406Income (loss) from operation 101,520,705 60,589,402 ( 5,713,081 ) 156,397,026Financial charges - ( 24,037,244 ) - ( 24,037,244 )Income (loss) on foreign exchange ( 710,169 ) 157,297 - (552,872 )Other income (expense) – net 13,856,992 6,886,044 (32,241 ) 20,710,795Income (loss) before income tax 114,667,528 43,595,499 ( 5,745,322 ) 152,517,705Income tax expense ( 34,278,252 ) ( 11,340,487 ) (353,745 ) ( 45,972,484 )Income (loss) before minority interests 80,389,276 32,255,012 ( 6,099,067 ) 106,545,221Minority interests (45,615,047 ) ( 10,964,403 ) 1,966,440 ( 54,613,010 )Net income (loss) 34,774,229 21,290,609 ( 4,132,627 ) 51,932,211Other informationAssets 4,329,085,733 755,677,284 187,088,461 5,271,851,478Liabilities 3,803,711,514 549,497,113 157,313,940 4,510,522,567b. Geographical Segment (in thousand of Rupiah):2006 2005AssetsJakarta and surrounding 3,995,113,140 6,166,145,491Surabaya and surrounding 1,829,130,345 1,756,983,146Semarang 219,324,592 219,677,473Lampung 47,226,026 50,876,506Total 6,090,794,103 8,193,682,616Elimination ( 1,767,368,584 ) ( 2,921,831,138 )Net 4,323,425,519 5,271,851,47832