PT Ciputra Development Tbk And Subsidiaries
PT Ciputra Development Tbk And Subsidiaries
PT Ciputra Development Tbk And Subsidiaries
- No tags were found...

Create successful ePaper yourself
Turn your PDF publications into a flip-book with our unique Google optimized e-Paper software.
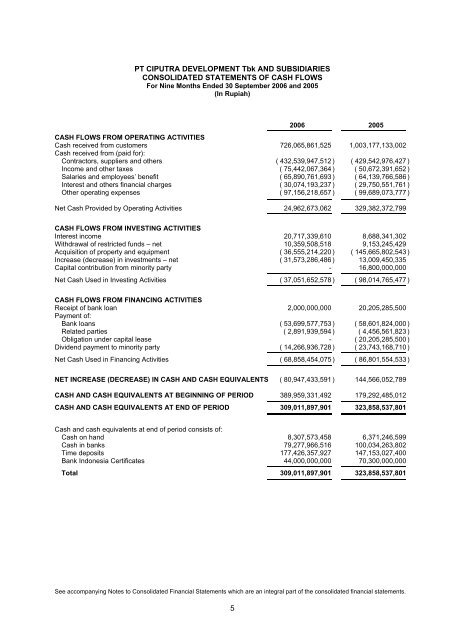
<strong>PT</strong> CIPUTRA DEVELOPMENT <strong>Tbk</strong> AND SUBSIDIARIESCONSOLIDATED STATEMENTS OF CASH FLOWSFor Nine Months Ended 30 September 2006 and 2005(In Rupiah)2006 2005CASH FLOWS FROM OPERATING ACTIVITIESCash received from customers 726,065,861,525 1,003,177,133,002Cash received from (paid for):Contractors, suppliers and others ( 432,539,947,512 ) ( 429,542,976,427 )Income and other taxes ( 75,442,067,364 ) ( 50,672,391,652 )Salaries and employees’ benefit ( 65,890,761,693 ) ( 64,139,766,586 )Interest and others financial charges ( 30,074,193,237 ) ( 29,750,551,761 )Other operating expenses ( 97,156,218,657 ) ( 99,689,073,777 )Net Cash Provided by Operating Activities 24,962,673,062 329,382,372,799CASH FLOWS FROM INVESTING ACTIVITIESInterest income 20,717,339,610 8,688,341,302Withdrawal of restricted funds – net 10,359,508,518 9,153,245,429Acquisition of property and equipment ( 36,555,214,220 ) ( 145,665,802,543 )Increase (decrease) in investments – net ( 31,573,286,486 ) 13,009,450,335Capital contribution from minority party - 16,800,000,000Net Cash Used in Investing Activities ( 37,051,652,578 ) ( 98,014,765,477 )CASH FLOWS FROM FINANCING ACTIVITIESReceipt of bank loan 2,000,000,000 20,205,285,500Payment of:Bank loans ( 53,699,577,753 ) ( 58,601,824,000 )Related parties ( 2,891,939,594 ) ( 4,456,561,823 )Obligation under capital lease - ( 20,205,285,500 )Dividend payment to minority party ( 14,266,936,728 ) ( 23,743,168,710 )Net Cash Used in Financing Activities ( 68,858,454,075 ) ( 86,801,554,533 )NET INCREASE (DECREASE) IN CASH AND CASH EQUIVALENTS ( 80,947,433,591 ) 144,566,052,789CASH AND CASH EQUIVALENTS AT BEGINNING OF PERIOD 389,959,331,492 179,292,485,012CASH AND CASH EQUIVALENTS AT END OF PERIOD 309,011,897,901 323,858,537,801Cash and cash equivalents at end of period consists of:Cash on hand 8,307,573,458 6,371,246,599Cash in banks 79,277,966,516 100,034,263,802Time deposits 177,426,357,927 147,153,027,400Bank Indonesia Certificates 44,000,000,000 70,300,000,000Total 309,011,897,901 323,858,537,801See accompanying Notes to Consolidated Financial Statements which are an integral part of the consolidated financial statements.5