The gstat Package - NexTag Supports Open Source Initiatives
The gstat Package - NexTag Supports Open Source Initiatives
The gstat Package - NexTag Supports Open Source Initiatives
You also want an ePaper? Increase the reach of your titles
YUMPU automatically turns print PDFs into web optimized ePapers that Google loves.
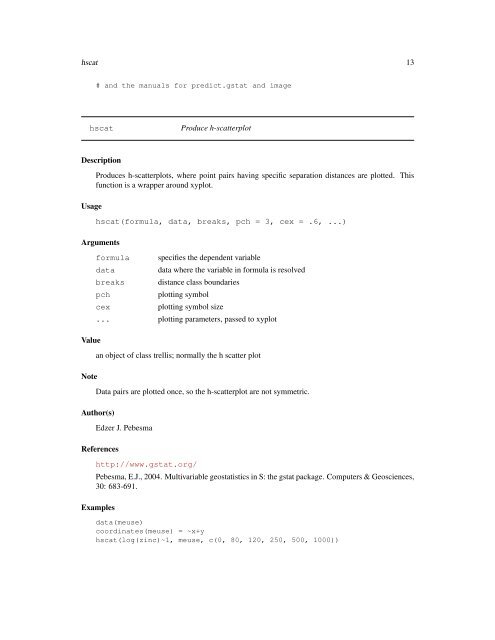
hscat 13# and the manuals for predict.<strong>gstat</strong> and imagehscatProduce h-scatterplotDescriptionUsageProduces h-scatterplots, where point pairs having specific separation distances are plotted. Thisfunction is a wrapper around xyplot.hscat(formula, data, breaks, pch = 3, cex = .6, ...)ArgumentsValueNoteformuladatabreakspchcexspecifies the dependent variabledata where the variable in formula is resolveddistance class boundariesplotting symbolplotting symbol size... plotting parameters, passed to xyplotan object of class trellis; normally the h scatter plotData pairs are plotted once, so the h-scatterplot are not symmetric.Author(s)Edzer J. PebesmaReferenceshttp://www.<strong>gstat</strong>.org/Pebesma, E.J., 2004. Multivariable geostatistics in S: the <strong>gstat</strong> package. Computers & Geosciences,30: 683-691.Examplesdata(meuse)coordinates(meuse) = ~x+yhscat(log(zinc)~1, meuse, c(0, 80, 120, 250, 500, 1000))


