

The gstat Package - NexTag Supports Open Source Initiatives
The gstat Package - NexTag Supports Open Source Initiatives
The gstat Package - NexTag Supports Open Source Initiatives

Create successful ePaper yourself
Turn your PDF publications into a flip-book with our unique Google optimized e-Paper software.
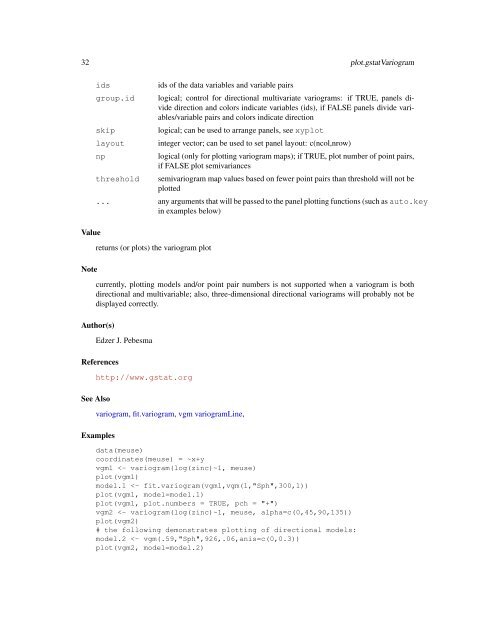
32 plot.<strong>gstat</strong>Variogramidsgroup.idskiplayoutnpValueNotethresholdids of the data variables and variable pairslogical; control for directional multivariate variograms: if TRUE, panels dividedirection and colors indicate variables (ids), if FALSE panels divide variables/variablepairs and colors indicate directionlogical; can be used to arrange panels, see xyplotinteger vector; can be used to set panel layout: c(ncol,nrow)logical (only for plotting variogram maps); if TRUE, plot number of point pairs,if FALSE plot semivariancessemivariogram map values based on fewer point pairs than threshold will not beplotted... any arguments that will be passed to the panel plotting functions (such as auto.keyin examples below)returns (or plots) the variogram plotcurrently, plotting models and/or point pair numbers is not supported when a variogram is bothdirectional and multivariable; also, three-dimensional directional variograms will probably not bedisplayed correctly.Author(s)Edzer J. PebesmaReferencesSee Alsohttp://www.<strong>gstat</strong>.orgvariogram, fit.variogram, vgm variogramLine,Examplesdata(meuse)coordinates(meuse) = ~x+yvgm1


