The gstat Package - NexTag Supports Open Source Initiatives
The gstat Package - NexTag Supports Open Source Initiatives
The gstat Package - NexTag Supports Open Source Initiatives
Create successful ePaper yourself
Turn your PDF publications into a flip-book with our unique Google optimized e-Paper software.
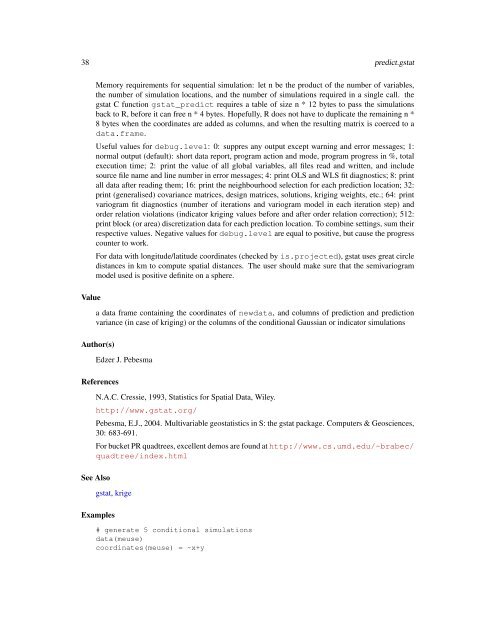
38 predict.<strong>gstat</strong>ValueMemory requirements for sequential simulation: let n be the product of the number of variables,the number of simulation locations, and the number of simulations required in a single call. the<strong>gstat</strong> C function <strong>gstat</strong>_predict requires a table of size n * 12 bytes to pass the simulationsback to R, before it can free n * 4 bytes. Hopefully, R does not have to duplicate the remaining n *8 bytes when the coordinates are added as columns, and when the resulting matrix is coerced to adata.frame.Useful values for debug.level: 0: suppres any output except warning and error messages; 1:normal output (default): short data report, program action and mode, program progress in %, totalexecution time; 2: print the value of all global variables, all files read and written, and includesource file name and line number in error messages; 4: print OLS and WLS fit diagnostics; 8: printall data after reading them; 16: print the neighbourhood selection for each prediction location; 32:print (generalised) covariance matrices, design matrices, solutions, kriging weights, etc.; 64: printvariogram fit diagnostics (number of iterations and variogram model in each iteration step) andorder relation violations (indicator kriging values before and after order relation correction); 512:print block (or area) discretization data for each prediction location. To combine settings, sum theirrespective values. Negative values for debug.level are equal to positive, but cause the progresscounter to work.For data with longitude/latitude coordinates (checked by is.projected), <strong>gstat</strong> uses great circledistances in km to compute spatial distances. <strong>The</strong> user should make sure that the semivariogrammodel used is positive definite on a sphere.a data frame containing the coordinates of newdata, and columns of prediction and predictionvariance (in case of kriging) or the columns of the conditional Gaussian or indicator simulationsAuthor(s)Edzer J. PebesmaReferencesN.A.C. Cressie, 1993, Statistics for Spatial Data, Wiley.http://www.<strong>gstat</strong>.org/Pebesma, E.J., 2004. Multivariable geostatistics in S: the <strong>gstat</strong> package. Computers & Geosciences,30: 683-691.For bucket PR quadtrees, excellent demos are found at http://www.cs.umd.edu/~brabec/quadtree/index.htmlSee Also<strong>gstat</strong>, krigeExamples# generate 5 conditional simulationsdata(meuse)coordinates(meuse) = ~x+y


