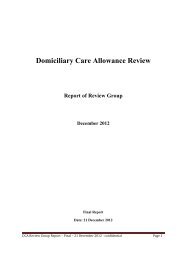
older summary list of people tables and financialxivTable H6 Number of Recip<strong>ie</strong>nts of Basic Supplementary <strong>Welfare</strong> Allowance, Rent Supplement, 84Mortgage Interest Supplement and Local Authority Mortgage Interest Supplementand other Supplements by Age and Sex, <strong>2009</strong>Table H7 Number of Recip<strong>ie</strong>nts of Rent Supplement, Mortgage Interest Supplement and Local 85Authority Mortgage Interest Supplement by Primary Payment, <strong>2009</strong>Table H8 Number of Recip<strong>ie</strong>nts of Rent Supplement, Mortgage Interest Supplement and Local 85Authority Mortgage Interest Supplement by Claim Durati<strong>on</strong>, <strong>2009</strong>Table H9 Number of Recip<strong>ie</strong>nts of Back to School Clothing and Footwear Allowance by Health 86Service Executive Area, <strong>2009</strong>Table H10 Expenditure <strong>on</strong> Back to School Clothing and Footwear Allowance by Health Service 86Executive Area, 2008 and <strong>2009</strong>Table H11 Number of Recip<strong>ie</strong>nts of Basic Supplementary <strong>Welfare</strong> Allowance Payments by87Category, <strong>2009</strong>Table H12 Number of Recip<strong>ie</strong>nts of Rent Supplement by Durati<strong>on</strong> and by Primary Payment,88<strong>2009</strong>Table H13 Number of Recip<strong>ie</strong>nts of Rent Supplement by Age and Durati<strong>on</strong>, <strong>2009</strong> 89Table H14 Short-Term and L<strong>on</strong>g-Term Recip<strong>ie</strong>nts of Rent Supplement by Primary Payment,90<strong>2009</strong>Table H15 Short-Term and L<strong>on</strong>g-Term Recip<strong>ie</strong>nts of Rent Supplement by County, <strong>2009</strong> 91Table H16 Number of Recip<strong>ie</strong>nts of Basic Supplementary <strong>Welfare</strong> Allowance, Rent Supplement,Mortgage Interest Supplement and Local Authority Mortgage Interest Supplementand Other Supplements by County, <strong>2009</strong>92Secti<strong>on</strong> J - Miscellaneous Payments And GrantsPageTable J1Table J2Expenditure <strong>on</strong> Miscellaneous Payments and Grants by Payment Type, 2008 and<strong>2009</strong>Total Expenditure <strong>on</strong> Household Benefits, Free Travel and Fuel Allowance, 2000 to<strong>2009</strong>Table J3 Miscellaneous Benefits and Allowances: Number of Claims Awarded, 2008 and <strong>2009</strong> 95Table J4 Number of Recip<strong>ie</strong>nts of Household Benefits by Type of Payment Received, <strong>2009</strong> 96Table J5 Number of Recip<strong>ie</strong>nts of <strong>Social</strong> <strong>Welfare</strong> Payments by Payment Type and Method of 98Payment, <strong>2009</strong>Table J6 Pers<strong>on</strong>al Public Service Numbers Issued by Country, 2000 to <strong>2009</strong> 999595<str<strong>on</strong>g>Statistical</str<strong>on</strong>g> <str<strong>on</strong>g>Informati<strong>on</strong></str<strong>on</strong>g> <strong>on</strong> <strong>Social</strong> <strong>Welfare</strong> <strong>Services</strong> <strong>2009</strong>
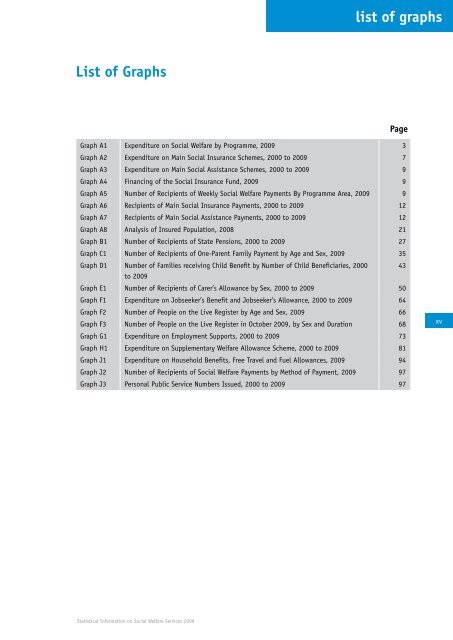
summary list and older of financial people graphsList of GraphsPageGraph A1 Expenditure <strong>on</strong> <strong>Social</strong> <strong>Welfare</strong> by Programme, <strong>2009</strong> 3Graph A2 Expenditure <strong>on</strong> Main <strong>Social</strong> Insurance Schemes, 2000 to <strong>2009</strong> 7Graph A3 Expenditure <strong>on</strong> Main <strong>Social</strong> Assistance Schemes, 2000 to <strong>2009</strong> 9Graph A4 Financing of the <strong>Social</strong> Insurance Fund, <strong>2009</strong> 9Graph A5 Number of Recip<strong>ie</strong>nts of Weekly <strong>Social</strong> <strong>Welfare</strong> Payments By Programme Area, <strong>2009</strong> 9Graph A6 Recip<strong>ie</strong>nts of Main <strong>Social</strong> Insurance Payments, 2000 to <strong>2009</strong> 12Graph A7 Recip<strong>ie</strong>nts of Main <strong>Social</strong> Assistance Payments, 2000 to <strong>2009</strong> 12Graph A8 Analysis of Insured Populati<strong>on</strong>, 2008 21Graph B1 Number of Recip<strong>ie</strong>nts of State Pensi<strong>on</strong>s, 2000 to <strong>2009</strong> 27Graph C1 Number of Recip<strong>ie</strong>nts of One-Parent Family Payment by Age and Sex, <strong>2009</strong> 35Graph D1 Number of Famil<strong>ie</strong>s receiving Child Benefit by Number of Child Beneficiar<strong>ie</strong>s, 2000to <strong>2009</strong>Graph E1 Number of Recip<strong>ie</strong>nts of Carer’s Allowance by Sex, 2000 to <strong>2009</strong> 50Graph F1 Expenditure <strong>on</strong> Jobseeker’s Benefit and Jobseeker’s Allowance, 2000 to <strong>2009</strong> 64Graph F2 Number of People <strong>on</strong> the Live Register by Age and Sex, <strong>2009</strong> 66Graph F3 Number of People <strong>on</strong> the Live Register in October <strong>2009</strong>, by Sex and Durati<strong>on</strong> 68Graph G1 Expenditure <strong>on</strong> Employment Supports, 2000 to <strong>2009</strong> 73Graph H1 Expenditure <strong>on</strong> Supplementary <strong>Welfare</strong> Allowance Scheme, 2000 to <strong>2009</strong> 81Graph J1 Expenditure <strong>on</strong> Household Benefits, Free Travel and Fuel Allowances, <strong>2009</strong> 94Graph J2 Number of Recip<strong>ie</strong>nts of <strong>Social</strong> <strong>Welfare</strong> Payments by Method of Payment, <strong>2009</strong> 97Graph J3 Pers<strong>on</strong>al Public Service Numbers Issued, 2000 to <strong>2009</strong> 9743xv<str<strong>on</strong>g>Statistical</str<strong>on</strong>g> <str<strong>on</strong>g>Informati<strong>on</strong></str<strong>on</strong>g> <strong>on</strong> <strong>Social</strong> <strong>Welfare</strong> <strong>Services</strong> <strong>2009</strong>
- Page 6 and 7: older preface people from the minis
- Page 8 and 9: older summary introduction people a
- Page 10 and 11: older réamhrá peopleRéamhráCúr
- Page 12 and 13: older summary list of people tables
- Page 14 and 15: older summary list of people tables
- Page 18 and 19: xviStatistical <st
- Page 20 and 21: older summary people and financialS
- Page 22 and 23: older summary people and financialT
- Page 24 and 25: older summary people and financialT
- Page 26 and 27: older summary people and financialG
- Page 28 and 29: older summary people and financialT
- Page 30 and 31: older summary people and financialG
- Page 32 and 33: older summary people and financialT
- Page 34 and 35: older summary people and financialT
- Page 36 and 37: older summary people and financialT
- Page 38 and 39: older summary people and financialT
- Page 40 and 41: older summary people and financialT
- Page 42 and 43: older summary people and financialT
- Page 44 and 45: older peopleSection B: Older People
- Page 46 and 47: older peopleTable B2: Expenditure o
- Page 48 and 49: older peopleTable B5: Number of Rec
- Page 50 and 51: 32Statistical <str
- Page 52 and 53: widows, widowers andone parent fami
- Page 54 and 55: widows, widowers andone parent fami
- Page 56 and 57: widows, widowers andone parent fami
- Page 58 and 59: widows, widowers andone parent fami
- Page 60 and 61: child related paymentsSection D: Ch
- Page 62 and 63: child related paymentsTable D3: Exp
- Page 64 and 65: child related payments46Table D9: N
- Page 66 and 67:
child related paymentsTable D11: Nu
- Page 68 and 69:
illness, disability and caringSecti
- Page 70 and 71:
illness, disability and caringTable
- Page 72 and 73:
illness, disability and caringTable
- Page 74 and 75:
illness, disability and caringTable
- Page 76 and 77:
illness, disability and caringTable
- Page 78 and 79:
illness, disability and caring60Tab
- Page 80 and 81:
jobseeker’s supportsSection F: Jo
- Page 82 and 83:
jobseeker’s supportsGraph F1: Exp
- Page 84 and 85:
jobseeker’s supportsTable F8: Num
- Page 86 and 87:
jobseeker’s supportsTable F10: Nu
- Page 88 and 89:
jobseeker’s supports70Table F14:
- Page 90 and 91:
employment supportsSection G: Emplo
- Page 92 and 93:
employment supportsTable G2: Expend
- Page 94 and 95:
employment supportsTable G8: Number
- Page 96 and 97:
employment supportsTable G14: Numbe
- Page 98 and 99:
supplementary welfare allowanceSect
- Page 100 and 101:
supplementary welfare allowanceTabl
- Page 102 and 103:
supplementary welfare allowance84Ta
- Page 104 and 105:
supplementary welfare allowanceTabl
- Page 106 and 107:
supplementary welfare allowance88Ta
- Page 108 and 109:
supplementary welfare allowance90Ta
- Page 110 and 111:
supplementary welfare allowanceTabl
- Page 112 and 113:
miscellaneous payments and grantsSe
- Page 114 and 115:
miscellaneous payments and grantsTa
- Page 116 and 117:
miscellaneous payments and grantsTa
- Page 118 and 119:
100APPENDICESStatistical</s
- Page 120 and 121:
appendix 1Appendix 1: Social Insura
- Page 122 and 123:
appendix 3Appendix 3: GlossaryRecip
- Page 124:
older summary people and financial1


