jobseeker’s supportsGraph F1: Expenditure <strong>on</strong> Jobseeker’s Benefit and Jobseeker’s Allowance, 2000 to <strong>2009</strong>4,000,0003,500,0003,000,0002,500,0000002,000,0001,500,0001,000,000500,00002000 2001 2002 2003 2004 2005 2006 2007 2008 <strong>2009</strong>Jobseeker's Benefit Jobseeker's Allowance Total64Table F4: Number of Recip<strong>ie</strong>nts of Jobseeker’s Benefit and Jobseeker’s Allowance byNumber of Dependants, <strong>2009</strong>Number of Recip<strong>ie</strong>ntsJobseeker’sBenefitJobseeker’sAllowancePers<strong>on</strong>al Rate <strong>on</strong>ly 126,730 145,893 272,623With Qualif<strong>ie</strong>d Adult <strong>on</strong>ly 6,214 12,609 18,8231 full rate Qualif<strong>ie</strong>d Child 5,773 11,949 17,7222 full rate Qualif<strong>ie</strong>d Children 5,247 11,314 16,5613 full rate Qualif<strong>ie</strong>d Children 2,509 6,595 9,1044 full rate Qualif<strong>ie</strong>d Children 806 2,826 3,6325 full rate Qualif<strong>ie</strong>d Children 168 1,005 1,1736+full rate Qualif<strong>ie</strong>d Children 66 597 6631 half rate Qualif<strong>ie</strong>d Child 5,716 4,269 9,9852 half rate Qualif<strong>ie</strong>d Children 4,634 3,488 8,1223 half rate Qualif<strong>ie</strong>d Children 1,754 1,718 3,4724 half rate Qualif<strong>ie</strong>d Children 423 676 1,0995 half rate Qualif<strong>ie</strong>d Children 59 215 2746+ half rate Qualif<strong>ie</strong>d Children 23 94 117Total Number of Recip<strong>ie</strong>nts 160,122 203,248 363,370Number of Recip<strong>ie</strong>nts with a Qualif<strong>ie</strong>d Adult 18,281 44,050 62,331Percentage of Recip<strong>ie</strong>nts with a Qualif<strong>ie</strong>d Adult 11.4% 21.7% 17.2%Number of Recip<strong>ie</strong>nts with Qualif<strong>ie</strong>d Children 27,178 44,746 71,924Percentage of Recip<strong>ie</strong>nts with Qualif<strong>ie</strong>d Children 17.0% 22.0% 19.8%Total Number of Children (1) 50,656 95,454 146,110(1) A Qualif<strong>ie</strong>d Child Increase is payable at half rate where a spouse, living with the recip<strong>ie</strong>nt, is not a Qualif<strong>ie</strong>d Adult. Each spouse may receive half theQualif<strong>ie</strong>d Child Increase where both are in receipt of a social welfare payment. This can result in some double counting of the actual number of Qualif<strong>ie</strong>dChildren.Total<str<strong>on</strong>g>Statistical</str<strong>on</strong>g> <str<strong>on</strong>g>Informati<strong>on</strong></str<strong>on</strong>g> <strong>on</strong> <strong>Social</strong> <strong>Welfare</strong> <strong>Services</strong> <strong>2009</strong>
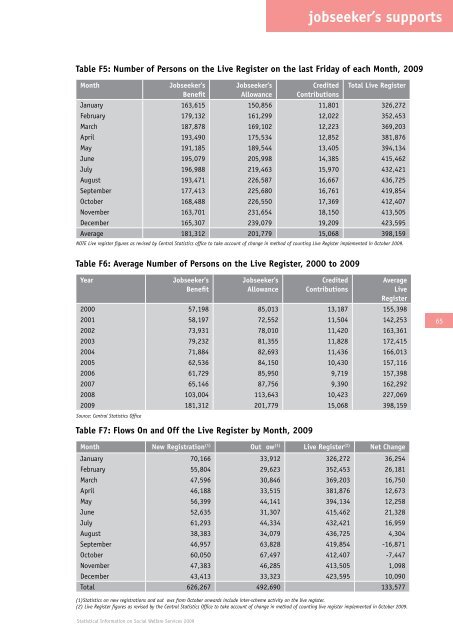
jobseeker’s supportsTable F5: Number of Pers<strong>on</strong>s <strong>on</strong> the Live Register <strong>on</strong> the last Friday of each M<strong>on</strong>th, <strong>2009</strong>M<strong>on</strong>thJobseeker’sBenefitJobseeker’sAllowanceCreditedC<strong>on</strong>tributi<strong>on</strong>sTotal Live RegisterJanuary 163,615 150,856 11,801 326,272February 179,132 161,299 12,022 352,453March 187,878 169,102 12,223 369,203April 193,490 175,534 12,852 381,876May 191,185 189,544 13,405 394,134June 195,079 205,998 14,385 415,462July 196,988 219,463 15,970 432,421August 193,471 226,587 16,667 436,725September 177,413 225,680 16,761 419,854October 168,488 226,550 17,369 412,407November 163,701 231,654 18,150 413,505December 165,307 239,079 19,209 423,595Average 181,312 201,779 15,068 398,159NOTE Live register figures as revised by Central Statistics office to take account of change in method of counting Live Register implemented in October <strong>2009</strong>.Table F6: Average Number of Pers<strong>on</strong>s <strong>on</strong> the Live Register, 2000 to <strong>2009</strong>YearJobseeker’sBenefitJobseeker’sAllowanceCreditedC<strong>on</strong>tributi<strong>on</strong>sAverageLiveRegister2000 57,198 85,013 13,187 155,3982001 58,197 72,552 11,504 142,2532002 73,931 78,010 11,420 163,3612003 79,232 81,355 11,828 172,4152004 71,884 82,693 11,436 166,0132005 62,536 84,150 10,430 157,1162006 61,729 85,950 9,719 157,3982007 65,146 87,756 9,390 162,2922008 103,004 113,643 10,423 227,069<strong>2009</strong> 181,312 201,779 15,068 398,159Source: Central Statistics Office65Table F7: Flows On and Off the Live Register by M<strong>on</strong>th, <strong>2009</strong>M<strong>on</strong>th New Registrati<strong>on</strong> (1) Outflow (1) Live Register (2) Net ChangeJanuary 70,166 33,912 326,272 36,254February 55,804 29,623 352,453 26,181March 47,596 30,846 369,203 16,750April 46,188 33,515 381,876 12,673May 56,399 44,141 394,134 12,258June 52,635 31,307 415,462 21,328July 61,293 44,334 432,421 16,959August 38,383 34,079 436,725 4,304September 46,957 63,828 419,854 -16,871October 60,050 67,497 412,407 -7,447November 47,383 46,285 413,505 1,098December 43,413 33,323 423,595 10,090Total 626,267 492,690 133,577(1)Statistics <strong>on</strong> new registrati<strong>on</strong>s and outflows from October <strong>on</strong>wards include inter-scheme activity <strong>on</strong> the live register.(2) Live Register figures as revised by the Central Statistics Office to take account of change in method of counting live register implemented in October <strong>2009</strong>.<str<strong>on</strong>g>Statistical</str<strong>on</strong>g> <str<strong>on</strong>g>Informati<strong>on</strong></str<strong>on</strong>g> <strong>on</strong> <strong>Social</strong> <strong>Welfare</strong> <strong>Services</strong> <strong>2009</strong>
- Page 6 and 7:
older preface people from the minis
- Page 8 and 9:
older summary introduction people a
- Page 10 and 11:
older réamhrá peopleRéamhráCúr
- Page 12 and 13:
older summary list of people tables
- Page 14 and 15:
older summary list of people tables
- Page 16 and 17:
older summary list of people tables
- Page 18 and 19:
xviStatistical <st
- Page 20 and 21:
older summary people and financialS
- Page 22 and 23:
older summary people and financialT
- Page 24 and 25:
older summary people and financialT
- Page 26 and 27:
older summary people and financialG
- Page 28 and 29:
older summary people and financialT
- Page 30 and 31:
older summary people and financialG
- Page 32 and 33: older summary people and financialT
- Page 34 and 35: older summary people and financialT
- Page 36 and 37: older summary people and financialT
- Page 38 and 39: older summary people and financialT
- Page 40 and 41: older summary people and financialT
- Page 42 and 43: older summary people and financialT
- Page 44 and 45: older peopleSection B: Older People
- Page 46 and 47: older peopleTable B2: Expenditure o
- Page 48 and 49: older peopleTable B5: Number of Rec
- Page 50 and 51: 32Statistical <str
- Page 52 and 53: widows, widowers andone parent fami
- Page 54 and 55: widows, widowers andone parent fami
- Page 56 and 57: widows, widowers andone parent fami
- Page 58 and 59: widows, widowers andone parent fami
- Page 60 and 61: child related paymentsSection D: Ch
- Page 62 and 63: child related paymentsTable D3: Exp
- Page 64 and 65: child related payments46Table D9: N
- Page 66 and 67: child related paymentsTable D11: Nu
- Page 68 and 69: illness, disability and caringSecti
- Page 70 and 71: illness, disability and caringTable
- Page 72 and 73: illness, disability and caringTable
- Page 74 and 75: illness, disability and caringTable
- Page 76 and 77: illness, disability and caringTable
- Page 78 and 79: illness, disability and caring60Tab
- Page 80 and 81: jobseeker’s supportsSection F: Jo
- Page 84 and 85: jobseeker’s supportsTable F8: Num
- Page 86 and 87: jobseeker’s supportsTable F10: Nu
- Page 88 and 89: jobseeker’s supports70Table F14:
- Page 90 and 91: employment supportsSection G: Emplo
- Page 92 and 93: employment supportsTable G2: Expend
- Page 94 and 95: employment supportsTable G8: Number
- Page 96 and 97: employment supportsTable G14: Numbe
- Page 98 and 99: supplementary welfare allowanceSect
- Page 100 and 101: supplementary welfare allowanceTabl
- Page 102 and 103: supplementary welfare allowance84Ta
- Page 104 and 105: supplementary welfare allowanceTabl
- Page 106 and 107: supplementary welfare allowance88Ta
- Page 108 and 109: supplementary welfare allowance90Ta
- Page 110 and 111: supplementary welfare allowanceTabl
- Page 112 and 113: miscellaneous payments and grantsSe
- Page 114 and 115: miscellaneous payments and grantsTa
- Page 116 and 117: miscellaneous payments and grantsTa
- Page 118 and 119: 100APPENDICESStatistical</s
- Page 120 and 121: appendix 1Appendix 1: Social Insura
- Page 122 and 123: appendix 3Appendix 3: GlossaryRecip
- Page 124: older summary people and financial1