Annual Report 2012 - The Australian Property Institute
Annual Report 2012 - The Australian Property Institute
Annual Report 2012 - The Australian Property Institute

You also want an ePaper? Increase the reach of your titles
YUMPU automatically turns print PDFs into web optimized ePapers that Google loves.
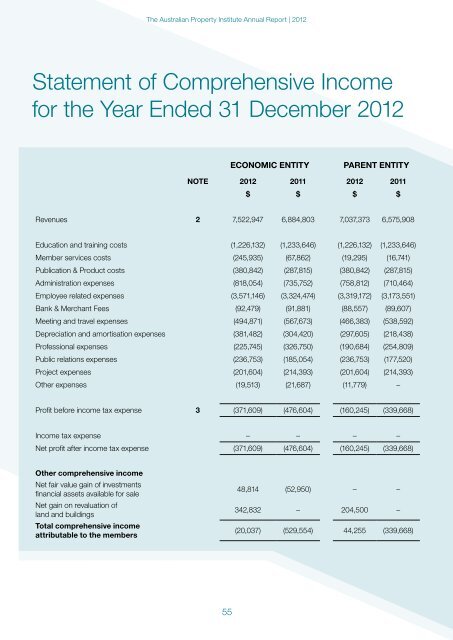
<strong>The</strong> <strong>Australian</strong> <strong>Property</strong> <strong>Institute</strong> <strong>Annual</strong> <strong>Report</strong> | <strong>2012</strong>Statement of Comprehensive Incomefor the Year Ended 31 December <strong>2012</strong>ECONOMIC ENTITYPARENT ENTITYNOTE <strong>2012</strong> 2011 <strong>2012</strong> 2011$ $ $ $Revenues 2 7,522,947 6,884,803 7,037,373 6,575,908Education and training costs (1,226,132) (1,233,646) (1,226,132) (1,233,646)Member services costs (245,935) (67,862) (19,295) (16,741)Publication & Product costs (380,842) (287,815) (380,842) (287,815)Administration expenses (818,054) (735,752) (758,812) (710,464)Employee related expenses (3,571,146) (3,324,474) (3,319,172) (3,173,551)Bank & Merchant Fees (92,479) (91,881) (88,557) (89,607)Meeting and travel expenses (494,871) (567,673) (466,383) (538,592)Depreciation and amortisation expenses (381,482) (304,420) (297,605) (218,438)Professional expenses (225,745) (326,750) (190,684) (254,809)Public relations expenses (236,753) (185,054) (236,753) (177,520)Project expenses (201,604) (214,393) (201,604) (214,393)Other expenses (19,513) (21,687) (11,779) –Profit before income tax expense 3 (371,609) (476,604) (160,245) (339,668)Income tax expense – – – –Net profit after income tax expense (371,609) (476,604) (160,245) (339,668)Other comprehensive incomeNet fair value gain of investmentsfinancial assets available for saleNet gain on revaluation ofland and buildingsTotal comprehensive incomeattributable to the members48,814 (52,950) – –342,832 – 204,500 –(20,037) (529,554) 44,255 (339,668)55