Annual Report 2012 - The Australian Property Institute
Annual Report 2012 - The Australian Property Institute
Annual Report 2012 - The Australian Property Institute

You also want an ePaper? Increase the reach of your titles
YUMPU automatically turns print PDFs into web optimized ePapers that Google loves.
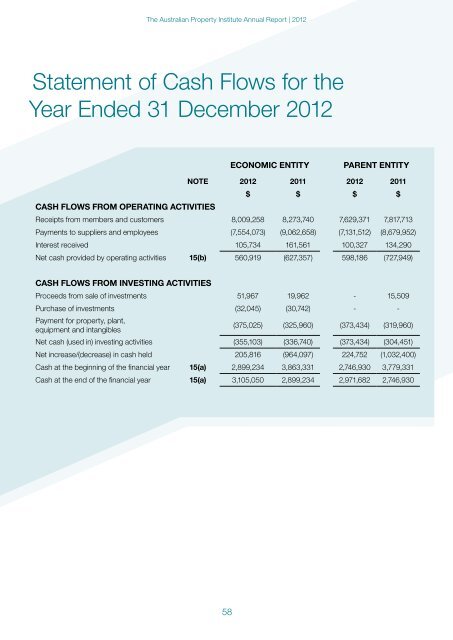
<strong>The</strong> <strong>Australian</strong> <strong>Property</strong> <strong>Institute</strong> <strong>Annual</strong> <strong>Report</strong> | <strong>2012</strong>Statement of Cash Flows for theYear Ended 31 December <strong>2012</strong>ECONOMIC ENTITYPARENT ENTITYNOTE <strong>2012</strong> 2011 <strong>2012</strong> 2011$ $ $ $CASH FLOWS FROM OPERATING ACTIVITIESReceipts from members and customers 8,009,258 8,273,740 7,629,371 7,817,713Payments to suppliers and employees (7,554,073) (9,062,658) (7,131,512) (8,679,952)Interest received 105,734 161,561 100,327 134,290Net cash provided by operating activities 15(b) 560,919 (627,357) 598,186 (727,949)CASH FLOWS FROM INVESTING ACTIVITIESProceeds from sale of investments 51,967 19,962 - 15,509Purchase of investments (32,045) (30,742) - -Payment for property, plant,equipment and intangibles(375,025) (325,960) (373,434) (319,960)Net cash (used in) investing activities (355,103) (336,740) (373,434) (304,451)Net increase/(decrease) in cash held 205,816 (964,097) 224,752 (1,032,400)Cash at the beginning of the financial year 15(a) 2,899,234 3,863,331 2,746,930 3,779,331Cash at the end of the financial year 15(a) 3,105,050 2,899,234 2,971,682 2,746,93058