- Page 2 and 3: ContributorsDescription and Analysi
- Page 4 and 5: Literacy Trends in PakistanUNESCO O
- Page 6 and 7: Part I - An Analysis of Literacy Tr
- Page 8 and 9: Part II Statistical Tables (Based o
- Page 10 and 11: an education that includes learning
- Page 12 and 13: district. This information on liter
- Page 14 and 15: In the present day context, when pa
- Page 16 and 17: 7. FUNCTIONAL LITERACYThe definitio
- Page 18 and 19: Middle Level (Level II)A) TARGET GR
- Page 20 and 21: Table - 3Comparison of Pakistan wit
- Page 22 and 23: Previous attempts made for the enha
- Page 24 and 25: 11. CURRENT LITERACY SITUATION IN P
- Page 26 and 27: Graph No. 1Growth of Literacy Rate
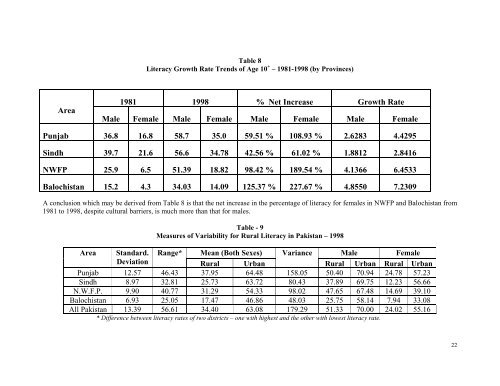
- Page 28 and 29: Table 7 below indicates the highest
- Page 32 and 33: District has progressed from a very
- Page 34 and 35: Table 11Districts in Various Litera
- Page 36 and 37: 13.2 Public Expenditure on Primary
- Page 38 and 39: lowest female literacy rate in Paki
- Page 40 and 41: All this suggests that a considerab
- Page 42 and 43: Graph No.4LITERACY RATE DIRECTLY EF
- Page 44 and 45: 16. LITERACY AND NATIONAL PLAN OF A
- Page 46 and 47: 17.1 Why has it been established?Th
- Page 48 and 49: Table 16 - Focus Areas and Key Stra
- Page 50 and 51: 17.5 Resource MobilizationThe Liter
- Page 52 and 53: PART - IIStatistical Tables(Based o
- Page 57: Table IILiteracy Rates (10 Years &
- Page 62: Growth RateYearsAll Areas Urban Rur
- Page 66 and 67: N.W.F.P.1972 15.50 23.10 4.701981 1
- Page 71 and 72: Table VLiteracy Rates (10 Years & a
- Page 74 and 75: Table VI-ADistrict-wise Rate (10 Ye
- Page 76 and 77: Province/DistrictBoth Male Female B
- Page 78 and 79: Province/DistrictBoth Male Female B
- Page 80 and 81:
Province/DistrictBoth Male Female B
- Page 82 and 83:
All Areas Urban RuralProvince/Distr
- Page 84 and 85:
All Areas Urban RuralProvince/Distr
- Page 86 and 87:
Table VI-DDistrict-wise Rate of Lit
- Page 88 and 89:
All Areas Urban RuralProvince/Distr
- Page 90 and 91:
All Areas Urban RuralProvince/Distr
- Page 92 and 93:
Table VI-BDistrict-wise Rate of Lit
- Page 94 and 95:
Province/DistrictHyderabadBadinThat
- Page 96 and 97:
Province/DistrictKarachi SouthKarac
- Page 98 and 99:
All AreasUrbanRuralProvince/Distric
- Page 100 and 101:
All Areas Urban RuralProvince/Distr
- Page 102 and 103:
All Areas Urban RuralProvince/Distr
- Page 105 and 106:
Table VII-CDistrict-wise Rate of Li
- Page 107 and 108:
All Areas Urban RuralProvince/Distr
- Page 109 and 110:
Table VII-BDistrict-wise Rate of Li
- Page 111 and 112:
All Areas Urban RuralProvince/Distr
- Page 113 and 114:
IlliterateLiterate Matric & above D
- Page 115 and 116:
Illiterate Literate Matric & above
- Page 117 and 118:
Table VIII-BLinkage between Literac
- Page 119 and 120:
IlliterateLiterate Matric & above D
- Page 121 and 122:
IlliterateLiterate Matric & above D
- Page 123 and 124:
Illiterate Literate Matric & above
- Page 125 and 126:
Table VIII-DLinkage between Literac
- Page 127 and 128:
IlliterateLiterate Matric & above D
- Page 129 and 130:
Table IX-ADistrict-wise Participati
- Page 131 and 132:
Province/District/ Population Schoo
- Page 133 and 134:
Province/District/ Population Schoo
- Page 135 and 136:
Province/District/ Population Schoo
- Page 137 and 138:
Table IX-DDistrict-wise i i Partici
- Page 139 and 140:
Table X-CDistrict-wise Participatio
- Page 141 and 142:
Province/District/ All Areas Urban
- Page 143 and 144:
Province/District/ All Areas Urban
- Page 145 and 146:
Table X-DDistrict-wise Participatio
- Page 147 and 148:
ProvincelDistrictl All Areas Urban
- Page 149 and 150:
Province/District/ All Areas Urban
- Page 151 and 152:
ProvincelDistrictl All Areas Urban
- Page 153 and 154:
BIBLIOGRAPHYAdam Curle. Planning fo
- Page 155:
Formulae used for Calculating the G