

annual report 2007 - the Admiral Group plc
annual report 2007 - the Admiral Group plc
annual report 2007 - the Admiral Group plc

Create successful ePaper yourself
Turn your PDF publications into a flip-book with our unique Google optimized e-Paper software.
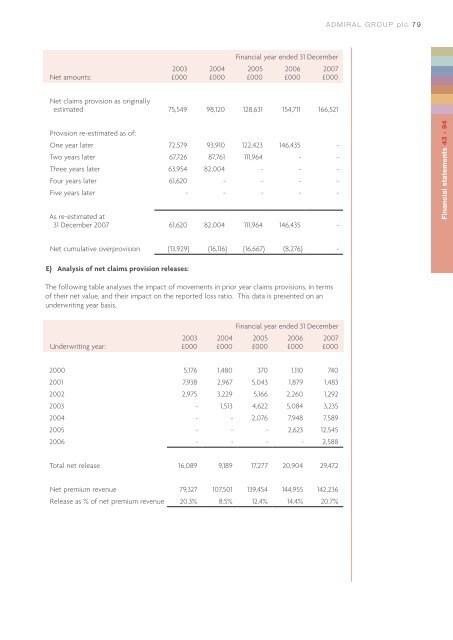
ADMIRAL GROUP <strong>plc</strong> 79Financial year ended 31 DecemberNet amounts:2003£0002004£0002005£0002006£000<strong>2007</strong>£000Net claims provision as originallyestimated 75,549 98,120 128,631 154,711 166,521Provision re-estimated as of:One year later 72,579 93,910 122,423 146,435 -Two years later 67,726 87,761 111,964 - -Three years later 63,954 82,004 - - -Four years later 61,620 - - - -Five years later - - - - -As re-estimated at31 December <strong>2007</strong> 61,620 82,004 111,964 146,435 -Financial statements 43 - 94Net cumulative overprovision (13,929) (16,116) (16,667) (8,276) -E) Analysis of net claims provision releases:The following table analyses <strong>the</strong> impact of movements in prior year claims provisions, in termsof <strong>the</strong>ir net value, and <strong>the</strong>ir impact on <strong>the</strong> <strong>report</strong>ed loss ratio. This data is presented on anunderwriting year basis.Underwriting year:2003£0002004£000Financial year ended 31 December2005£0002006£000<strong>2007</strong>£0002000 5,176 1,480 370 1,110 7402001 7,938 2,967 5,043 1,879 1,4832002 2,975 3,229 5,166 2,260 1,2922003 - 1,513 4,622 5,084 3,2352004 - - 2,076 7,948 7,5892005 - - - 2,623 12,5452006 - - - - 2,588Total net release 16,089 9,189 17,277 20,904 29,472Net premium revenue 79,327 107,501 139,454 144,955 142,236Release as % of net premium revenue 20.3% 8.5% 12.4% 14.4% 20.7%


