E. Sturkell et al. / Journal of <strong>Volcano</strong>logy <strong>and</strong> Geothermal Research 150 (2006) 14–34 23<strong>and</strong> Grímsvötn volcanoes (Fig. 1). This eruption fissurewas termed Gjálp (Gudmundsson et al., 1997).The eruption began on a 7 km long N–S fissure after36 h of <strong>in</strong>tense seismic activity at Bárðarbunga. Theseismicity propagated towards the eruption site suggest<strong>in</strong>gthat the eruption was fed from Bárðarbunga(E<strong>in</strong>arsson et al., 1997). The eruptive products werebasaltic <strong>and</strong>esites, different from recent eruptive productsof both Bárðarbunga <strong>and</strong> Grímsvötn. The similarityof the isotope characteristics with those ofGrímsvötn has led to suggestions that the eruptionwas fed by Grímsvötn volcano (Sigmarsson et al.,2000). The eruption lasted for thirteen days. In earlyNovember a jökulhlaup of approximately 3.8 km 3 ofmeltwater was released over Skeiðarárs<strong>and</strong>ur, shown<strong>in</strong> Fig. 1 (Gudmundsson et al., 1997).3.5. HeklaHekla volcano has had 18 summit eruptions <strong>and</strong>five <strong>in</strong> its direct surround<strong>in</strong>gs dur<strong>in</strong>g historic time,the last 1100 years. Precursory events have beendetected prior to recent eruptions. Generally, eruptionrelated earthquakes beg<strong>in</strong> less than two hours beforethe eruption starts (Soosalu et al., <strong>in</strong> press). Heklawas the first volcano <strong>in</strong> Icel<strong>and</strong> to be studied by alocal GPS-network. Measurements before <strong>and</strong> afterthe 1991 eruption revealed contraction towards thevolcano (Sigmundsson et al., 1992). The data suggesteda <strong>magma</strong> reservoir at 9 km depth, but uncerta<strong>in</strong>tieson this estimate were large because ofabsence of GPS stations close to the volcano (theclosest be<strong>in</strong>g at about 13 km distance). Measurementsprior to the 2000 eruption were conducted <strong>in</strong>1996. After the eruption measurements have beenconducted annually at selected po<strong>in</strong>ts. The 1996–2000 displacement reveal clearly deformation associatedwith the feeder dyke for the 2000 eruption(amount<strong>in</strong>g to several tens of cm). Further modell<strong>in</strong>gof these data are needed, <strong>in</strong> particular to constra<strong>in</strong>eventual <strong>in</strong>flation/deflation cycle at the volcano. GPSdata comb<strong>in</strong>ed with all other geodetic data fromHekla, <strong>in</strong>clud<strong>in</strong>g InSAR <strong>and</strong> optical level<strong>in</strong>g tilt hasthe potential to provide improved constra<strong>in</strong>ts on the<strong>magma</strong> plumb<strong>in</strong>g system under Hekla (Sigmundssonet al., 2001).Cont<strong>in</strong>uous monitor<strong>in</strong>g of crustal deformation <strong>in</strong>the South Icel<strong>and</strong> seismic zone (<strong>in</strong>clud<strong>in</strong>g Hekla) isdone by six cont<strong>in</strong>uously record<strong>in</strong>g borehole stra<strong>in</strong>metersoperated by the Icel<strong>and</strong>ic MeteorologicalOffice. The permanent stra<strong>in</strong>meters are located 15–45 km from Hekla <strong>and</strong> gave a clear stra<strong>in</strong> signalprior to the eruptions of 1991 <strong>and</strong> 2000 (Fig. 10).The closest volumetric stra<strong>in</strong> meter (15 km distance,at Búrfell <strong>in</strong> BUR <strong>in</strong> Fig. 10) detected compressiondue to dyke <strong>in</strong>jection 30 m<strong>in</strong> before <strong>magma</strong> reachedthe surface <strong>and</strong> the eruption started on February 26,2000 (Fig. 10). However, it had long been suspectedthat large stra<strong>in</strong> excursions at BUR were accompaniedby localized recovery, which may bias estimatesof <strong>magma</strong> source depth. This was confirmed bystra<strong>in</strong> records for the Mw 6.5 South Icel<strong>and</strong> earthquakes(the first occurr<strong>in</strong>g on 17 June <strong>and</strong> the secondon 21 June, 2000). The orig<strong>in</strong>al <strong>in</strong>terpretation ofthe stra<strong>in</strong> data at BUR associated with the 1991 <strong>and</strong>2000 eruptions of Hekla gave too shallow a sourcedepth. By consider<strong>in</strong>g the localized stra<strong>in</strong> recovery,Jónsson et al. (2003) prefer a deeper location thanthe 6.5 km suggested by L<strong>in</strong>de et al. (1993) for the<strong>magma</strong> source. The most recent estimate based onre-<strong>in</strong>terpretation of stra<strong>in</strong> data places the <strong>magma</strong>chamber at 11 km depth (Kristján Ágústsson pers.com. 2004). Despite these complications, the comb<strong>in</strong>ationof seismic <strong>and</strong> volumetric stra<strong>in</strong> monitor<strong>in</strong>ghas given strong evidence of <strong>magma</strong> propagationtowards the Earth’s surface <strong>and</strong> was used to issuea warn<strong>in</strong>g prior to the 2000 eruption.Seven short level<strong>in</strong>g arrays (bdry-tiltQ stations)are surveyed repeatedly around Hekla. The beststation, Næfurholt, is located 11 km west of thesummit, allow<strong>in</strong>g for easy monitor<strong>in</strong>g of E–W tilt.The tilt signal from the Næfurholt station is rathersmall but is still significant (Fig. 11). It suggests<strong>in</strong>flation beg<strong>in</strong>n<strong>in</strong>g directly after the 1991 <strong>and</strong> 2000eruptions. Eastward upward tilt generally <strong>in</strong>creaseswith time, as the volcano builds up pressure for thenext eruption, when a co-eruptive pressure decreaseoccurs. The most recent measurement (18 Nov.2004) of the tilt station at Næfurholt shows upwardtilt towards Hekla (Fig. 11). The east component<strong>in</strong>dicates that a pressure <strong>in</strong>crease under the volcanois of the same scale as prior to the 1991 <strong>and</strong> 2000eruptions. It should be po<strong>in</strong>ted out that one tiltstation gives only an <strong>in</strong>dication of possible <strong>magma</strong>accumulation under a volcano, <strong>and</strong> it should spursome additional measurements.
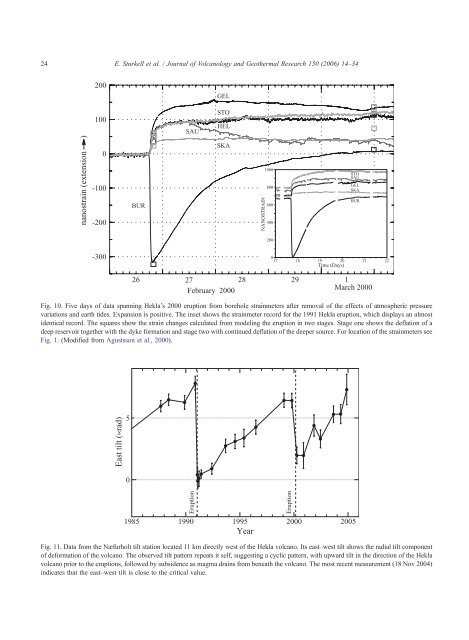
24E. Sturkell et al. / Journal of <strong>Volcano</strong>logy <strong>and</strong> Geothermal Research 150 (2006) 14–34200GEL100SAU<strong>ST</strong>OHELnanostra<strong>in</strong> (extension )0-100-200BURSKANANO<strong>ST</strong>RAIN1000800600400<strong>ST</strong>OSAUGELSKABUR200-3000 17 18 19 20 21 22Time (Days)26 27 28 29 1February 2000March 2000Fig. 10. Five days of data spann<strong>in</strong>g Hekla’s 2000 eruption from borehole stra<strong>in</strong>meters after removal of the effects of atmospheric pressurevariations <strong>and</strong> earth tides. Expansion is positive. The <strong>in</strong>set shows the stra<strong>in</strong>meter record for the 1991 Hekla eruption, which displays an almostidentical record. The squares show the stra<strong>in</strong> changes calculated from model<strong>in</strong>g the eruption <strong>in</strong> two stages. Stage one shows the deflation of adeep reservoir together with the dyke formation <strong>and</strong> stage two with cont<strong>in</strong>ued deflation of the deeper source. For location of the stra<strong>in</strong>meters seeFig. 1. (Modified from Agustsson et al., 2000).East tilt (µrad)50Eruption1985 1990 1995 2000 2005YearFig. 11. Data from the Næfurholt tilt station located 11 km directly west of the Hekla volcano. Its east–west tilt shows the radial tilt componentof deformation of the volcano. The observed tilt pattern repeats it self, suggest<strong>in</strong>g a cyclic pattern, with upward tilt <strong>in</strong> the direction of the Heklavolcano prior to the eruptions, followed by subsidence as <strong>magma</strong> dra<strong>in</strong>s from beneath the volcano. The most recent measurement (18 Nov 2004)<strong>in</strong>dicates that the east–west tilt is close to the critical value.Eruption