Volcano geodesy and magma dynamics in Iceland - Acri-ST
Volcano geodesy and magma dynamics in Iceland - Acri-ST
Volcano geodesy and magma dynamics in Iceland - Acri-ST

Create successful ePaper yourself
Turn your PDF publications into a flip-book with our unique Google optimized e-Paper software.
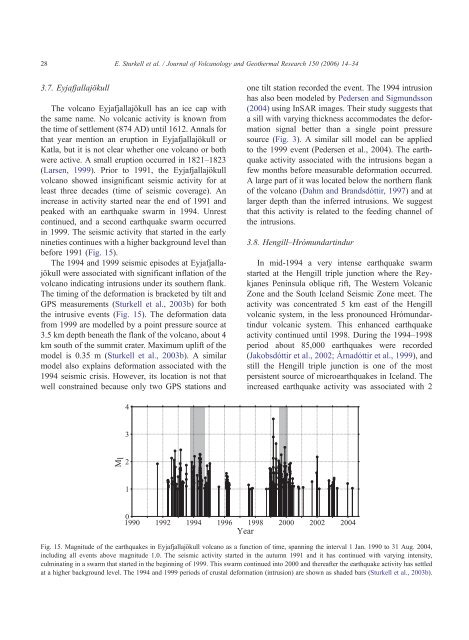
28E. Sturkell et al. / Journal of <strong>Volcano</strong>logy <strong>and</strong> Geothermal Research 150 (2006) 14–343.7. EyjafjallajökullThe volcano Eyjafjallajökull has an ice cap withthe same name. No volcanic activity is known fromthe time of settlement (874 AD) until 1612. Annals forthat year mention an eruption <strong>in</strong> Eyjafjallajökull orKatla, but it is not clear whether one volcano or bothwere active. A small eruption occurred <strong>in</strong> 1821–1823(Larsen, 1999). Prior to 1991, the Eyjafjallajökullvolcano showed <strong>in</strong>significant seismic activity for atleast three decades (time of seismic coverage). An<strong>in</strong>crease <strong>in</strong> activity started near the end of 1991 <strong>and</strong>peaked with an earthquake swarm <strong>in</strong> 1994. Unrestcont<strong>in</strong>ued, <strong>and</strong> a second earthquake swarm occurred<strong>in</strong> 1999. The seismic activity that started <strong>in</strong> the earlyn<strong>in</strong>eties cont<strong>in</strong>ues with a higher background level thanbefore 1991 (Fig. 15).The 1994 <strong>and</strong> 1999 seismic episodes at Eyjafjallajökullwere associated with significant <strong>in</strong>flation of thevolcano <strong>in</strong>dicat<strong>in</strong>g <strong>in</strong>trusions under its southern flank.The tim<strong>in</strong>g of the deformation is bracketed by tilt <strong>and</strong>GPS measurements (Sturkell et al., 2003b) for boththe <strong>in</strong>trusive events (Fig. 15). The deformation datafrom 1999 are modelled by a po<strong>in</strong>t pressure source at3.5 km depth beneath the flank of the volcano, about 4km south of the summit crater. Maximum uplift of themodel is 0.35 m (Sturkell et al., 2003b). A similarmodel also expla<strong>in</strong>s deformation associated with the1994 seismic crisis. However, its location is not thatwell constra<strong>in</strong>ed because only two GPS stations <strong>and</strong>one tilt station recorded the event. The 1994 <strong>in</strong>trusionhas also been modeled by Pedersen <strong>and</strong> Sigmundsson(2004) us<strong>in</strong>g InSAR images. Their study suggests thata sill with vary<strong>in</strong>g thickness accommodates the deformationsignal better than a s<strong>in</strong>gle po<strong>in</strong>t pressuresource (Fig. 3). A similar sill model can be appliedto the 1999 event (Pedersen et al., 2004). The earthquakeactivity associated with the <strong>in</strong>trusions began afew months before measurable deformation occurred.A large part of it was located below the northern flankof the volcano (Dahm <strong>and</strong> Br<strong>and</strong>sdóttir, 1997) <strong>and</strong> atlarger depth than the <strong>in</strong>ferred <strong>in</strong>trusions. We suggestthat this activity is related to the feed<strong>in</strong>g channel ofthe <strong>in</strong>trusions.3.8. Hengill–Hrómundart<strong>in</strong>durIn mid-1994 a very <strong>in</strong>tense earthquake swarmstarted at the Hengill triple junction where the ReykjanesPen<strong>in</strong>sula oblique rift, The Western VolcanicZone <strong>and</strong> the South Icel<strong>and</strong> Seismic Zone meet. Theactivity was concentrated 5 km east of the Hengillvolcanic system, <strong>in</strong> the less pronounced Hrómundart<strong>in</strong>durvolcanic system. This enhanced earthquakeactivity cont<strong>in</strong>ued until 1998. Dur<strong>in</strong>g the 1994–1998period about 85,000 earthquakes were recorded(Jakobsdóttir et al., 2002; Árnadóttir et al., 1999), <strong>and</strong>still the Hengill triple junction is one of the mostpersistent source of microearthquakes <strong>in</strong> Icel<strong>and</strong>. The<strong>in</strong>creased earthquake activity was associated with 243M l2101990 1992 1994 1996 1998 2000 2002 2004YearFig. 15. Magnitude of the earthquakes <strong>in</strong> Eyjafjallajökull volcano as a function of time, spann<strong>in</strong>g the <strong>in</strong>terval 1 Jan. 1990 to 31 Aug. 2004,<strong>in</strong>clud<strong>in</strong>g all events above magnitude 1.0. The seismic activity started <strong>in</strong> the autumn 1991 <strong>and</strong> it has cont<strong>in</strong>ued with vary<strong>in</strong>g <strong>in</strong>tensity,culm<strong>in</strong>at<strong>in</strong>g <strong>in</strong> a swarm that started <strong>in</strong> the beg<strong>in</strong>n<strong>in</strong>g of 1999. This swarm cont<strong>in</strong>ued <strong>in</strong>to 2000 <strong>and</strong> thereafter the earthquake activity has settledat a higher background level. The 1994 <strong>and</strong> 1999 periods of crustal deformation (<strong>in</strong>trusion) are shown as shaded bars (Sturkell et al., 2003b).