Volcano geodesy and magma dynamics in Iceland - Acri-ST
Volcano geodesy and magma dynamics in Iceland - Acri-ST
Volcano geodesy and magma dynamics in Iceland - Acri-ST

Create successful ePaper yourself
Turn your PDF publications into a flip-book with our unique Google optimized e-Paper software.
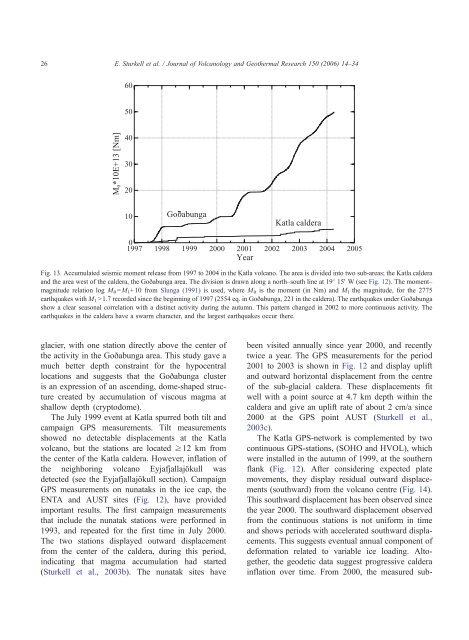
26E. Sturkell et al. / Journal of <strong>Volcano</strong>logy <strong>and</strong> Geothermal Research 150 (2006) 14–346050M 0 *10E+13 [Nm]40302010Go abungaKatla caldera01997 1998 1999 2000 2001 2002 2003 2004 2005YearFig. 13. Accumulated seismic moment release from 1997 to 2004 <strong>in</strong> the Katla volcano. The area is divided <strong>in</strong>to two sub-areas; the Katla caldera<strong>and</strong> the area west of the caldera, the Goðabunga area. The division is drawn along a north–south l<strong>in</strong>e at 198 15V W (see Fig. 12). The moment–magnitude relation log M 0 =M l +10 from Slunga (1991) is used, where M 0 is the moment (<strong>in</strong> Nm) <strong>and</strong> M l the magnitude, for the 2775earthquakes with M 1 N1.7 recorded s<strong>in</strong>ce the beg<strong>in</strong>n<strong>in</strong>g of 1997 (2554 eq. <strong>in</strong> Goðabunga, 221 <strong>in</strong> the caldera). The earthquakes under Goðabungashow a clear seasonal correlation with a dist<strong>in</strong>ct activity dur<strong>in</strong>g the autumn. This pattern changed <strong>in</strong> 2002 to more cont<strong>in</strong>uous activity. Theearthquakes <strong>in</strong> the caldera have a swarm character, <strong>and</strong> the largest earthquakes occur there.glacier, with one station directly above the center ofthe activity <strong>in</strong> the Goðabunga area. This study gave amuch better depth constra<strong>in</strong>t for the hypocentrallocations <strong>and</strong> suggests that the Goðabunga clusteris an expression of an ascend<strong>in</strong>g, dome-shaped structurecreated by accumulation of viscous <strong>magma</strong> atshallow depth (cryptodome).The July 1999 event at Katla spurred both tilt <strong>and</strong>campaign GPS measurements. Tilt measurementsshowed no detectable displacements at the Katlavolcano, but the stations are located z12 km fromthe center of the Katla caldera. However, <strong>in</strong>flation ofthe neighbor<strong>in</strong>g volcano Eyjafjallajökull wasdetected (see the Eyjafjallajökull section). CampaignGPS measurements on nunataks <strong>in</strong> the ice cap, theENTA <strong>and</strong> AU<strong>ST</strong> sites (Fig. 12), have providedimportant results. The first campaign measurementsthat <strong>in</strong>clude the nunatak stations were performed <strong>in</strong>1993, <strong>and</strong> repeated for the first time <strong>in</strong> July 2000.The two stations displayed outward displacementfrom the center of the caldera, dur<strong>in</strong>g this period,<strong>in</strong>dicat<strong>in</strong>g that <strong>magma</strong> accumulation had started(Sturkell et al., 2003b). The nunatak sites havebeen visited annually s<strong>in</strong>ce year 2000, <strong>and</strong> recentlytwice a year. The GPS measurements for the period2001 to 2003 is shown <strong>in</strong> Fig. 12 <strong>and</strong> display uplift<strong>and</strong> outward horizontal displacement from the centreof the sub-glacial caldera. These displacements fitwell with a po<strong>in</strong>t source at 4.7 km depth with<strong>in</strong> thecaldera <strong>and</strong> give an uplift rate of about 2 cm/a s<strong>in</strong>ce2000 at the GPS po<strong>in</strong>t AU<strong>ST</strong> (Sturkell et al.,2003c).The Katla GPS-network is complemented by twocont<strong>in</strong>uous GPS-stations, (SOHO <strong>and</strong> HVOL), whichwere <strong>in</strong>stalled <strong>in</strong> the autumn of 1999, at the southernflank (Fig. 12). After consider<strong>in</strong>g expected platemovements, they display residual outward displacements(southward) from the volcano centre (Fig. 14).This southward displacement has been observed s<strong>in</strong>cethe year 2000. The southward displacement observedfrom the cont<strong>in</strong>uous stations is not uniform <strong>in</strong> time<strong>and</strong> shows periods with accelerated southward displacements.This suggests eventual annual component ofdeformation related to variable ice load<strong>in</strong>g. Altogether,the geodetic data suggest progressive caldera<strong>in</strong>flation over time. From 2000, the measured sub-