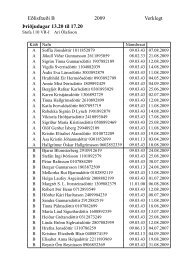
E. Sturkell et al. / Journal of <strong>Volcano</strong>logy <strong>and</strong> Geothermal Research 150 (2006) 14–34 19µrad1000900 20 Dec. 758007006005004003002001000 1975 1976 1977 1978 1979 1980 1981 1982 1983 1984 1985 1986 1987 1988 198926 Sep. 7631 Oct. 7620 Jan. 7727 Apr. 778 Sep. 777 Jan. 7810 Jul. 7810 Nov. 7813 May 7916 Mar. 8010 July 8018 Oct. 8030 Jan. 8118 Nov. 81Fig. 4. Record of the one component water-tube tiltmeter at the Krafla power plant from August 1976 to January 1990. Data before August 1976orig<strong>in</strong>ate from level<strong>in</strong>g measurements of the power plant foundation. The water-tube tiltmeter was <strong>in</strong>stalled along the longer wall of the powerplant build<strong>in</strong>g that is orientated N138 E. The figure is modified after Tryggvason (1995). The stars mark eruptions.4 Sep. 84velocity with<strong>in</strong> the Krafla caldera (E<strong>in</strong>arsson, 1978;Br<strong>and</strong>sdóttir et al., 1997). Several l<strong>in</strong>es of evidencesuggest a deeper <strong>magma</strong> chamber at Krafla <strong>in</strong> additionto the one at 3 km depth. The cont<strong>in</strong>uous flow of<strong>magma</strong> towards the shallow chamber for over a decadedur<strong>in</strong>g the Krafla fires suggest <strong>magma</strong> was transportedfrom a localized reservoir or <strong>magma</strong> storage area at adeeper level <strong>in</strong> the crust or mantle. The location of it isuncerta<strong>in</strong>, but geodetic data shows that deformation onthe surface cannot fully be expla<strong>in</strong>ed by the 3 km deepchamber. The deformation field is wider thanexpected. Tryggvason (1986) <strong>in</strong>terpreted recordsfrom tiltmeters dur<strong>in</strong>g the September 1984 eruption<strong>in</strong> terms of three stacked <strong>magma</strong> chambers, but locationof the two deeper ones was not well resolved. Therole of two deeper sources, rather than one, <strong>in</strong> the 1984eruption, is also not certa<strong>in</strong>. Árnadóttir et al. (1998)<strong>in</strong>terpreted EDM <strong>and</strong> level<strong>in</strong>g data from the 1984eruption <strong>and</strong> confirmed that <strong>magma</strong> was dra<strong>in</strong>edfrom a deeper source <strong>in</strong> addition to the 3 km deepsource, to form a 1 m wide, 9 km long dyke, extend<strong>in</strong>gfrom the surface to about 7 km depth, <strong>and</strong> lava flowson the surface. The location of the deeper source wasconstra<strong>in</strong>ed to be deeper than 5 km, but narrow apertureof the geodetic network did not allow furtherresolution of its depth. The deformation associatedwith dyke <strong>in</strong>trusion events dur<strong>in</strong>g the Krafla fires isfor most events not well constra<strong>in</strong>ed. Level<strong>in</strong>g profilescross<strong>in</strong>g the fissure swarm <strong>in</strong> two places (Sigurdsson,1980; Kanngiesser, 1983) show how the flanks of thefissure swarm were uplifted while a central blockabove the dikes was downfaulted.The caldera region <strong>in</strong>flated after the last eruption(1984) until the pre-eruption level was approached.Then the <strong>in</strong>flation became <strong>in</strong>termittent. The last <strong>in</strong>flationperiod occurred <strong>in</strong> the summer of 1989. After thatthe caldera region has been slowly subsid<strong>in</strong>g, a fewcentimeters per year, as determ<strong>in</strong>ed by InSAR (Sigmundssonet al., 1997a) <strong>and</strong> a comb<strong>in</strong>ed geodetic <strong>and</strong>micro-gravity study (Rymer et al., 1998). In the postrift<strong>in</strong>gperiod, GPS revealed higher than averagespread<strong>in</strong>g rates. The post-rift<strong>in</strong>g deformation is fitby an elastic upper crust overly<strong>in</strong>g a visco-elasticlower crust <strong>and</strong> even weaker visco-elastic upper mantle(e.g., Foulger et al., 1992; Pollitz <strong>and</strong> Sacks, 1996).A recent InSAR study (de Zeeuw-van Dalfsen etal., 2004a) has revealed uplift over an about 50-kmwidearea at the Krafla volcanic system (8 cm from1993 to 1999), <strong>in</strong> addition to deformation caused bysubsidence above the shallow <strong>magma</strong> chamber, <strong>and</strong>effects of plate spread<strong>in</strong>g <strong>and</strong> post-rift<strong>in</strong>g adjustment(Fig. 5). The favored explanation of de Zeeuw-vanDalfsen et al. (2004a) for the widespread uplift is thatit results from <strong>magma</strong> accumulation at the crust–mantleboundary at 20 km depth, rather than be<strong>in</strong>g causedby post-rift<strong>in</strong>g adjustment.3.2. AskjaThe Askja volcano <strong>in</strong> the Northern Volcanic Zone(Fig. 1) has three overlapp<strong>in</strong>g <strong>and</strong> nested calderas.The ma<strong>in</strong> caldera, formed <strong>in</strong> the early Holocene, is 8km <strong>in</strong> diameter. An older caldera is discernable but ithas been filled by later lava flows. The most recentcaldera, Öskjuvatn, is 4.5 km <strong>in</strong> diameter <strong>and</strong> is filledby a lake. It was formed after the Pl<strong>in</strong>ian eruption of1875. The most recent eruption of Askja took place <strong>in</strong>1961 when a short E–W fissure opened up near theeastern caldera fault of the ma<strong>in</strong> caldera. A shortlevel<strong>in</strong>g l<strong>in</strong>e was <strong>in</strong>stalled <strong>in</strong> the ma<strong>in</strong> caldera <strong>in</strong>
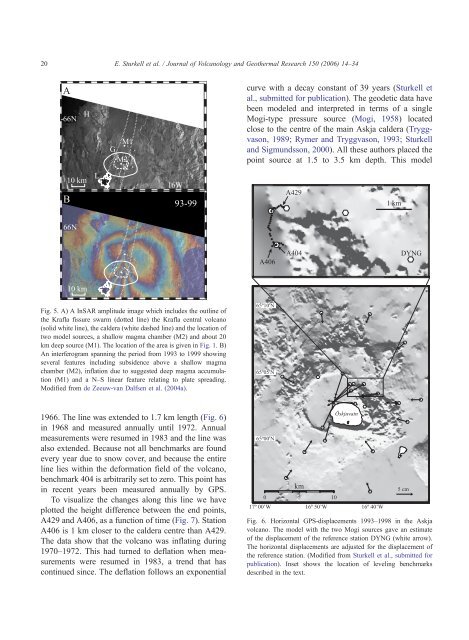
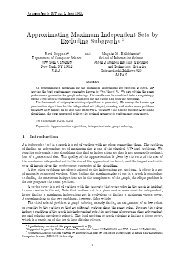
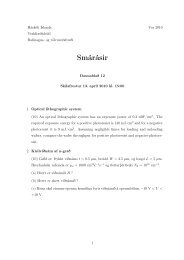
20E. Sturkell et al. / Journal of <strong>Volcano</strong>logy <strong>and</strong> Geothermal Research 150 (2006) 14–34AH66NM1GM2KL10 km16WB 93-99curve with a decay constant of 39 years (Sturkell etal., submitted for publication). The geodetic data havebeen modeled <strong>and</strong> <strong>in</strong>terpreted <strong>in</strong> terms of a s<strong>in</strong>gleMogi-type pressure source (Mogi, 1958) locatedclose to the centre of the ma<strong>in</strong> Askja caldera (Tryggvason,1989; Rymer <strong>and</strong> Tryggvason, 1993; Sturkell<strong>and</strong> Sigmundsson, 2000). All these authors placed thepo<strong>in</strong>t source at 1.5 to 3.5 km depth. This modelA4291 km66NA406A404DYNG10 kmFig. 5. A) A InSAR amplitude image which <strong>in</strong>cludes the outl<strong>in</strong>e ofthe Krafla fissure swarm (dotted l<strong>in</strong>e) the Krafla central volcano(solid white l<strong>in</strong>e), the caldera (white dashed l<strong>in</strong>e) <strong>and</strong> the location oftwo model sources, a shallow <strong>magma</strong> chamber (M2) <strong>and</strong> about 20km deep source (M1). The location of the area is given <strong>in</strong> Fig. 1. B)An <strong>in</strong>terferogram spann<strong>in</strong>g the period from 1993 to 1999 show<strong>in</strong>gseveral features <strong>in</strong>clud<strong>in</strong>g subsidence above a shallow <strong>magma</strong>chamber (M2), <strong>in</strong>flation due to suggested deep <strong>magma</strong> accumulation(M1) <strong>and</strong> a N–S l<strong>in</strong>ear feature relat<strong>in</strong>g to plate spread<strong>in</strong>g.Modified from de Zeeuw-van Dalfsen et al. (2004a).65º10'N65º05'N í1966. The l<strong>in</strong>e was extended to 1.7 km length (Fig. 6)<strong>in</strong> 1968 <strong>and</strong> measured annually until 1972. Annualmeasurements were resumed <strong>in</strong> 1983 <strong>and</strong> the l<strong>in</strong>e wasalso extended. Because not all benchmarks are foundevery year due to snow cover, <strong>and</strong> because the entirel<strong>in</strong>e lies with<strong>in</strong> the deformation field of the volcano,benchmark 404 is arbitrarily set to zero. This po<strong>in</strong>t has<strong>in</strong> recent years been measured annually by GPS.To visualize the changes along this l<strong>in</strong>e we haveplotted the height difference between the end po<strong>in</strong>ts,A429 <strong>and</strong> A406, as a function of time (Fig. 7). StationA406 is 1 km closer to the caldera centre than A429.The data show that the volcano was <strong>in</strong>flat<strong>in</strong>g dur<strong>in</strong>g1970–1972. This had turned to deflation when measurementswere resumed <strong>in</strong> 1983, a trend that hascont<strong>in</strong>ued s<strong>in</strong>ce. The deflation follows an exponential65º00'Nkm0 5 10Öskjuvatn17º 00’W 16º 50’W 16º 40’W5 cmFig. 6. Horizontal GPS-displacements 1993–1998 <strong>in</strong> the Askjavolcano. The model with the two Mogi sources gave an estimateof the displacement of the reference station DYNG (white arrow).The horizontal displacements are adjusted for the displacement ofthe reference station. (Modified from Sturkell et al., submitted forpublication). Inset shows the location of level<strong>in</strong>g benchmarksdescribed <strong>in</strong> the text.