Contents - Tung Lok Restaurants 2000 Ltd
Contents - Tung Lok Restaurants 2000 Ltd
Contents - Tung Lok Restaurants 2000 Ltd

You also want an ePaper? Increase the reach of your titles
YUMPU automatically turns print PDFs into web optimized ePapers that Google loves.
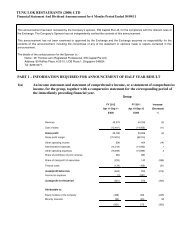
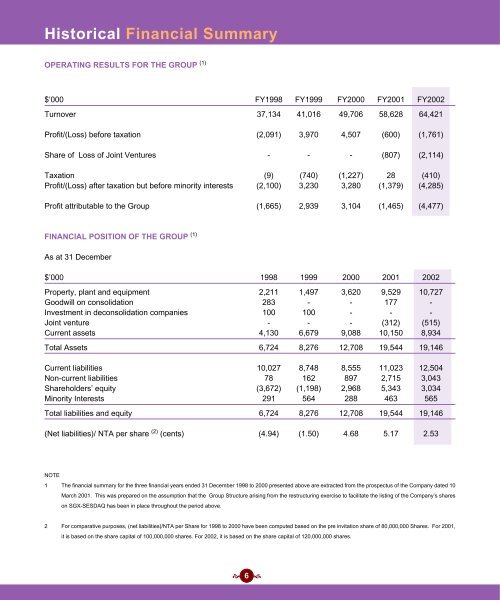
Historical Financial SummaryOPERATING RESULTS FOR THE GROUP (1)$’000 FY1998 FY1999 FY<strong>2000</strong> FY2001 FY2002Turnover 37,134 41,016 49,706 58,628 64,421Profit/(Loss) before taxation (2,091) 3,970 4,507 (600) (1,761)Share of Loss of Joint Ventures - - - (807) (2,114)Taxation (9) (740) (1,227) 28 (410)Profit/(Loss) after taxation but before minority interests (2,100) 3,230 3,280 (1,379) (4,285)Profit attributable to the Group (1,665) 2,939 3,104 (1,465) (4,477)FINANCIAL POSITION OF THE GROUP (1)As at 31 December$’000 1998 1999 <strong>2000</strong> 2001 2002Property, plant and equipment 2,211 1,497 3,620 9,529 10,727Goodwill on consolidation 283 - - 177 -Investment in deconsolidation companies 100 100 - - -Joint venture - - - (312) (515)Current assets 4,130 6,679 9,088 10,150 8,934Total Assets 6,724 8,276 12,708 19,544 19,146Current liabilities 10,027 8,748 8,555 11,023 12,504Non-current liabilities 78 162 897 2,715 3,043Shareholders’ equity (3,672) (1,198) 2,968 5,343 3,034Minority Interests 291 564 288 463 565Total liabilities and equity 6,724 8,276 12,708 19,544 19,146(Net liabilities)/ NTA per share (2) (cents) (4.94) (1.50) 4.68 5.17 2.53NOTE1 The financial summary for the three financial years ended 31 December 1998 to <strong>2000</strong> presented above are extracted from the prospectus of the Company dated 10March 2001. This was prepared on the assumption that the Group Structure arising from the restructuring exercise to facilitate the listing of the Company’s shareson SGX-SESDAQ has been in place throughout the period above.2 For comparative purposes, (net liabilities)/NTA per Share for 1998 to <strong>2000</strong> have been computed based on the pre invitation share of 80,000,000 Shares. For 2001,it is based on the share capital of 100,000,000 shares. For 2002, it is based on the share capital of 120,000,000 shares. 6