Ou7h5
Ou7h5
Ou7h5

Create successful ePaper yourself
Turn your PDF publications into a flip-book with our unique Google optimized e-Paper software.
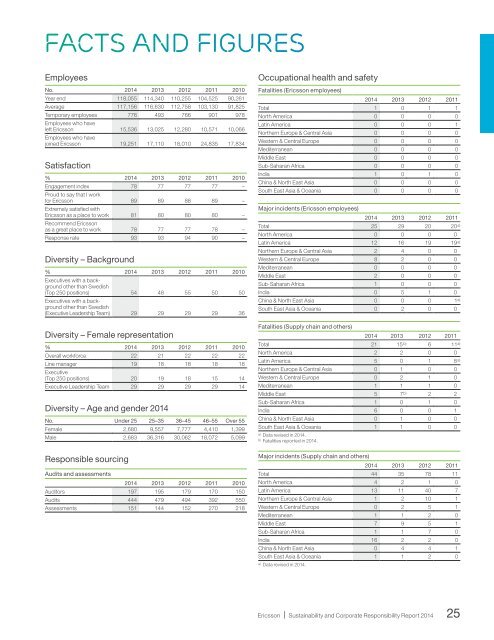
facts and figuresEmployeesNo. 2014 2013 2012 2011 2010Year end 118,055 114,340 110,255 104,525 90,261Average 117,156 116,630 112,758 103,130 91,825Temporary employees 776 493 766 901 978Employees who haveleft Ericsson 15,536 13,025 12,280 10,571 10,066Employees who havejoined Ericsson 19,251 17,110 18,010 24,835 17,834Satisfaction% 2014 2013 2012 2011 2010Engagement index 78 77 77 77 –Proud to say that I workfor Ericsson 89 89 88 89 –Extremely satisfied withEricsson as a place to work 81 80 80 80 –Recommend Ericssonas a great place to work 78 77 77 78 –Response rate 93 93 94 90 –Diversity – Background% 2014 2013 2012 2011 2010Executives with a backgroundother than Swedish(Top 250 positions) 54 48 55 50 50Executives with a backgroundother than Swedish(Executive Leadership Team) 29 29 29 29 36Diversity – Female representation% 2014 2013 2012 2011 2010Overall workforce 22 21 22 22 22Line manager 19 18 18 18 18Executive(Top 250 positions) 20 19 18 15 14Executive Leadership Team 29 29 29 29 14Diversity – Age and gender 2014No. Under 25 25–35 36–45 46–55 Over 55Female 2,680 9,557 7,777 4,410 1,399Male 2,683 36,316 30,062 18,072 5,099Responsible sourcingAudits and assessments2014 2013 2012 2011 2010Auditors 197 195 179 170 150Audits 444 479 494 392 550Assessments 151 144 152 270 218Occupational health and safetyFatalities (Ericsson employees)2014 2013 2012 2011Total 1 0 1 1North America 0 0 0 0Latin America 0 0 0 1Northern Europe & Central Asia 0 0 0 0Western & Central Europe 0 0 0 0Mediterranean 0 0 0 0Middle East 0 0 0 0Sub-Saharan Africa 0 0 0 0India 1 0 1 0China & North East Asia 0 0 0 0South East Asia & Oceania 0 0 0 0Major incidents (Ericsson employees)2014 2013 2012 2011Total 25 29 20 20 a)North America 0 0 0 0Latin America 12 16 19 19 a)Northern Europe & Central Asia 2 4 0 0Western & Central Europe 8 2 0 0Mediterranean 0 0 0 0Middle East 2 0 0 0Sub-Saharan Africa 1 0 0 0India 0 5 1 0China & North East Asia 0 0 0 1 a)South East Asia & Oceania 0 2 0 0Fatalities (Supply chain and others)2014 2013 2012 2011Total 21 15 b) 6 11 a)North America 2 2 0 0Latin America 5 0 1 8 a)Northern Europe & Central Asia 0 1 0 0Western & Central Europe 0 2 1 0Mediterranean 1 1 1 0Middle East 5 7 b) 2 2Sub-Saharan Africa 1 0 1 0India 6 0 0 1China & North East Asia 0 1 0 0South East Asia & Oceania 1 1 0 0a) Data revised in 2014.b) Fatalities reported in 2014.Major incidents (Supply chain and others)2014 2013 2012 2011Total 44 35 78 11North America 4 2 1 0Latin America 13 11 40 7Northern Europe & Central Asia 1 2 10 1Western & Central Europe 0 2 5 1Mediterranean 1 1 2 0Middle East 7 9 5 1Sub-Saharan Africa 1 1 7 0India 16 2 2 0China & North East Asia 0 4 4 1South East Asia & Oceania 1 1 2 0a) Data revised in 2014.Ericsson | Sustainability and Corporate Responsibility Report 201425