Improving performanceof our own operationsOur aim is to reduce our carbon footprint from directoperations while improving productivity and achievinga cost-benefit balance.Improving the sustainability performance of our own operationscomprises four focus areas:> > reducing energy use in facilities (offices, production sites,data centers and test labs) and prioritizing purchase ofgreen certified energy;> > shifting to low-carbon product transport, from air freightto surface shipping;> > reducing business travel by increasing use of videoconferencingand other collaborative work tools; and> > reducing fuel used in fleet vehicles.In 2012 Ericsson set an objective to maintain absolute CO 2e emissionsfrom business travel, product transport and facilities at 2011levels up to 2017. This equates to a reduction of 30% CO 2e peremployee. For 2014, the reduction was 10% CO 2e per employee.Facility energy useTo reduce our facilities’ energy use, we work to improve the efficiencyusage of our buildings by enhancing workplace functionality;shift to more energy-efficient buildings and implement Leadershipin Energy and Environmental Design (LEED) green buildingrequirements, level Gold, or the equivalent in other green buildingstandards.During 2014 the green building-rated area was maintained ataround 10%; however, the green electric power increased in 2014to 39% compared to 35% at year-end 2013. With an improvedreporting process in 2014, close to 80% of our real estate portfoliois now covered in an energy assessment. More flexible ways ofworking, including “free seating,” teamwork work-spaces andgreater use of video-conferencing contributed to a smaller carbonfootprint. In 2014, facilities’ energy usage was around 230Ktonnes CO 2e. In Sweden, we have had 100% green-certifiedelectricity since 2008.Ericsson own activities Carbon footprint intensity targetTonnes CO 2e/Employee1086420201120122013Mtonnes0.635.4320141.00.80.60.40.20.0Carbon footprint intensityTonnes CO 2e/EmployeeCarbon footprint absoluteemission, MtonnesSource: EricssonProduct transportationIn 2014, we continued our work of shifting from air to surfacetransport to reduce CO 2 emissions. Product volumes transportedwere comparable to 2013 which shows that we have reduced thetransport distances, mainly within air transport. We have achieveda reduction of 25 kTonnes CO 2e in absolute terms.Business travelIn 2014, business travel emissions were up around 8% peremployee. However, emissions from business travel declined by10% per employee, compared to the 2011 baseline. Video conferencingtools such as Ericsson Visual Communication arepromoted as a substitute to travel.Fleet vehiclesGrowth in Managed Services puts focus on our vehicle fleet. Weare targeting to reduce CO 2e/km in our vehicle fleet by purchasingmore efficient vehicles, implementing telematics, and trialing alternativerenewable fuels. A telematics pilot rolled out to more than1,500 vehicles allowed Ericsson to monitor attributes of vehicleoperations, performance, location and velocity. This has resultedin over 5% increased fuel economy.Global ICT Centerssave energyIn 2014, Ericson opened its first Global ICT Center, located inLinköping, Sweden. This is the first of three high-tech, GlobalICT Centers, which will house the company’s complete portfolio.Using the latest cloud technology, the center enables Ericsson’s25,000 R&D engineers to collaborate beyond bordersmore easily and efficiently, bringing innovation faster to market.Two will be located in Sweden; one in Quebec, Canada.Currently, Ericsson has test labs and data centers located invarious countries around the world. The strategy is to consolidatemost of these within the new Global ICT Centers, whichare placed in areas with access to renewable energy and a reliablepower grid. The centers will also significantly reduce ourcarbon footprint by using green certified power according tothe Swedish Green Energy system “Good EnvironmentalChoice.”The three ICT Centers combined will be up to 120,000square meters – approximately the size of 14 football fields.They will feature leading-edge design, with modular, scalableand efficient use of resources and space adaptable to businessneeds. Ericsson estimates that the combined architecture,design and location solution will reduce energy consumptionup to 40% – another step towards Ericsson’s vision of a moresustainable future.34 Ericsson | Sustainability and Corporate Responsibility Report 2014
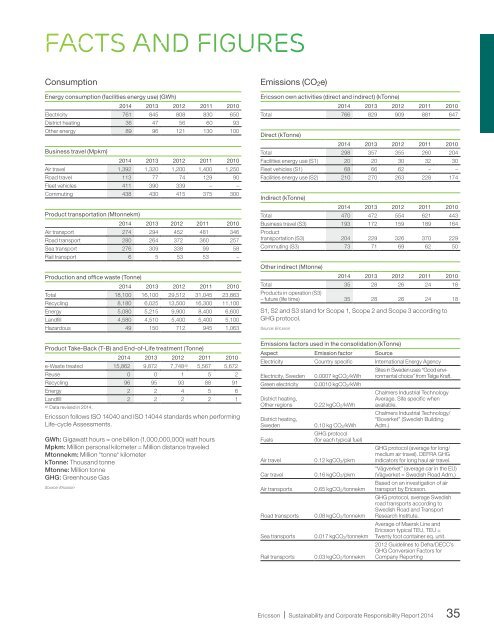
facts and figuresConsumptionEnergy consumption (facilities energy use) (GWh)2014 2013 2012 2011 2010Electricity 761 845 808 830 650District heating 36 47 56 60 93Other energy 89 96 121 130 100Business travel (Mpkm)2014 2013 2012 2011 2010Air travel 1,392 1,320 1,200 1,400 1,250Road travel 113 77 74 129 90Fleet vehicles 411 390 339 – –Commuting 438 430 415 375 300Product transportation (Mtonnekm)2014 2013 2012 2011 2010Air transport 274 294 452 481 346Road transport 280 264 372 360 257Sea transport 276 309 338 99 58Rail transport 6 5 53 53 –Production and office waste (Tonne)2014 2013 2012 2011 2010Total 18,100 16,100 29,512 31,045 23,863Recycling 8,180 6,025 13,500 16,300 11,100Energy 5,080 5,215 9,900 8,400 6,600Landfill 4,580 4,510 5,400 5,400 5,100Hazardous 49 150 712 945 1,063Product Take-Back (T-B) and End-of-Life treatment (Tonne)2014 2013 2012 2011 2010e-Waste treated 15,862 9,872 7,748 a) 5,567 5,672Reuse 0 0 1 5 2Recycling 96 95 93 88 91Energy 2 2 4 5 6Landfill 2 2 2 2 1a) Data revised in 2014.Ericsson follows ISO 14040 and ISO 14044 standards when performingLife-cycle Assessments.GWh: Gigawatt hours = one billion (1,000,000,000) watt hoursMpkm: Million personal kilometer = Million distance traveledMtonnekm: Million *tonne* kilometerkTonne: Thousand tonneMtonne: Million tonneGHG: Greenhouse GasSource: EricssonEmissions (CO 2 e)Ericsson own activities (direct and indirect) (kTonne)2014 2013 2012 2011 2010Total 766 829 909 881 647Direct (kTonne)2014 2013 2012 2011 2010Total 298 357 355 260 204Facilities energy use (S1) 20 20 30 32 30Fleet vehicles (S1) 68 66 62 – –Facilities energy use (S2) 210 270 263 228 174Indirect (kTonne)2014 2013 2012 2011 2010Total 470 472 554 621 443Business travel (S3) 193 172 159 189 164Producttransportation (S3) 204 229 326 370 229Commuting (S3) 73 71 69 62 50Other indirect (Mtonne)2014 2013 2012 2011 2010Total 35 28 26 24 18Products in operation (S3)– future (life time) 35 28 26 24 18S1, S2 and S3 stand for Scope 1, Scope 2 and Scope 3 according toGHG protocol.Source: EricssonEmissions factors used in the consolidation (kTonne)Aspect Emission factor SourceElectricity Country specific International Energy AgencyElectricity, SwedenGreen electricityDistrict heating,Other regionsDistrict heating,SwedenFuelsAir travelCar travelAir transportsRoad transportsSea transportsRail transports0.0007 kgCO 2/kWh0.0010 kgCO 2/kWh0.22 kgCO 2/kWh0.10 kg CO 2/kWhGHG protocol(for each typical fuel)0.12 kgCO 2/pkm0.16 kgCO 2/pkm0.65 kgCO 2/tonnekm0.08 kgCO 2/tonnekm0.017 kgCO 2/tonnekm0.03 kgCO 2/tonnekmSites in Sweden uses “Good environmentalchoice” from Telge Kraft.Chalmers Industrial TechnologyAverage. Site specific whenavailable.Chalmers Industrial Technology/“Boverket” (Swedish BuildingAdm.)GHG protocol (average for long/medium air travel). DEFRA GHGindicators for long haul air travel.“Vägverket” (average car in the EU)(Vägverket = Swedish Road Adm.)Based on an investigation of airtransport by Ericsson.GHG protocol, average Swedishroad transports according toSwedish Road and TransportResearch Institute.Average of Maersk Line andEricsson typical TEU, TEU =Twenty foot container eq. unit.2012 Guidelines to Defra/DECC’sGHG Conversion Factors forCompany ReportingEricsson | Sustainability and Corporate Responsibility Report 201435