Basic Skills and Social Exclusion - Centre for Longitudinal Studies
Basic Skills and Social Exclusion - Centre for Longitudinal Studies
Basic Skills and Social Exclusion - Centre for Longitudinal Studies
Create successful ePaper yourself
Turn your PDF publications into a flip-book with our unique Google optimized e-Paper software.
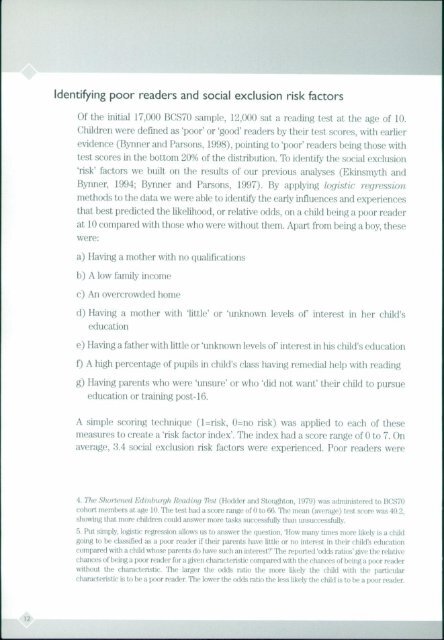
Identifying poor readers <strong>and</strong> social exclusion risk factorsIf the initial 17,000 BCS7() sample, 12,10)1) ,;if 1 inaliiit lisi ii iii ;i I'Children were defined as 'poor' or 'good' readers by llieii' test scores, with earliervulence (Bvimer <strong>and</strong> Parsons, 1998), pointing to 'poor' readers being those withst scores in the bottom 20% of the distribution. To identify the social exciusiorrisk' factors we built on the results of our previous analyses (Ekinsrnyth <strong>and</strong>Hvriner, 1994; Bynrier <strong>and</strong> Parsons, 1997). By applying logistic regressw//Ii ethods to the data we were able to identify the early influences <strong>and</strong> experiencesI at. best predicted the likelihood, or relative odds, on a child being a poor readerit It) compared with those who were wit hout them. Apart frorn being I ( )V. 11 S\Vere:Having a mother with n (II ralifirat i0 'is ih) A low family ints)tta'An overcrowded Iii(I) Ha ving a riiot.her \\ltlI 111111''I lucationor 'tiiikiiovii levels Id ' interest in lieu li!II hiving a father with little or 'unknown levels of interest in his child's educal iiiA Iiigl-i percentage of pupils in child's class having remedial help with readliI living parents who were 'unsure' or who 'did not want' their child to us a'lIInli1ilI;itiItjss1 H.\ sirrIsvriiu cliiijii (I rik H fl iski \\;Is;l)jIH! Imeasures to create a 'risk laei.or index. The index had it score range oF (Ito 7. O i l.l SiSial '(hisioti risk tailors wire xlrieiiiid. Poor ri':uli'rs \\fltiI 1/5 ^ bfo lciwd 1/ mhm /I 1 S/I 1/ h 51 II 1(11 l,r ii II Sl,uji It Ill. ad ni l I11(1 1 II I of')( 5hurt members at age 10. The test had a score range ufOto 66. The mean (average) test score was.1 i0wing that more children could answer more tasks successfully than wcsuccessftillPut simply, logistic regression allows us to answer the question,'How many times more likely is 1o log to be classifi edI as a poor reader if their parents have little or no interest in their child 's iclii, ii Icom pared with a child whose parents (Ii) have suc h so iii crest?' The reported 'odds ralios'givv the relativices of beuig a poor reader <strong>for</strong> a given characteristic I iinipared with the chances of being a poor readeriI hi,iiit the characteristic. The larger the odds ratio the more likel y the child with il, pail ciii;I, ....... . 1 . ,IHHH'(r'l


