NAAB Architecture Program Report (APR) 2013 - Tulane School of ...
NAAB Architecture Program Report (APR) 2013 - Tulane School of ...
NAAB Architecture Program Report (APR) 2013 - Tulane School of ...

You also want an ePaper? Increase the reach of your titles
YUMPU automatically turns print PDFs into web optimized ePapers that Google loves.
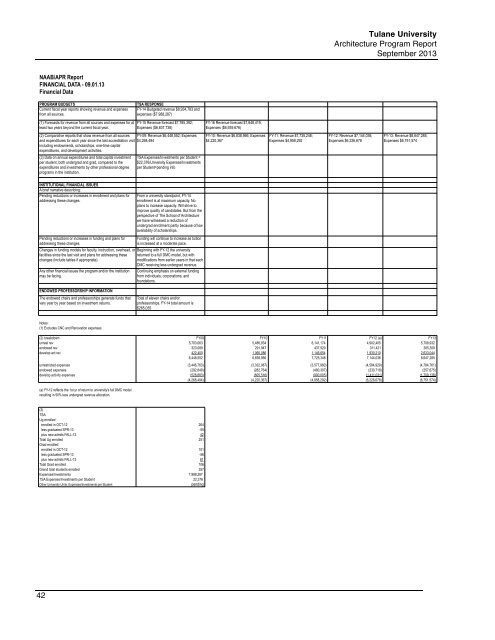
<strong>Tulane</strong> University<strong>Architecture</strong> <strong>Program</strong> <strong>Report</strong>September <strong>2013</strong><strong>NAAB</strong>/<strong>APR</strong> <strong>Report</strong>FINANCIAL DATA - 09.01.13Financial DataPROGRAM BUDGETSCurrent fiscal year reports showing revenue and expensesfrom all sources.(1) Forecasts for revenue from all sources and expenses for atleast two years beyond the current fiscal year.TSA RESPONSEFY-14 Budgeted revenue $8,934,783 andexpenses ($7,988,287)FY-15 Revenue forecast $7,765,392;Expenses ($6,837,738)(2) Comparative reports that show revenue from all sources FY-09: Revenue $6,448,552; Expensesand expenditures for each year since the last accreditation visit $4,268,494including endowments, scholarships, one-time capitalexpenditures, and development activities.(3) Data on annual expenditures and total capital investmentper student, both undergrad and grad, compared to theexpenditures and investments by other pr<strong>of</strong>essional degreeprograms in the institution.TSA Expenses/Investments per Student =$22,376/University Expenses/Investmentsper Student=pending infoFY-16 Revenue forecast $7,848,419;Expenses ($6,939,676)FY-10: Revenue $6,838,966; Expenses$4,220,367FY-11: Revenue $7,735,248;Expenses $4,958,292FY-12: Revenue $7,144,036;Expenses $6,226,678FY-13: Revenue $8,647,285;Expenses $6,751,574INSTITUTIONAL FINANCIAL ISSUESA brief narrative describing:Pending reductions or increases in enrollment and plans foraddressing these changes.Pending reductions or increases in funding and plans foraddressing these changes.From a university standpoint, FY-14enrollment is at maximum capacity. Noplans to increase capacity. Will strive toimprove quality <strong>of</strong> candidates. But from theperspective <strong>of</strong> The <strong>School</strong> <strong>of</strong> <strong>Architecture</strong>we have witnessed a reduction <strong>of</strong>undergrad enrollment partly because <strong>of</strong> lowavailability <strong>of</strong> scholarships.Funding will continue to increase as tuitionis increased at a moderate pace.Changes in funding models for faculty, instruction, overhead, or Beginning with FY-12 the universityfacilities since the last visit and plans for addressing these returned to a full DMC model, but withchanges (include tables if appropriate).modifications from earlier years in that eachDMC receiving less undergrad revenue.Any other financial issues the program and/or the institutionmay be facing.Continuing emphasis on external fundingfrom individuals; corporations; andfoundations.ENDOWED PROFESSORSHIP INFORMATIONThe endowed chairs and pr<strong>of</strong>essorships generate funds thatvary year by year based on investment returns.Total <strong>of</strong> eleven chairs and/orpr<strong>of</strong>essorships. FY-14 total amount is$265,035Notes:(1) Excludes CNC and Renovation expenses(2) breakdown FY09 FY10 FY11 FY12 (a) FY13unrest rev 5,703,063 5,486,934 6,141,174 4,902,405 5,708,932endowed rev 323,089 291,947 437,520 311,421 305,309develop act rev 422,400 1,060,086 1,146,654 1,930,210 2,633,0446,448,552 6,838,966 7,725,348 7,144,036 8,647,285unrestricted expenses (3,446,763) (3,332,087) (3,577,980) (4,584,929) (4,784,761)endowed expenses (292,849) (282,764) (480,307) (230,718) (257,675)develop activity expenses (528,883) (605,516) (900,005) (1,411,031) (1,709,138)(4,268,494) (4,220,367) (4,958,292) (6,226,678) (6,751,574)(a) FY-12 reflects the 1st yr <strong>of</strong> return to university's full DMC modelresulting in 50% less undergrad revenue allocation.(3)TSA:Ug enrolledenrolled in OCT-12 264less graduated SPR-13 -55plus new admits FALL-13 42Total Ug enrolled 251Grad enrolledenrolled in OCT-12 101less graduated SPR-13 -56plus new admits FALL-13 61Total Grad enrolled 106Grand total students enrolled 357Expenses/Investments 7,988,287TSA Expenses/Investments per Student 22,376Other University Units: Expenses/Investments per Studentpending42