A Dynamic Model of Housing Supply
A Dynamic Model of Housing Supply
A Dynamic Model of Housing Supply

Create successful ePaper yourself
Turn your PDF publications into a flip-book with our unique Google optimized e-Paper software.
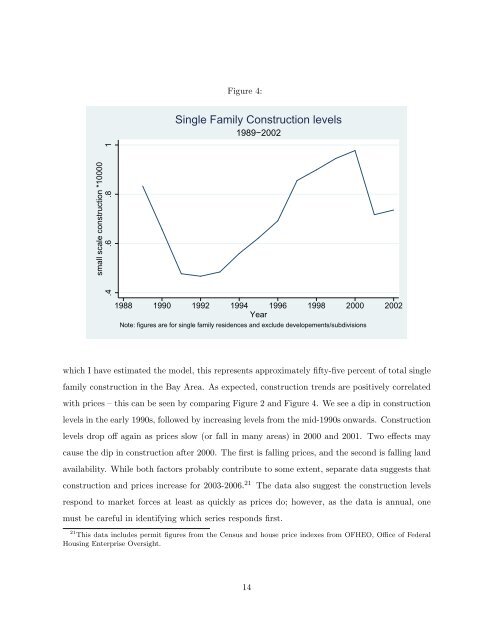
Figure 4:Single Family Construction levels1989−2002small scale construction *10000.4 .6 .8 11988 1990 1992 1994 1996 1998 2000 2002YearNote: figures are for single family residences and exclude developements/subdivisionswhich I have estimated the model, this represents approximately fifty-five percent <strong>of</strong> total singlefamily construction in the Bay Area. As expected, construction trends are positively correlatedwith prices – this can be seen by comparing Figure 2 and Figure 4. We see a dip in constructionlevels in the early 1990s, followed by increasing levels from the mid-1990s onwards. Constructionlevels drop <strong>of</strong>f again as prices slow (or fall in many areas) in 2000 and 2001. Two effects maycause the dip in construction after 2000. The first is falling prices, and the second is falling landavailability. While both factors probably contribute to some extent, separate data suggests thatconstruction and prices increase for 2003-2006. 21 The data also suggest the construction levelsrespond to market forces at least as quickly as prices do; however, as the data is annual, onemust be careful in identifying which series responds first.21 This data includes permit figures from the Census and house price indexes from OFHEO, Office <strong>of</strong> Federal<strong>Housing</strong> Enterprise Oversight.14