A Dynamic Model of Housing Supply
A Dynamic Model of Housing Supply
A Dynamic Model of Housing Supply

Create successful ePaper yourself
Turn your PDF publications into a flip-book with our unique Google optimized e-Paper software.
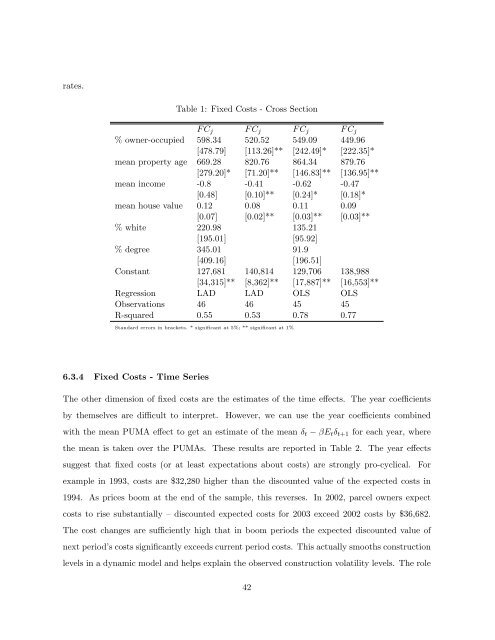
ates.Table 1: Fixed Costs - Cross SectionF C j F C j F C j F C j% owner-occupied 598.34 520.52 549.09 449.96[478.79] [113.26]** [242.49]* [222.35]*mean property age 669.28 820.76 864.34 879.76[279.20]* [71.20]** [146.83]** [136.95]**mean income -0.8 -0.41 -0.62 -0.47[0.48] [0.10]** [0.24]* [0.18]*mean house value 0.12 0.08 0.11 0.09[0.07] [0.02]** [0.03]** [0.03]**% white 220.98 135.21[195.01] [95.92]% degree 345.01 91.9[409.16] [196.51]Constant 127,681 140,814 129,706 138,988[34,315]** [8,362]** [17,887]** [16,553]**Regression LAD LAD OLS OLSObservations 46 46 45 45R-squared 0.55 0.53 0.78 0.77Standard errors in brackets. * significant at 5%; ** significant at 1%6.3.4 Fixed Costs - Time SeriesThe other dimension <strong>of</strong> fixed costs are the estimates <strong>of</strong> the time effects. The year coefficientsby themselves are difficult to interpret. However, we can use the year coefficients combinedwith the mean PUMA effect to get an estimate <strong>of</strong> the mean δ t − βE t δ t+1 for each year, wherethe mean is taken over the PUMAs. These results are reported in Table 2. The year effectssuggest that fixed costs (or at least expectations about costs) are strongly pro-cyclical. Forexample in 1993, costs are $32,280 higher than the discounted value <strong>of</strong> the expected costs in1994. As prices boom at the end <strong>of</strong> the sample, this reverses. In 2002, parcel owners expectcosts to rise substantially – discounted expected costs for 2003 exceed 2002 costs by $36,682.The cost changes are sufficiently high that in boom periods the expected discounted value <strong>of</strong>next period’s costs significantly exceeds current period costs. This actually smooths constructionlevels in a dynamic model and helps explain the observed construction volatility levels. The role42