CHAPTER 1: INTRODUCTION 1.0 Chapter Overview - DSpace@UM
CHAPTER 1: INTRODUCTION 1.0 Chapter Overview - DSpace@UM
CHAPTER 1: INTRODUCTION 1.0 Chapter Overview - DSpace@UM

You also want an ePaper? Increase the reach of your titles
YUMPU automatically turns print PDFs into web optimized ePapers that Google loves.
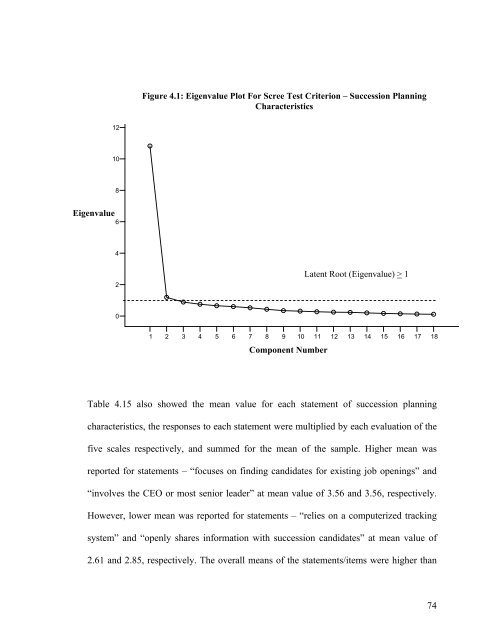
Figure 4.1: Eigenvalue Plot For Scree Test Criterion – Succession PlanningCharacteristics12108Eigenvalue642Latent Root (Eigenvalue) > 10123456789101112131415161718Component NumberTable 4.15 also showed the mean value for each statement of succession planningcharacteristics, the responses to each statement were multiplied by each evaluation of thefive scales respectively, and summed for the mean of the sample. Higher mean wasreported for statements – “focuses on finding candidates for existing job openings” and“involves the CEO or most senior leader” at mean value of 3.56 and 3.56, respectively.However, lower mean was reported for statements – “relies on a computerized trackingsystem” and “openly shares information with succession candidates” at mean value of2.61 and 2.85, respectively. The overall means of the statements/items were higher than74