CHAPTER 1: INTRODUCTION 1.0 Chapter Overview - DSpace@UM
CHAPTER 1: INTRODUCTION 1.0 Chapter Overview - DSpace@UM
CHAPTER 1: INTRODUCTION 1.0 Chapter Overview - DSpace@UM

Create successful ePaper yourself
Turn your PDF publications into a flip-book with our unique Google optimized e-Paper software.
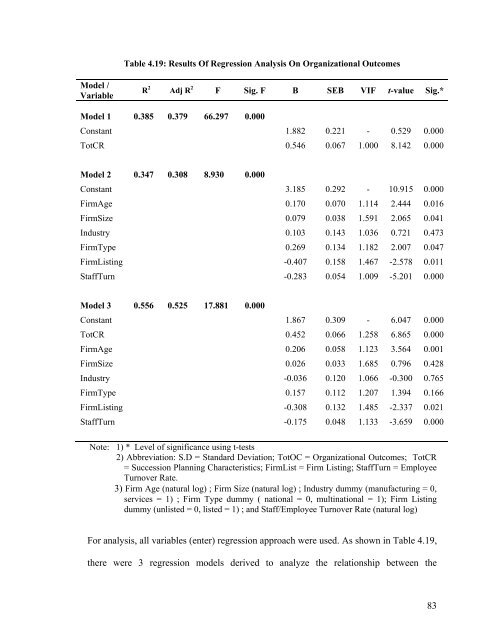
Table 4.19: Results Of Regression Analysis On Organizational OutcomesModel /VariableR 2 Adj R 2 F Sig. F B SEB VIF t-value Sig.*Model 1 0.385 0.379 66.297 0.000Constant 1.882 0.221 - 0.529 0.000TotCR 0.546 0.067 <strong>1.0</strong>00 8.142 0.000Model 2 0.347 0.308 8.930 0.000Constant 3.185 0.292 - 10.915 0.000FirmAge 0.170 0.070 1.114 2.444 0.016FirmSize 0.079 0.038 1.591 2.065 0.041Industry 0.103 0.143 <strong>1.0</strong>36 0.721 0.473FirmType 0.269 0.134 1.182 2.007 0.047FirmListing -0.407 0.158 1.467 -2.578 0.011StaffTurn -0.283 0.054 <strong>1.0</strong>09 -5.201 0.000Model 3 0.556 0.525 17.881 0.000Constant 1.867 0.309 - 6.047 0.000TotCR 0.452 0.066 1.258 6.865 0.000FirmAge 0.206 0.058 1.123 3.564 0.001FirmSize 0.026 0.033 1.685 0.796 0.428Industry -0.036 0.120 <strong>1.0</strong>66 -0.300 0.765FirmType 0.157 0.112 1.207 1.394 0.166FirmListing -0.308 0.132 1.485 -2.337 0.021StaffTurn -0.175 0.048 1.133 -3.659 0.000Note: 1) * Level of significance using t-tests2) Abbreviation: S.D = Standard Deviation; TotOC = Organizational Outcomes; TotCR= Succession Planning Characteristics; FirmList = Firm Listing; StaffTurn = EmployeeTurnover Rate.3) Firm Age (natural log) ; Firm Size (natural log) ; Industry dummy (manufacturing = 0,services = 1) ; Firm Type dummy ( national = 0, multinational = 1); Firm Listingdummy (unlisted = 0, listed = 1) ; and Staff/Employee Turnover Rate (natural log)For analysis, all variables (enter) regression approach were used. As shown in Table 4.19,there were 3 regression models derived to analyze the relationship between the83