Notes to the consolidatedfinancial statements continued5 Segments continuedOther information <strong>report</strong>ed to the Board is on a <strong>Group</strong>-wide basis and therefore not associated with segments.Health & Care<strong>2013</strong>£’0002012£’000<strong>2013</strong>£’000BusinessSolutions2012£’000365 ManagedServices<strong>2013</strong>£’0002012£’000<strong>2013</strong>£’000UnallocateditemsExternal revenue 26,146 22,738 59,933 53,853 34,719 21,871 116 (262) 120,914 98,200Recurring 15,430 14,217 31,729 28,923 22,295 13,000 – – 69,454 56,140Non-recurring 10,716 8,521 28,204 25,051 12,424 8,750 116 (262) 51,460 42,060Inter-segment revenue (190) (377) (401) (97) (287) (155) 878 629 – –EBITDA 6,915 5,945 15,665 15,161 4,875 4,227 (2,185) (3,190) 25,270 22,143Share-based payments 277 254 698 395 238 160 33 1,147 1,246 1,956Acquisition costs – – 219 – – – 266 – 485 –Adjusted EBITDA 7,192 6,199 16,582 15,556 5,113 4,387 (1,886) (2,043) 27,001 24,099Depreciation 1,697 1,194 1,697 1,194Amortisation ofacquired intangibles 13,185 12,826 13,185 12,826Finance costs 1,225 1,692 1,225 1,692Tax 31 491 31 491Product informationRevenue from products and services of the <strong>Group</strong> was as follows in the year:2012£’000<strong>2013</strong>£’000Total2012£’000<strong>2013</strong>Continuingoperations£’000Continuingoperations£’0002012Discontinuedoperations£’000Product licence 17,685 16,435 955 17,390Consultancy services 27,153 22,220 1,201 23,421Maintenance 48,309 44,471 1,454 45,925Managed services 21,145 11,669 15 11,684Other 6,622 3,405 – 3,405120,914 98,200 3,625 101,825Hardware has been reclassified from product licences to other revenue. Prior year figures have been reclassifiedaccordingly.Geographic informationThe <strong>report</strong>ed segments of the <strong>Group</strong> are mainly located in the UK and all material sales are made to customersinside the UK.There are no material assets located outside the UK.Major customerNo single customer accounted for more than 5% of the <strong>Group</strong>’s revenue in the year.Net assetsAssets and liabilities are not <strong>report</strong>ed internally by segment.Total£’00048<strong>Advanced</strong> <strong>Computer</strong> <strong>Software</strong> <strong>Group</strong> <strong>plc</strong><strong>Annual</strong> Report <strong>2013</strong>
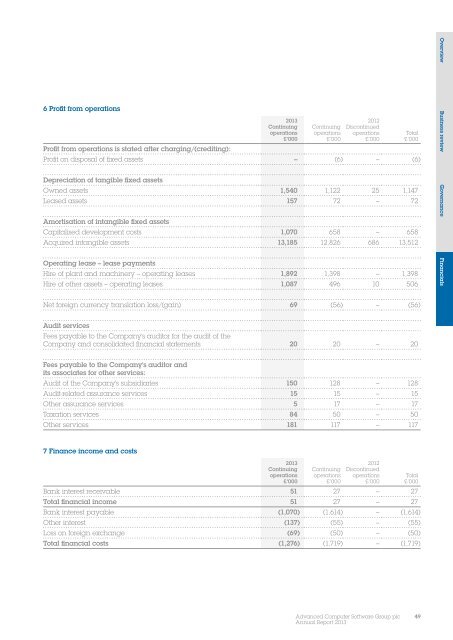
6 Profit from operations<strong>2013</strong>Continuingoperations£’000Continuingoperations£’0002012Discontinuedoperations£’000Profit from operations is stated after charging/(crediting):Profit on disposal of fixed assets – (6) – (6)Depreciation of tangible fixed assetsOwned assets 1,540 1,122 25 1,147Leased assets 157 72 – 72Amortisation of intangible fixed assetsCapitalised development costs 1,070 658 – 658Acquired intangible assets 13,185 12,826 686 13,512Operating lease – lease paymentsHire of plant and machinery – operating leases 1,892 1,398 – 1,398Hire of other assets – operating leases 1,087 496 10 506Total£’000Overview Business review Governance FinancialsNet foreign currency translation loss/(gain) 69 (56) – (56)Audit servicesFees payable to the Company's auditor for the audit of theCompany and consolidated financial statements 20 20 – 20Fees payable to the Company's auditor andits associates for other services:Audit of the Company's subsidiaries 150 128 – 128Audit-related assurance services 15 15 – 15Other assurance services 5 17 – 17Taxation services 84 50 – 50Other services 181 117 – 1177 Finance income and costs<strong>2013</strong>Continuingoperations£’000Continuingoperations£’0002012Discontinuedoperations£’000Bank interest receivable 51 27 – 27Total financial income 51 27 – 27Bank interest payable (1,070) (1,614) – (1,614)Other interest (137) (55) – (55)Loss on foreign exchange (69) (50) – (50)Total financial costs (1,276) (1,719) – (1,719)Total£’000<strong>Advanced</strong> <strong>Computer</strong> <strong>Software</strong> <strong>Group</strong> <strong>plc</strong><strong>Annual</strong> Report <strong>2013</strong>49