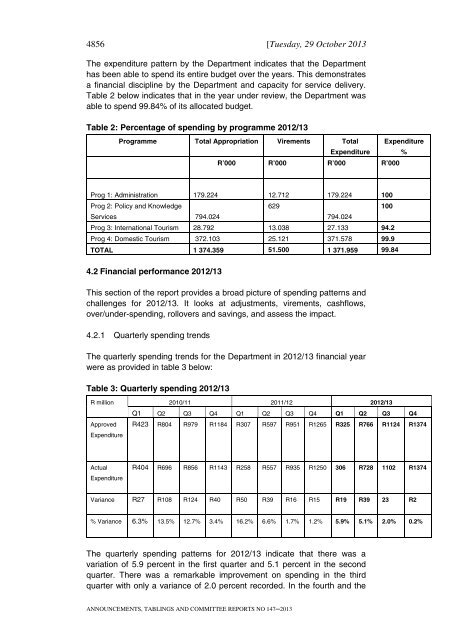
4856 [Tuesday, 29 October 2013The expenditure pattern by the Department indicates that the Departmenthas been able to spend its entire budget over the years. This demonstratesa financial discipline by the Department <strong>and</strong> capacity for service delivery.Table 2 below indicates that in the year under review, the Department wasable to spend 99.84% <strong>of</strong> its allocated budget.Table 2: Percentage <strong>of</strong> spending by programme 2012/13Programme Total Appropriation Virements Total ExpenditureExpenditure %R’000 R’000 R’000 R’000Prog 1: Administration 179.224 12.712 179.224 100Prog 2: Policy <strong>and</strong> Knowledge629100Services 794.024794.024Prog 3: International Tourism 28.792 13.038 27.133 94.2Prog 4: Domestic Tourism 372.103 25.121 371.578 99.9TOTAL 1 374.359 51.500 1 371.959 99.844.2 Financial performance 2012/13This section <strong>of</strong> the report provides a broad picture <strong>of</strong> spending patterns <strong>and</strong>challenges for 2012/13. It looks at adjustments, virements, cashflows,over/under-spending, rollovers <strong>and</strong> savings, <strong>and</strong> assess the impact.4.2.1 Quarterly spending trendsThe quarterly spending trends for the Department in 2012/13 financial yearwere as provided in table 3 below:Table 3: Quarterly spending 2012/13R million 2010/11 2011/12 2012/13ApprovedExpenditureQ1 Q2 Q3 Q4 Q1 Q2 Q3 Q4 Q1 Q2 Q3 Q4R423 R804 R979 R1184 R307 R597 R951 R1265 R325 R766 R1124 R1374ActualExpenditureR404 R696 R856 R1143 R258 R557 R935 R1250 306 R728 1102 R1374Variance R27 R108 R124 R40 R50 R39 R16 R15 R19 R39 23 R2% Variance 6.3% 13.5% 12.7% 3.4% 16.2% 6.6% 1.7% 1.2% 5.9% 5.1% 2.0% 0.2%The quarterly spending patterns for 2012/13 indicate that there was avariation <strong>of</strong> 5.9 percent in the first quarter <strong>and</strong> 5.1 percent in the secondquarter. There was a remarkable improvement on spending in the thirdquarter with only a variance <strong>of</strong> 2.0 percent recorded. In the fourth <strong>and</strong> theANNOUNCEMENTS, TABLINGS AND COMMITTEE REPORTS NO 147─2013
Tuesday, 29 October 2013] 4857last quarter <strong>of</strong> the period under review the Department’s expenditurepattern had completely recovered <strong>and</strong> only 0.2 percent variance inspending was recorded.4.2.2 Adjustments for 2012/13.Table 4 below indicates all the adjustments that were effected in 2013/14per Programme with percentages.Table 4: Budget adjustmentsProgrammeMain AppropriationAdjustment EstimatesBudget after shiftsapproved by NationalTreasuryVirementsFinal Budget(Adjustment estimateplus/ minus virement)Actual Amount spentOver/ underexpenditure% SpentVirement as a % <strong>of</strong>budgetR’000 R’000 R’000 R’000R’000 R’000 R’000% %Administration 195,043 191,936 181,936 12,712 179,224 179,224 - 100% -1.4%Policy <strong>and</strong> 787,994 793,395 793,395 629 794,024 794,024 - 100% 0%KnowledgeServicesInternational 46,834 41,830 31,830 13,038 28,792 27,133 1,659 94.2% -6.5%TourismDomestic 337,450 436,982 366,982 25,121 372,103 371,578 525 99.9% 1.5%TourismTotal 1,367,321 1,374,143 1,374,143 - 1,374,143 1,371,959 2,184 99.4%4.2.3 Auditor General ReportThe Department obtained an unqualified audit for the 2012/13 financialyear whilst South African Tourism also received an unqualified <strong>and</strong> nomatter <strong>of</strong> emphasis report for the 12 th consecutive year. The only majorfinding <strong>of</strong> the Auditor-General is in regard to material misstatements <strong>of</strong>disclosure notes. This amounted to non-compliance with section 40(1) <strong>of</strong>the Public Finance Management Act. The misstatements were in regard toasset management. The information in the asset register did not matchinformation provided in the disclosure notes. However the Department wasable to avoid a qualification due to the correction <strong>of</strong> material statementsduring the audit process. The Auditor-General suggested the followingremedial actions:• Review <strong>of</strong> financial statements against applicable reportingframeworks needs to be enhanced to ensure that there are nomaterial adjustments made to financial statements.• Management should perform monthly reconciliation between theasset register (s) <strong>and</strong> the amount reflected in the financial system<strong>and</strong> the supporting documentation need to be reviewed forcorrectness.ANNOUNCEMENTS, TABLINGS AND COMMITTEE REPORTS NO 147─2013
- Page 1 and 2: Tuesday, 29 October 2013] 4811No 14
- Page 3 and 4: Tuesday, 29 October 2013] 4813Democ
- Page 5 and 6: Tuesday, 29 October 2013] 4815use o
- Page 7 and 8: Tuesday, 29 October 2013] 48172.3 B
- Page 9 and 10: Tuesday, 29 October 2013] 4819• M
- Page 11 and 12: Tuesday, 29 October 2013] 4821The s
- Page 13 and 14: Tuesday, 29 October 2013] 48234. SU
- Page 15 and 16: Tuesday, 29 October 2013] 4825espec
- Page 17 and 18: Tuesday, 29 October 2013] 4827Depar
- Page 19 and 20: Tuesday, 29 October 2013] 4829Table
- Page 21 and 22: Tuesday, 29 October 2013] 48314.6.
- Page 23 and 24: Tuesday, 29 October 2013] 4833Progr
- Page 25 and 26: Tuesday, 29 October 2013] 48356. KE
- Page 27 and 28: Tuesday, 29 October 2013] 4837• T
- Page 29 and 30: Tuesday, 29 October 2013] 4839The f
- Page 31 and 32: Tuesday, 29 October 2013] 4841Budge
- Page 33 and 34: Tuesday, 29 October 2013] 4843The f
- Page 35 and 36: Tuesday, 29 October 2013] 4845Findi
- Page 37 and 38: Tuesday, 29 October 2013] 4847The P
- Page 39 and 40: Tuesday, 29 October 2013] 4849• T
- Page 41 and 42: Tuesday, 29 October 2013] 4851The f
- Page 43 and 44: Tuesday, 29 October 2013] 4853Respo
- Page 45: Tuesday, 29 October 2013] 4855balan
- Page 49 and 50: Tuesday, 29 October 2013] 4859(ii)
- Page 51 and 52: Tuesday, 29 October 2013] 4861Table
- Page 53 and 54: Tuesday, 29 October 2013] 48635.1.2
- Page 55 and 56: Tuesday, 29 October 2013] 4865proje
- Page 57 and 58: Tuesday, 29 October 2013] 48675.2 O
- Page 59 and 60: Tuesday, 29 October 2013] 4869• S
- Page 61 and 62: Tuesday, 29 October 2013] 4871busin
- Page 63 and 64: Tuesday, 29 October 2013] 4873repor
- Page 65 and 66: Tuesday, 29 October 2013] 48757.4 F
- Page 67 and 68: Tuesday, 29 October 2013] 48778.2.2
- Page 69 and 70: Tuesday, 29 October 2013] 4879(iii)
- Page 71 and 72: Tuesday, 29 October 2013] 4881It is
- Page 73 and 74: Tuesday, 29 October 2013] 48835. Re
- Page 75 and 76: Tuesday, 29 October 2013] 4885year
- Page 77 and 78: Tuesday, 29 October 2013] 48874.2.5
- Page 79 and 80: Tuesday, 29 October 2013] 48894.2.1
- Page 81 and 82: Tuesday, 29 October 2013] 48915. In
- Page 83 and 84: Tuesday, 29 October 2013] 4893• O
- Page 85 and 86: Tuesday, 29 October 2013] 48957. Re
- Page 87 and 88: Tuesday, 29 October 2013] 48973 Sec
- Page 89 and 90: Tuesday, 29 October 2013] 48999 Del
- Page 91 and 92: Tuesday, 29 October 2013] 490114 Am
- Page 93 and 94: Tuesday, 29 October 2013] 4903preca
- Page 95 and 96: Tuesday, 29 October 2013] 490526 Am
- Page 97 and 98:
Tuesday, 29 October 2013] 490731 Am
- Page 99 and 100:
Tuesday, 29 October 2013] 490939 Am
- Page 101 and 102:
Tuesday, 29 October 2013] 491147 Co
- Page 103 and 104:
Tuesday, 29 October 2013] 4913creat
- Page 105 and 106:
Tuesday, 29 October 2013] 4915The P
- Page 107 and 108:
Tuesday, 29 October 2013] 4917the c
- Page 109 and 110:
Tuesday, 29 October 2013] 491910. R
- Page 111:
Tuesday, 29 October 2013] 49218. Cl