Download Annual Report - Renata
Download Annual Report - Renata
Download Annual Report - Renata

Create successful ePaper yourself
Turn your PDF publications into a flip-book with our unique Google optimized e-Paper software.
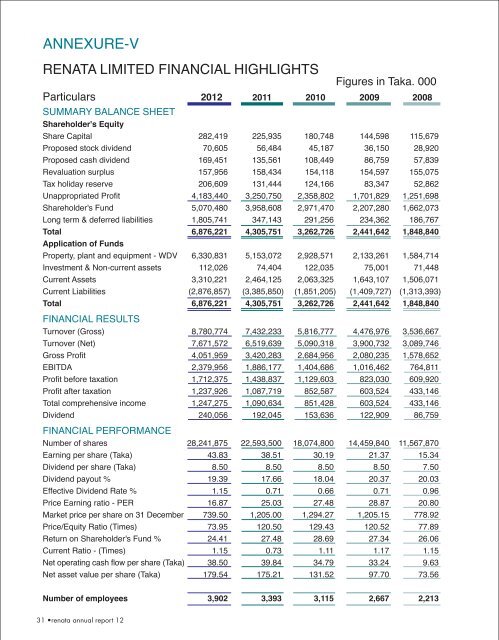
ANNEXURE-VRENATA LIMITED FINANCIAL HIGHLIGHTSFigures in Taka. 000Particulars 2012 2011 2010 2009 2008SUMMARY BALANCE SHEETShareholder's EquityShare Capital 282,419 225,935 180,748 144,598 115,679Proposed stock dividend 70,605 56,484 45,187 36,150 28,920Proposed cash dividend 169,451 135,561 108,449 86,759 57,839Revaluation surplus 157,956 158,434 154,118 154,597 155,075Tax holiday reserve 206,609 131,444 124,166 83,347 52,862Unappropriated Profit 4,183,440 3,250,750 2,358,802 1,701,829 1,251,698Shareholder's Fund 5,070,480 3,958,608 2,971,470 2,207,280 1,662,073Long term & deferred liabilities 1,805,741 347,143 291,256 234,362 186,767Total 6,876,221 4,305,751 3,262,726 2,441,642 1,848,840Application of FundsProperty, plant and equipment - WDV 6,330,831 5,153,072 2,928,571 2,133,261 1,584,714Investment & Non-current assets 112,026 74,404 122,035 75,001 71,448Current Assets 3,310,221 2,464,125 2,063,325 1,643,107 1,506,071Current Liabilities (2,876,857) (3,385,850) (1,851,205) (1,409,727) (1,313,393)Total 6,876,221 4,305,751 3,262,726 2,441,642 1,848,840FINANCIAL RESULTSTurnover (Gross) 8,780,774 7,432,233 5,816,777 4,476,976 3,536,667Turnover (Net) 7,671,572 6,519,639 5,090,318 3,900,732 3,089,746Gross Profit 4,051,959 3,420,283 2,684,956 2,080,235 1,578,652EBITDA 2,379,956 1,886,177 1,404,686 1,016,462 764,811Profit before taxation 1,712,375 1,438,837 1,129,603 823,030 609,920Profit after taxation 1,237,926 1,087,719 852,587 603,524 433,146Total comprehensive income 1,247,275 1,090,634 851,428 603,524 433,146Dividend 240,056 192,045 153,636 122,909 86,759FINANCIAL PERFORMANCENumber of shares 28,241,875 22,593,500 18,074,800 14,459,840 11,567,870Earning per share (Taka) 43.83 38.51 30.19 21.37 15.34Dividend per share (Taka) 8.50 8.50 8.50 8.50 7.50Dividend payout % 19.39 17.66 18.04 20.37 20.03Effective Dividend Rate % 1.15 0.71 0.66 0.71 0.96Price Earning ratio - PER 16.87 25.03 27.48 28.87 20.80Market price per share on 31 December 739.50 1,205.00 1,294.27 1,205.15 778.92Price/Equity Ratio (Times) 73.95 120.50 129.43 120.52 77.89Return on Shareholder's Fund % 24.41 27.48 28.69 27.34 26.06Current Ratio - (Times) 1.15 0.73 1.11 1.17 1.15Net operating cash flow per share (Taka) 38.50 39.84 34.79 33.24 9.63Net asset value per share (Taka) 179.54 175.21 131.52 97.70 73.56Number of employees 3,902 3,393 3,115 2,667 2,21331 •renata annual report 12