Download Annual Report - Renata
Download Annual Report - Renata
Download Annual Report - Renata

Create successful ePaper yourself
Turn your PDF publications into a flip-book with our unique Google optimized e-Paper software.
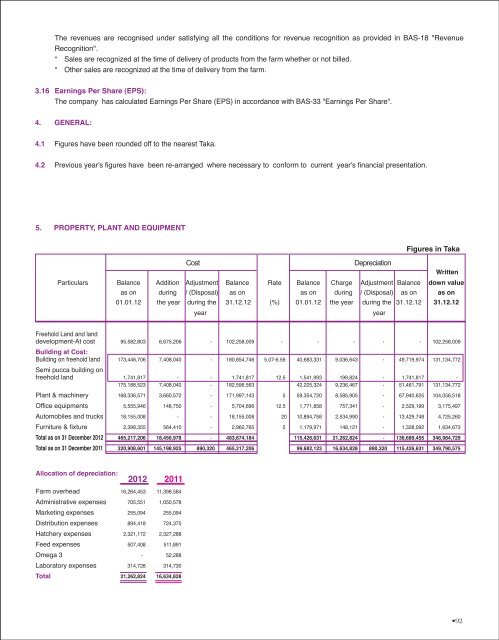
The revenues are recognised under satisfying all the conditions for revenue recognition as provided in BAS-18 "RevenueRecognition".* Sales are recognized at the time of delivery of products from the farm whether or not billed.* Other sales are recognized at the time of delivery from the farm.3.16 Earnings Per Share (EPS):The company has calculated Earnings Per Share (EPS) in accordance with BAS-33 "Earnings Per Share".4. GENERAL:4.1 Figures have been rounded off to the nearest Taka.4.2 Previous year's figures have been re-arranged where necessary to conform to current year's financial presentation.5. PROPERTY, PLANT AND EQUIPMENTFigures in TakaCostDepreciationWrittenParticulars Balance Addition Adjustment Balance Rate Balance Charge Adjustment Balance down valueas on during / (Disposal) as on as on during / (Disposal) as on as on01.01.12 the year during the 31.12.12 (%) 01.01.12 the year during the 31.12.12 31.12.12yearyearFreehold Land and landdevelopment-At cost95,582,8036,675,206-102,258,009-----102,258,009Building at Cost:Building on freehold land173,446,7067,408,040-180,854,7465.07-6.5940,683,3319,036,643-49,719,974131,134,772Semi pucca building onfreehold land1,741,817175,188,523-7,408,040--1,741,817182,596,56312.51,541,99342,225,324199,8249,236,467--1,741,81751,461,791-131,134,772Plant & machinery168,336,5713,660,572-171,997,143559,354,7208,585,905-67,940,625104,056,518Office equipments5,555,946148,750-5,704,69612.51,771,858757,341-2,529,1993,175,497Automobiles and trucks18,155,008--18,155,0082010,894,7582,534,990-13,429,7484,725,260Furniture & fixture2,398,355564,410-2,962,76551,179,971148,121-1,328,0921,634,673Total as on 31 December 2012465,217,20618,456,978-483,674,184115,426,63121,262,824-136,689,455346,984,729Total as on 31 December 2011320,908,601145,198,925890,320465,217,20699,682,12316,634,828890,320115,426,631349,790,575Allocation of depreciation:2012Farm overhead16,264,453Administrative expenses 705,551Marketing expenses255,094Distribution expenses894,418Hatchery expenses2,321,172Feed expenses507,408Omega 3-Laboratory expenses314,728Total21,262,824201111,398,5841,050,578255,094724,3752,327,288511,89152,288314,73016,634,828•92