25. Cost of salesAmount in Taka2012 2011Non-tax holiday Tax holiday UnitsUnits Cepha Penicillin Total Totalplant plantOpening stock of finished goodsAdd.Cost of goods manufactured (Note 25.1)Cost of finished goodsLess: Closing stock of finished goods (Note-10)572,729,6782,818,789,818276,829,4553,668,348,951653,130,3773,015,218,57484,233,395500,631,271-584,864,666104,750,769480,113,89722,965,978124,813,304-147,779,28223,498,110124,281,172679,929,0513,444,234,393276,829,4554,400,992,900781,379,2563,619,613,644517,464,6393,010,949,447250,870,9203,779,285,006679,929,0513,099,355,95525.1 Cost of goods manufactured2012 2011Non-tax holiday Tax holiday UnitsUnits Cepha Penicillin Total Totalplant plantOpening work-in-processAdd: Cost of raw materials consumed (Note 25.2)Less: Closing work-in-processCost of materialsManufacturing overheadSalaries, wages and other benefitsCompany's contribution to provident fundNet periodic cost for gratuityElectricity and fuelConsumable stores, supplies and -manufacturing expensesInsuranceLand revenue and taxesRentAutomobile expensesPostage and telephoneStationeries & SuppliesUniforms for workersTravelling and moving expensesRepair and maintenanceLunch, snacks and tea expensesDepreciationOther overhead expenses72,131,9542,167,209,9902,239,341,944103,404,2952,135,937,649682,852,169167,235,3392,874,20710,710,350105,554,78174,807,3435,466,1773,620,813364,34011,078,5102,008,1226,863,7653,272,19934,883,53843,790,91142,422,346161,789,2836,110,14522,818,543265,088,248287,906,79122,888,131265,018,660235,612,61123,153,352163,824828,96074,293,35218,173,00125,017286,69895,8161,157,929498,9962,020,717299,1675,631,85023,597,37618,234,93367,000,402151,2219,175,38431,536,41240,711,7968,833,30731,878,48992,934,8155,564,8366,66741,69048,075,3003,716,948-96,517-610,785221,320947,358175,5991,645,8855,281,8955,037,27421,347,319165,422104,125,8812,463,834,6502,567,960,531135,125,7332,432,834,7981,011,399,595195,953,5273,044,69811,581,000227,923,43396,697,2925,491,1944,004,028460,15612,847,2242,728,4389,831,8403,746,96542,161,27372,670,18265,694,553250,137,0046,426,78879,865,9782,258,690,8852,338,556,863104,125,8812,234,430,982776,518,465167,494,9322,104,4818,766,000108,628,938158,844,3124,939,4391,129,3242,646,3498,004,7151,727,6898,430,2571,615,91226,401,79554,722,43447,250,052167,511,6556,300,181Cost of goods manufactured2,818,789,818500,631,271124,813,3043,444,234,3933,010,949,44725.2 Cost of raw materials consumedOpening stockAdd: Purchase during the yearLess: Closing stock431,787,4872,391,893,4112,823,680,898656,470,9082,167,209,99049,205,740254,159,194303,364,93438,276,686265,088,2484,717,15837,855,14242,572,30011,035,88831,536,412485,710,3852,683,907,7473,169,618,132705,783,4822,463,834,650436,812,4402,307,588,8302,744,401,270485,710,3852,258,690,885•74
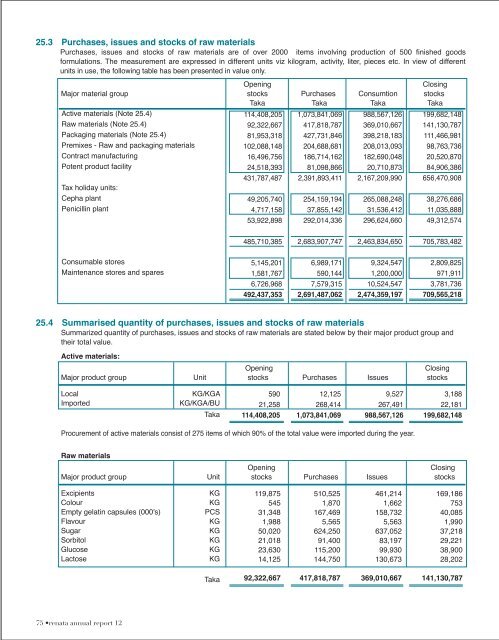
25.3 Purchases, issues and stocks of raw materialsPurchases, issues and stocks of raw materials are of over 2000 items involving production of 500 finished goodsformulations. The measurement are expressed in different units viz kilogram, activity, liter, pieces etc. In view of differentunits in use, the following table has been presented in value only.OpeningClosingMajor material group stocks Purchases Consumtion stocksTaka Taka Taka TakaActive materials (Note 25.4)Raw materials (Note 25.4)Packaging materials (Note 25.4)Premixes - Raw and packaging materialsContract manufacturingPotent product facilityTax holiday units:Cepha plantPenicillin plant114,408,20592,322,66781,953,318102,088,14816,496,75624,518,393431,787,48749,205,7404,717,15853,922,8981,073,841,069417,818,787427,731,846204,688,681186,714,16281,098,8662,391,893,411254,159,19437,855,142292,014,336988,567,126369,010,667398,218,183208,013,093182,690,04820,710,8732,167,209,990265,088,24831,536,412296,624,660199,682,148141,130,787111,466,98198,763,73620,520,87084,906,386656,470,90838,276,68611,035,88849,312,574485,710,3852,683,907,7472,463,834,650705,783,482Consumable storesMaintenance stores and spares5,145,2011,581,7676,726,968492,437,3536,989,171590,1447,579,3152,691,487,0629,324,5471,200,00010,524,5472,474,359,1972,809,825971,9113,781,736709,565,21825.4 Summarised quantity of purchases, issues and stocks of raw materialsSummarized quantity of purchases, issues and stocks of raw materials are stated below by their major product group andtheir total value.Active materials:OpeningClosingMajor product group Unit stocks Purchases Issues stocksLocalImportedKG/KGAKG/KGA/BUTaka59021,258114,408,20512,125268,4141,073,841,0699,527267,491988,567,1263,18822,181199,682,148Procurement of active materials consist of 275 items of which 90% of the total value were imported during the year.Raw materialsOpeningClosingMajor product group Unit stocks Purchases Issues stocksExcipientsColourEmpty gelatin capsules (000's)FlavourSugarSorbitolGlucoseLactoseKGKGPCSKGKGKGKGKG119,87554531,3481,98850,02021,01823,63014,125510,5251,870167,4695,565624,25091,400115,200144,750461,2141,662158,7325,563637,05283,19799,930130,673169,18675340,0851,99037,21829,22138,90028,202Taka92,322,667417,818,787369,010,667141,130,78775 •renata annual report 12